


[V]isual displays are distinctively involved in scientific communication and in the very construction of scientific facts … Such representations constitute the physiognomy of the object of the research (Lynch, Reference Lynch, Lynch and Woolgar1990, p. 154).
Introduction
Visual Inscriptions in Science
The effective communication of scientific research is crucial for optimal knowledge cumulation and transfer. One of the principal ways in which such communication can be ensured is through the systematic inclusion of scientific inscriptions in theory and practice. A scientific inscription is a specific type of visualization aid that provides a visual display in scientific text (Latour, Reference Latour, Lynch and Woolgar1990). Common inscription types include graphs, tables, and figures that provide readers with a visual representation of information. Graphs, in particular, offer a unique perspective on datasets that allow for a more complete understanding of results. Furthermore, according to Latour (Reference Latour, Lynch and Woolgar1990), graphs are immutable and durable, readable, scalable, and easily merged, and, as such, transcend scientific disciplines by allowing researchers from different backgrounds to see and discuss phenomena in a way that might not otherwise be possible. For example, if a researcher is studying sleep patterns, the EEG recording is a graphical representation providing a clear visualization of a phenomenon that is constantly changing with time (readable, durable, immutable). The recording allows one to focus on specific parts of the sleep pattern by rendering a larger version of a single portion of the recording (scalable) at the same time as patterns from multiple participants can be placed on a single graph (easily merged).
Philosophers of science argue that graphs are central to progress in all disciplines (i.e., Latour, Reference Latour, Lynch and Woolgar1990; Lynch, Reference Lynch1985) and that use of visual inscriptions could lead to increased disciplinary codification (Smith, Best, Stubbs, Johnston, & Bastiani Archibald, Reference Smith, Best, Cylke and Stubbs2000). Thus, their inclusion in the disciplinary lexicon can provide a way for researchers to identify the move towards a higher degree of disciplinary codification (for more information on paradigm shifts in science, see Kuhn, Reference Kuhn1970) in a manner similar to the increased knowledge development associated with other data analytic techniques (i.e., meta-analysis; Chan & Arvey, Reference Chan and Arvey2012).
The first comprehensive study of graph use was conducted by Cleveland (Reference Cleveland1984), who examined articles published in scientific journals in 1980–1981. For each discipline, four journals were surveyed (or five in the case of economics and physics), with 50 articles randomly drawn from each journal. Cleveland found a continuum of graph use such that chemistry and physics used the most graphs, followed by biology, medicine, psychology, economics, and sociology. In an extension of Cleveland’s findings, Smith, Best, Stubbs, et al. (2000) reported a near-perfect linear relationship (r = .97) between graph use and perceived disciplinary hardness, hardness having been operationalized as level of scientific development (Smith, Best, Stubbs, et al., Reference Smith, Best, Cylke and Stubbs2000). Thus, taking both sets of results into account, it appears that harder or more codified disciplines (i.e., natural sciences) use more graphs than do softer or less codified disciplines (i.e., social sciences). It is important to note that both Cleveland (Reference Cleveland1984) and Smith, Best, Stubbs, et al. (2000) reported that differences in graph use did not appear to be attributable to a lack of data presented in social science journals. Indeed, the amount of data presented in all disciplines was almost identical.
To further investigate this relationship within psychology, Smith, Best, Stubbs, Bastiani Archibald, and Robertson-Nay (2002) examined graph and table use in journals that encompassed hard (e.g., behavioural neuroscience) and soft (e.g., counseling psychology) sub-disciplines. They reported a strong positive relation between sub-disciplinary hardness and graph use as well as a strong inverse relation between hardness and table use. In an attempt to validate Cleveland (Reference Cleveland1984), Smith, Best, Stubbs, et al. (2000), and Smith et al. (Reference Smith, Best, Stubbs, Bastiani Archibald and Robertson-Nay2002), Goggin and Best (Reference Goggin and Best2013) examined the use of inscriptions in 16 criminology and criminal justice (CCJ) journals. The results indicated that CCJ fell between sociology and psychology on the disciplinary continuum. Although CCJ used fewer graphs than did psychology, when sub-disciplinary differences within CCJ were examined, the pattern of graph and table use was comparable to that of the softer psychology sub-disciplines.
Differences in graph use have been documented across disciplines (Cleveland, Reference Cleveland1984; Smith, Best, Stubbs, et al., Reference Smith, Best, Cylke and Stubbs2000), as well as within disciplines (Best, Smith, & Stubbs, Reference Best, Smith and Stubbs2001; Goggin & Best, Reference Goggin and Best2013; Smith et al., Reference Smith, Best, Stubbs, Bastiani Archibald and Robertson-Nay2002), and within individual journals (Best, Reference Best2005; Fanjoy, MacNeill, & Best, Reference Fanjoy, MacNeill, Best, Cox, Plimmer and Rodgers2012; Yamashita, Bailer, & Kunkel, Reference Yamashita, Bailer and Kunkel2012). It is important to note that the widely documented differences in graph use are not synonymous with differences in the amount of data presented (Cleveland, Reference Cleveland1984; Smith et al., Reference Smith, Best, Stubbs, Bastiani Archibald and Robertson-Nay2002). Overall, the results suggested that graph use is proportional to the codification of disciplines and tends to support the idea that graphs are a powerful means of communication (Latour, Reference Latour, Lynch and Woolgar1990) which are used differentially by researchers in diverse disciplines.
Linking Science to Practice through Visual Inscriptions
Gerontology is a relatively young multidisciplinary field (Bass, Reference Bass2013; Lowenstein, Reference Lowenstein2004) and did not emerge as an independent discipline until the early 20th century (Achenbaum, Reference Achenbaum1995; Andrews, Campbell, Denton, & McGilton, Reference Andrews, Campbell, Denton and McGilton2009). According to Metchnikoff (Reference Metchnikoff1903), gerontology refers to the scientific study of the aging process, which should not only be examined by the field of medicine but also by a variety of other disciplines. By contrast, geriatrics identifies a separate medical sub-specialty whose primary focus is diseases that typically affect older people (Nascher, Reference Nascher1909). According to Mercer and Carter (Reference Mercer and Carter2012), psychology, sociology, biology, and related health sciences are the founding disciplines of gerontology. Researchers interested in biology-based factors, such as disease models within aging, have mainly contributed to journals that focus on the medical sub-discipline of geriatrics. In contrast, social science researchers interested in the sociological and psychological processes of aging have been more likely to publish in gerontology journals.
To date, there has been little examination of how gerontology communicates its research findings (Farkas, Jette, Tennstedt, Haley, & Quinn, Reference Farkas, Jette, Tennstedt, Haley and Quinn2003). Given its reliance on large complex datasets, it is imperative that the discipline take advantage of developments in other areas of science where advances in public policy typically rely on the inclusion of sophisticated data visualization techniques. With the exception of Yamashita et al.’s (2012) review of graph usage in The Gerontologist between 2001 and 2010, few studies have been conducted to determine how data visualization techniques are used in gerontology. Further, because gerontology research is diverse and encompasses both qualitative and quantitative research, the use of appropriate inscriptions can provide a common language and allow for a wider dissemination of information (Latour, Reference Latour, Lynch and Woolgar1990).
Although there has been some discussion in gerontology regarding the gap between theory and practice (Achenbaum, Reference Achenbaum2010; Alkema & Alley, Reference Alkema and Alley2006; Hendricks, Applebaum, & Kunkel, Reference Hendricks, Applebaum and Kunkel2010), the diversity of the researchers and consumers coupled with the complexity of the data makes effective communication essential. According to Farkas et al. (Reference Farkas, Jette, Tennstedt, Haley and Quinn2003), knowledge dissemination and utilization are central to the development of effective strategies that allow research findings to be transferred to the field, but most dissemination practices in research are not organized or planned to achieve comprehensive and maximum impact. As noted by Myers (Reference Myers1988), “the iconography of a science is more likely to have an impact on the public than the words or mathematics, which may be incomprehensible to them” (p. 235).
In other health research domains (Morgan et al., Reference Morgan, Estabrooks, Norton, Cummings, Birdsell, Squires and Hutchinson2009), including the field of dementia (Draper, Low, Withall, Vickland, & Ward, Reference Draper, Low, Withall, Vickland and Ward2009), there has been some discussion of the importance of utilizing effective communication strategies to translate research knowledge into practice. This would allow research findings to be more accessible to health care practitioners, policy-makers, as well as those in the private sector (Graham et al., Reference Graham, Logan, Harrison, Straus, Tetroe, Caswell and Robinson2007). Graham and Tetroe (Reference Graham and Tetroe2007) have argued that knowledge translation strategies are underdeveloped in health research and are greatly needed to bridge the divide among researchers, practitioners, and the general public. The growing volume and availability of gerontological data speaks to the need for the development of visualization techniques that foster knowledge cumulation and dissemination.
Although gerontology has a history of utilizing longitudinal methods, as well as statistical and multivariate analysis (Cutler, Reference Cutler1995), its relatively slow maturation as a discipline is due, in part, to a lack of well-defined theories, shared techniques, and distinctive research methodologies. This, in turn, has hampered knowledge transfer (Achenbaum, Reference Achenbaum1995; Alkema & Alley, Reference Alkema and Alley2006; de Medeiros, Reference de Medeiros2014). It is crucial that the results of gerontological research be effectively communicated to clients, practitioners, and policy-makers, as well as the general public. One means of achieving that objective is to ensure that the discipline is using those knowledge cumulation and dissemination techniques (i.e., inscriptions) whose empirical utility has been confirmed (Arsenault, Smith, & Beauchamp, Reference Arsenault, Smith and Beauchamp2006; Cleveland, Reference Cleveland1984; Funkhouser, Reference Funkhouser1937; Smith et al., Reference Smith, Best, Stubbs, Bastiani Archibald and Robertson-Nay2002). Therefore, the primary purpose of the present study was to examine the use of graphs, tables, and figures in a selected sample of gerontology journals.
Purpose of the Current Study
Given the recent surge in research on aging populations, it is important for researchers in gerontology and related fields to effectively communicate their results across a wide range of situations. As noted previously, there has been little examination to date regarding how gerontology communicates its research findings (Farkas et al., Reference Farkas, Jette, Tennstedt, Haley and Quinn2003). Given its reliance on large and complex datasets, it is imperative that the discipline take advantage of developments in other areas of science where advances in public policy typically rely on the inclusion of sophisticated data visualization techniques. With the exception of Yamashita et al.’s (2012) review of graph usage in The Gerontologist between 2001 and 2010, few studies have been conducted to determine how data visualization techniques are used in gerontology.
Research Questions
-
1. What is the relative frequency of inscription use in gerontology?
-
2. Are there proportional differences in the amount of page space dedicated to various inscription types in gerontology journals?
-
3. Have there been changes in inscription use in gerontology journals based on five-year publication intervals?
-
4. Where does gerontology lie on the continuum of inscription use relative to other disciplines?
Methods
Sample
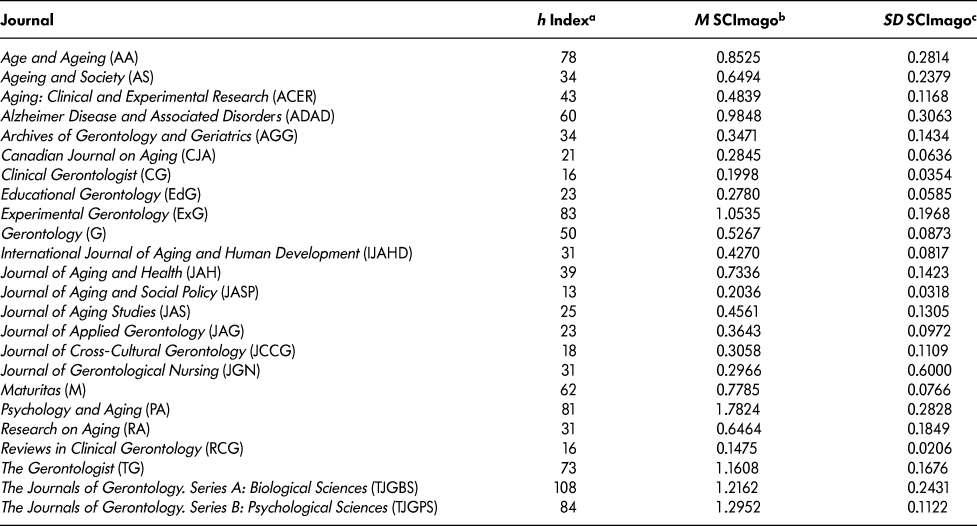
A comprehensive search located 157 gerontology journal titles, of which 24 (15.3%) met the following inclusion criteria: the journal’s primary focus was gerontology and it had a minimum 15-year publication record (i.e., 1995−2009, inclusive) whereas those whose primary focus was geriatrics were excluded from the sample. We selected the 1995−2009 period to (a) capture the scope of modern gerontological research, and (b) allow for comparisons with the results of Smith et al. (Reference Smith, Best, Stubbs, Bastiani Archibald and Robertson-Nay2002) and Goggin and Best (Reference Goggin and Best2013). In 1995, the Journal of Gerontology split into two distinct series; Series A: Biological Sciences and Series B: Psychological Science. Given that these series are regarded as the leading journals in the field, we selected 1995 as a start date to include them in the sample. Further, although there were some restrictions on the numbers of graphs and tables allowed in a single article, the majority of journals had no specific guidelines about the maximum number of visualizations that could be used (see Table 1).
Impact rankings for selected gerontology journals

a h-Index = number of articles per journal with “h” citations (Hirsch, Reference Hirsch2005).
b SCImago M = mean SJR impact factor from 1999 to 2009 (www.scimagojr.com).
c SCImago SD = standard deviation SJR impact factor from 1999 to 2009 (www.scimagojr.com).
Fifteen articles published between 1995 and 2009, inclusive, were randomly selected from each of 24 journal titles (Table 1) for each of the following intervals: 1995−1999, 2000−2004, and 2005−2009. This study is part of a larger project examining graph use in different scientific disciplines, and a sample of 15 articles/journal allows for comparisons with psychology (Smith et al., Reference Smith, Best, Stubbs, Bastiani Archibald and Robertson-Nay2002), criminology and criminal justice (Goggin & Best, Reference Goggin and Best2013), and biology (Best et al., Reference Best, Goggin, Buhay, Caissie, Boone, Gaudet, Pracana and Wang2016). Although selecting a specific proportion of articles would provide proportional representation, because one of our goals was to interpret the current results with respect to other disciplines, we selected a comparable sample size.
Among these journals, 15,791 research articles were published between 1995 and 2009. The average percentage of sampled articles per journal ranged from 1.1 per cent to 5.6 per cent (M = 2.49%, SD = 1.23%). Although we sampled only a small percentage of published articles, our sample was randomly drawn, which helps to ensure that it is representative of published articles (Tabachnick & Fidell, Reference Tabachnick and Fidell2007). It is also significant that we were not interested in making comparisons between specific journals but in how inscription use in published gerontological research changed over time. As our interest was only in articles that presented theoretical or empirical findings, editorials, letters, book reviews, addenda, and errata were excluded from the sample. Although we recognize that visualization usage may differ by type of research (i.e., quantitative vs. qualitative), we did not distinguish our results according to research methodology. In the case of one journal, three of the years surveyed were unavailable, yielding a final sample of 357 original articles for review.
To examine the relative impact of the selected journals, two metrics were used (Table 1). The first, SCImago Journal Rank (SJR), is an iterative calculation based on numbers of articles per journal, numbers of references of a journal, and numbers of citations received by a journal (SCImago, 2007). In this instance, SJR values were available for each of the years 1999 to 2011, inclusive. To be consistent with the time period of the sampled journals (i.e., 1995−2009), mean SJR values (SD) for the period 1999 to 2009, inclusive, were calculated for each title. The second metric used was Hirsch’s (2005) h-Index which measures the relative output and influence of an individual scholar or group of scholarly papers (Hirsch, Reference Hirsch2005). For example, an h of 10 indicates the number of articles in a particular journal which have received at least 10 citations.
Coding the Sample
In addition to inscription information (described below), the following data were also coded for each study: (a) journal information: title; year and decade of publication; volume; pages; and (b) study demographics: number of authors; first author’s identity, discipline, and affiliation; country of study; source of research funding. Copies of the coding guide and coding instructions are available from the first author upon request.
Defining Inscriptions
Graphs
Following Cleveland (Reference Cleveland1984), we defined a graph as any figure that has scales and displays quantitative information (Goggin & Best, Reference Goggin and Best2013). Graphs were characterized as follows: map/area graph, bar graph (stacked or cluster), histogram, time series line graph, frequency polygon, scatterplot, population pyramid, pie graph, or miscellaneous. Multi-panel graphs were composed of more than one distinct graph which used a single figure caption. Panels were defined as graph components displaying unique axes and datasets. For example, a scatterplot that included a linear regression would not be considered a multi-panel graph, but a figure that included separate panels to present a scatterplot and line graph would be a multi-panel graph. In all cases, we counted multi-panel graphs as a single graph and also recorded the number of panels.
For each article, numbers and types of graphs as well as total graph area (TGA) and fractional graph area (FGA) were recorded. We measured the total page space of an article (the height and width of a page were measured using a ruler and total article area was calculated by multiplying page area by number of pages). FGA was calculated as follows: TGA / Total Page Area (Cleveland, Reference Cleveland1984).
Tables
A table was defined as information presented in a series of rows and columns distinct from the main body of text (Goggin & Best, Reference Goggin and Best2013; Smith et al., Reference Smith, Best, Stubbs, Bastiani Archibald and Robertson-Nay2002). Tables were classified as either data or non-data depending upon their content. Non-data tables typically present qualitative information, such as lists of treatments or proposed statistical analyses. Tables with multiple sections were counted as a single table if each section was designated by the same table number (i.e., Table 1a, Table 1b, etc.). For each article, numbers and types of tables, plus total table area (TTA) and fractional table area (FTA) were recorded as described above. FTA was calculated as follows: TTA / Total Page Area (Smith, Best, Stubbs, et al., Reference Smith, Best, Cylke and Stubbs2000; Smith et al., Reference Smith, Best, Stubbs, Bastiani Archibald and Robertson-Nay2002).
Non-graph illustrations
A non-graph illustration, or figure, was defined as any visual inscription that did not meet the criteria of a graph or table (Goggin & Best, Reference Goggin and Best2013). Common non-graph illustrations include photographs, schematics, or methodological illustrations. For each article, we recorded numbers and types of figures as well as total figure area (TFA) and fractional figure area (FFA). FFA was calculated as follows: TFA / Total Page Area (Smith, Best, Stubbs, et al., Reference Smith, Best, Cylke and Stubbs2000; Smith et al., Reference Smith, Best, Stubbs, Bastiani Archibald and Robertson-Nay2002).
In this study, we chose to use fractional areas to measure the page space dedicated to graphs, tables, and figures (fractional areas). Although different metrics could be used, Cleveland (Reference Cleveland1984), Smith, Best, Cylke, & Stubbs (Reference Smith, Best, Cylke and Stubbs2000), Smith et al., Reference Smith, Best, Stubbs, Bastiani Archibald and Robertson-Nay2002), and Goggin and Best (Reference Goggin and Best2013) used proportional areas to control for differences in article length. Because we were concerned with the critique that fractional areas could be increased simply by resizing an inscription, we examined the correlations between fractional areas and ways of measuring inscription use. The correlations between the fractional areas and graphs per page, tables per page, and illustrations per page were high (average correlation r = +.85). Further, the correlations between fractional areas and total numbers of graphs, tables, and illustrations were also high (average correlation r = +.84).
Inter-Rater Reliability
Each author coded approximately one third of the sample (LC: n = 114, 31.9%; CG: n = 124, 34.4%; LB: n = 119, 33.3%). Inter-rater reliability coding was then conducted on a random sample of approximately 13 per cent (n = 48) of all articles such that each author coded an additional 16 articles. The reliability coding schedule ensured that 2 articles from each journal were coded by someone other than the original coder. For example, of the 16 articles selected for the reliability sample which were originally coded by the first author, half were coded by the second author with the remainder being coded by the third author.
Reliability of coding was assessed by comparing FGA, FTA, and FFA values. A minimum concordance rate of 90 per cent was established as the criterion of agreement for each measure of fractional area. Agreement among the three raters was very high with intraclass correlation values exceeding r = 0.92 for each of the measures compared (i.e., r FGA = 0.92; r FTA = 0.96; r FFA = 0.99).
Results
Sample Descriptives
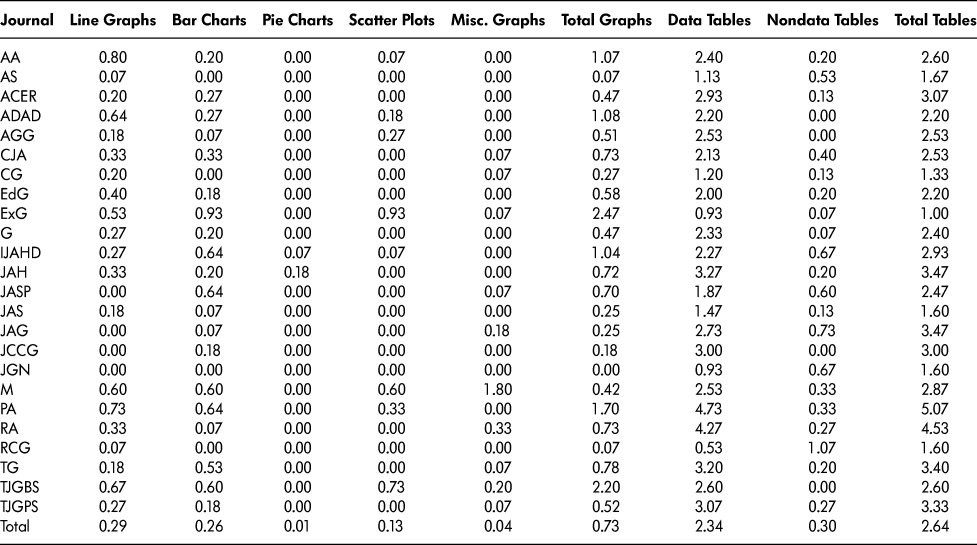
Sampled articles were, on average, 13.25 pages long (SD = 7.07) and, collectively, included 261 graphs (M = 0.70 graphs/article) and 952 tables (M = 2.64 tables/article). As indicated in Table 2, data were most commonly presented using line graphs (n = 104) or bar charts (n = 93) which, collectively, represented 75 per cent of all graph types in the sample. Further, most of the tables we sampled presented empirical data. On average, articles included 2.64 tables, of which 2.34 were data tables. By comparison, the sample included fewer non-graph illustrations (M = 0.44 figures/article; n = 159), with the majority of these being photographs (n = 50; 31.45%) or sketches (n = 19; 11.95%). Collectively, 87.68 per cent of articles (n = 313) included some type of inscription; 30.50 per cent included at least one graph, 78.71 per cent included at least one table, and 18.77 per cent included at least one figure.
Mean number of inscriptions per page for selected gerontology journals

Inscription Use in Gerontology
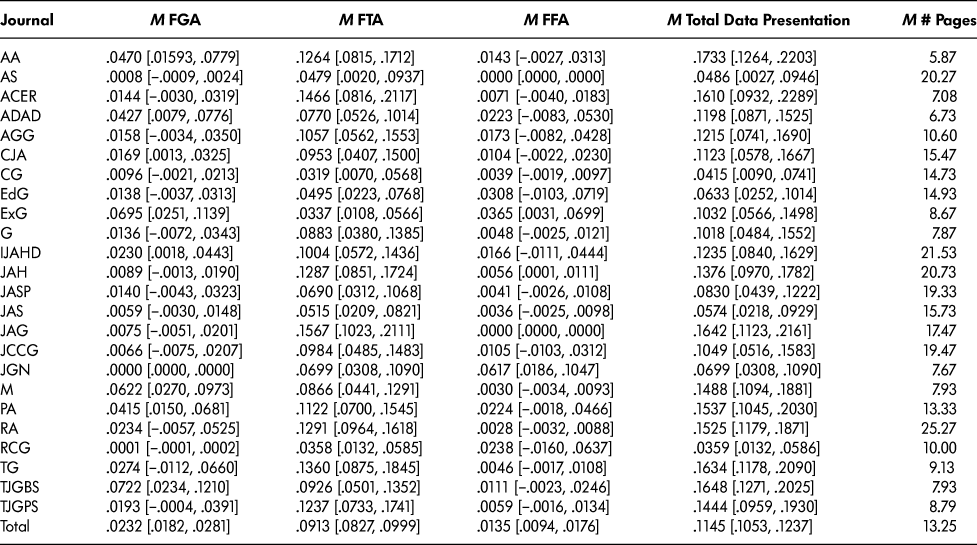
Following Cleveland (Reference Cleveland1984) and Smith et al. (Reference Smith, Best, Stubbs, Bastiani Archibald and Robertson-Nay2002), differences per inscription type per journal were examined by comparing the proportion of page space (see Table 3) allotted to graphs (FGA), tables (FTA), and non-graph illustrations (FFA). Overall, researchers devoted more page space to tables (9.13%) than to graphs (2.32%) with the use of non-graph illustrations being least common (1.35%). Collectively, 11.45 per cent of page space was dedicated to the presentation of data (i.e., graphs plus tables). As noted in Table 2, there were differences in graph and table usage among the sampled journals. For example, FGA ranged from 0.00 per cent in Journal of Gerontological Nursing to 7.22 per cent in The Journals of Gerontology. Series A: Biological Sciences, with FTA ranging from 3.19 per cent in Clinical Gerontologist to 15.67 per cent in Journal of Applied Gerontology. Overall, data presentation space ranged from 3.59 per cent in Reviews in Clinical Gerontology to 17.33 per cent in Age and Ageing.
Mean FGA, FTA, and FFA (and 95% CIs about the M) plus total data presentation and mean number of pages per journal for selected gerontology journals.

Note: FFA = fractional figure area; FGA = fractional graph area; FTA = fractional table area.
Inscription Use over Time
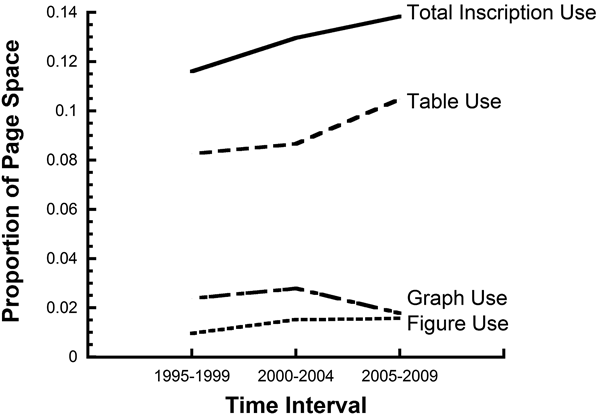
To examine whether page space dedicated to inscriptions changed over time, FGA, FTA, and FFA values were calculated for each five-year interval. A 3 × 3 (inscription type × time interval) repeated-measures analysis of variance (ANOVA) indicated statistically significant discipline differences in inscription use [F(2, 708) = 164.92, p = 0.0001]. Post hoc tests (all ps < .05) indicated that articles dedicated significantly more page space to tables than to graphs or non-graph illustrations. Neither the main effect of time interval [F(2, 354) = 1.70, p = 0.18] nor the interaction between inscription type and time interval [F(4, 712) = 1.95, p = 0.10] was statistically significant. Figure 1 shows that the use of graphs, tables, and figures was stable over time, and, although the interaction was not statistically significant, the page space dedicated to graphs actually decreased over time.
Changes in graph, table, and illustration usage in selected gerontology journals (1995−2009)

To further investigate whether there was a statistical decrease in graph use, a second 3 × 3 repeated measures ANOVA was conducted using the total number of graphs, tables, and non-graph illustrations. In this case, the main effect of time interval [F(2, 354) = .13, p = 0.88] and the interaction between inscription type and time interval [F(4, 708) = .17, p = 0.95] were not statistically significant. Thus, although there was a trend towards less page space being dedicated to graphical presentation, the total number of graphs remained stable over time.
Comparisons with Other Areas of Science
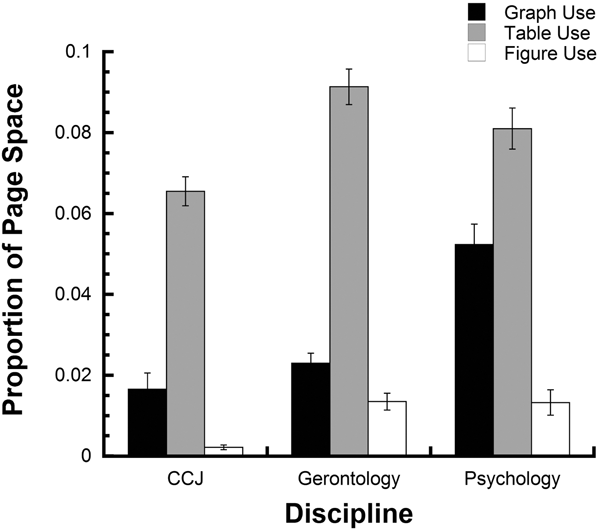
To compare differences in the use of inscriptions in gerontology, CCJ, and psychology journals, the present dataset was compared with that of Goggin and Best (Reference Goggin and Best2013) and Smith et al. (Reference Smith, Best, Stubbs, Bastiani Archibald and Robertson-Nay2002). The results of a 3 × 3 (discipline × inscription type) mixed measures ANOVA indicated a statistically significant main effect of inscription type [F(2, 1884) = 285.21, p = .0001], indicating that tables (M FTA = 0.08) were used significantly more frequently than graphs (M FGA = 0.03), which, in turn, were used significantly more often than non-graph illustrations (M FFA = .01). There was also a statistically significant main effect of discipline [F(2, 942) = 29.23, p = .0001], indicating differences among the three disciplines, with inscription use in gerontology being less than that of psychology but greater than that of CCJ (M PSYC = .05; M GERO = 0.04; M CCJ = 0.03). Figure 2 illustrates a statistically significant interaction between inscription type and discipline [F(4, 1884) = 7.88, p = .0001]. Post hoc tests (all ps < .001) showed that less page space was dedicated to graphical displays in gerontology and CCJ articles. Page space dedicated to tables and figures was significantly higher in gerontology and psychology and lower in CCJ articles.
Fractional areas (standard error of the mean) dedicated to inscriptions in psychology (Smith et al., Reference Smith, Best, Stubbs, Bastiani Archibald and Robertson-Nay2002) and criminology and criminal justice (CCJ) (Goggin & Best, Reference Goggin and Best2013) as compared with those in selected gerontology journals

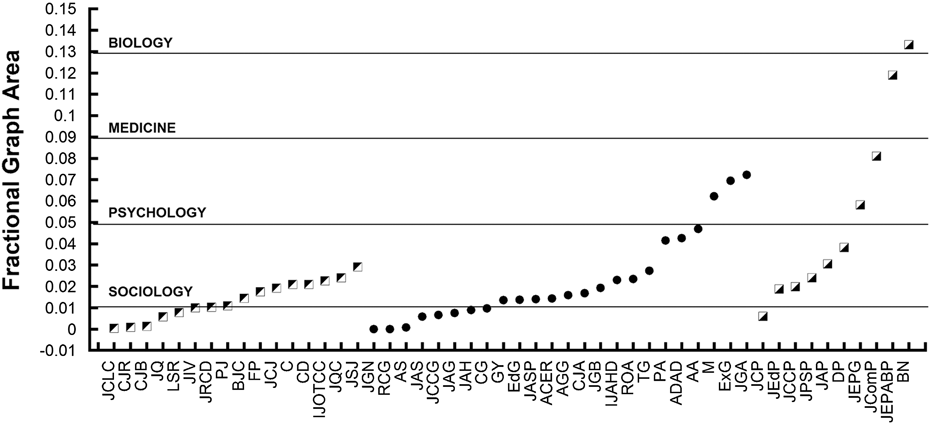
Smith, Best, Stubbs, et al. (2000), Smith et al., (Reference Smith, Best, Stubbs, Bastiani Archibald and Robertson-Nay2002), Best et al. (Reference Best, Smith and Stubbs2001), and Arsenault et al. (Reference Arsenault, Smith and Beauchamp2006) have reported positive relationships between hardness of scientific disciplines and graph use. To examine this relationship within the current sample, we compared graph use in gerontology with that in CCJ and psychology (see Figure 3), as well as comparable scientific disciplines. The figure illustrates several interesting points. First, in terms of graph use, gerontology articles tended to include more graphs than sociology and fewer graphs than psychology. Second, there is overlap between the disciplines. For example, in some gerontology journals (e.g., Journal of Experimental Gerontology), graph use is similar to that in the harder sub-disciplines of psychology (e.g., Journal of Experimental Psychology: General). Third, the graph also displays related disciplinary means and illustrates that the multi-disciplinary nature of the three disciplines can be predicted by the extent of their graph use. Gerontology journals that are more biological in focus tend to have FGAs that are similar to the averages of biology journals and, equally, those that are more influenced by sociology tend to dedicate less space to graph use.
Graph use in selected gerontology journals (filled circles) as compared with that in criminology and criminal justice (filled left diagonal) and psychology (filled right diagonal) journals
Note: JCLC = Journal of Criminal Law and Criminology; CJR = Criminal Justice Review; CJB = Criminal Justice and Behavior; JQ = Justice Quarterly; LSR = Law and Society Review; JIV = Journal of Interpersonal Violence; JRCD = Journal of Research in Crime and Delinquency; PJ = Prison Journal; BJC = British Journal of Criminology; FP = Federal Probation; JCJ = Journal of Criminal Justice; C = Criminology; CD = Crime and Delinquency; IJOTCC = International Journal of Offender Therapy and Comparative Criminology; JQC = Journal of Quantitative Criminology; JSJ = Justice System Journal; JCP = Journal of Counseling Psychology; JEdP = Journal of Educational Psychology; JCCP = Journal of Consulting and Clinical Psychology; JPSP = Journal of Personality and Social Psychology; JAP = Journal of Abnormal Psychology; DP = Developmental Psychology; JEPG = Journal of Experimental Psychology: General; JComP = Journal of Comparative Psychology; JEPABP = Journal of Experimental Psychology: Animal Behavior Processes; BN = Behavioral Neuroscience.

Discussion
When examining inscription use in gerontology, we found that researchers devoted approximately 11 per cent of article space to visual presentation. Tables were the most commonly used inscription type, with an estimated 2.64 tables per article. In contrast to some areas in science, graphs were less utilized in this dataset, with an average of 0.70 graphs per article. We recognize that we sampled only a small proportion of articles but are confident that the sample adequately represents published gerontology articles. There are several reasons for our confidence. First, although a random sample does not ensure representativeness, it is an accepted standard to avoid sampling error and selection bias. Second, we were not interested in specific comparisons between journals but only in the way that inscriptions were used by gerontology researchers. To control for journal-specific practices, we selected 15 articles from each of the journals included in our sample of gerontology journals. Finally, our results fit almost perfectly with theoretical predictions and confirm past conclusions about the relation between inscription use and disciplinary differences. We compared graph use in gerontology with that of other disciplines and found that, in keeping with the results of research by Smith, Best, Stubbs, et al. (2000), Smith et al., (Reference Smith, Best, Stubbs, Bastiani Archibald and Robertson-Nay2002) and others (Arsenault et al., Reference Arsenault, Smith and Beauchamp2006), use of visual inscriptions and disciplinary hardness were directly related.
Although disciplinary hardness was not a principal purpose of the current study, our results concur with those from previous research in this area. That is, the literature has consistently demonstrated a strong positive relationship between perceived disciplinary hardness and paradigm development (Biglan, Reference Biglan1973; Lodahl & Gordon, Reference Lodahl and Gordon1972; Simonton, Reference Simonton2004; Smith, Best, Stubbs, et al., Reference Smith, Best, Cylke and Stubbs2000). Such a pattern was also found in the present study and is illustrated in Figure 3, where the overlap in graph use among journals in gerontology, CCJ, and psychology is clearly displayed. This lends further evidence to the concept of science as a hierarchy whose relative development can be assessed, in part, by examining the extent to which graphs are used at both the discipline and sub-discipline levels (Smith, Best, Stubbs, et al., Reference Smith, Best, Cylke and Stubbs2000; Smith et al., Reference Smith, Best, Stubbs, Bastiani Archibald and Robertson-Nay2002). The present results position the field on the continuum between sociology and psychology, a finding which is not unexpected given the multidisciplinary nature of the field.
Following Arsenault et al. (Reference Arsenault, Smith and Beauchamp2006), we generated a heterogeneity index (HI) by calculating the mean number of inscription types used in sample articles. For example, articles that included no inscriptions (i.e., graphs, tables, or non-graph illustrations) were scored as 0, articles that included at least one of the three types were scored as 1, articles that included any two inscription types were scored as 2, and those that included all three types were scored as 3. HI values ranged from 0 to 3 with a M = 1.28 (SD = 0.73) and reflected the cumulative number of inscription types. Within the current sample, 12.32 per cent of articles included no inscriptions, 51.82 per cent contained a single type of inscription, 31.37 per cent contained at least two types of inscriptions, and 4.48 per cent contained all three types. This suggests that most gerontology researchers used one or two types of inscriptions with the most common inscription combination being graphs plus tables (21.01%).
To assess the relationship between inscription use and scientific impact, HI was correlated with mean SJR (SCImago, 2007) and h-Index (Hirsch, Reference Hirsch2005). Results indicated a positive relationship between HI and both impact metrics (M SJR: r = 0.34, n = 357, p = .0001, 95% CI = .30, .39; h-Index: r = .34, n = 357, p = .0001, 95% CI = .30, .39), suggesting that gerontology journals with higher impact ratings were more likely to use a wider range of inscription types. Of equal interest, there was also a statistically significant correlation between the number of inscriptions per article and measures of journal impact (M SJR: r = 0.30, n = 357, p = .0001, 95% CI = .25, .35; h-Index: r = .25, n = 357, p = .0001, 95% CI = .20, .31). Although other factors certainly affect scientific impact, these results suggest that using a wider variety of inscriptions, and more of them, does affect scientific impact. Understanding the relationship between scientific impact and inscription use is important because high-impact scientific journals such as Science (Fanjoy et al., Reference Fanjoy, MacNeill, Best, Cox, Plimmer and Rodgers2012) and Philosophical Transactions (Best, Reference Best2005) – two of the most reputable scientific journals – tend to use more graphs, tables, and non-graph illustrations.
Improving Scientific Communication Using Visual Inscriptions
Note that increasing the impact of individual articles or researchers cannot be achieved by simply increasing the volume of visual inscriptions within a journal (see Hegarty & Walton, Reference Hegarty and Walton2012). Some types of inscriptions are discipline-specific and are amenable only to specific types of data. Although it may be tempting for researchers to simply incorporate illustrations that work well in other disciplines, we would suggest that designing appropriate data presentation vehicles may be one step in the process of increased codification. Over time, visual inscriptions become part of the language of a discipline (Lenoir, Reference Lenoir1998), and their inclusion allows data to be displayed in ways that make overall patterns and trends more accessible (see Latour, Reference Latour, Lynch and Woolgar1990) to both expert and lay audiences. Although not all datasets are amenable to traditional graphical analysis, we would argue that the growing availability of diverse graphical formats provides researchers with improved opportunities to incorporate such display types in their analyses.
For over a decade, professional associations have begun to take a more didactic role in encouraging researchers to incorporate more useful, and arguably more informative, data summary techniques into their research presentations. Since 1999, the American Psychological Association (APA) has mandated the use of proportionally more non-inferential analysis strategies (i.e., confidence intervals, graphing, etc.) in its journal submissions (Wilkinson & the Task Force on Statistical Inference, 1999). More recently, the American Statistical Association (ASA) issued a statement regarding proper usage of p-values (Wasserstein & Lazar, Reference Wasserstein and Lazar2016), arguing that “a conclusion does not immediately become ‘true’ on one side of the divide and ‘false’ on the other” (p. 9). At the same time, other disciplines (e.g., medicine) have documented considerable difficulties in affecting changes in their data reporting strategies (Fidler, Thomason, Cumming, Finch, & Leeman, Reference Fidler, Thomason, Cumming, Finch and Leeman2004).
Notwithstanding discipline-specific practices, Wainer (Reference Wainer2013) offered several suggestions on the integration of graphical displays at different points in the research process. Graphs are multi-purpose and are used for exploration, calculation, communication, and decoration (Wainer, Reference Wainer2013, p. 29). We would argue that researchers in all areas of science could improve the quality of their data dissemination by focusing on each of these stages. When analysing newly collected data, researchers can use graphics for exploration. Graphs for exploration allow us to create multiple pictures of our data, and the end result is a display that can highlight unexpected findings (Tukey, Reference Tukey1990).
Graphs for calculation can be used to supplement (or replace) complex statistics. In the current study, researchers used graphs such as scatterplots, confidence intervals, and physiological recordings to illustrate complex statistics and obviate the need for statistical inference. Such practices are in keeping with the recommendations of professional associations (Wilkinson & the Task Force on Statistical Inference, 1999; Wasserstein & Lazar, Reference Wasserstein and Lazar2016). Graphs included in journal articles serve communicative purposes, highlighting points deemed important and providing summaries of large datasets. Finally, graphs for decoration are often used in oral and poster presentations and allow an audience to focus on the specific points highlighted on a graph. Graphs used for this purpose are varied and are often drawn to focus attention and aid in communication of complex findings. The issues surrounding the over-reliance on inferential statistics, coupled with the known benefits of visual displays, supports the inclusion of visual inscriptions to aid in analysis, interpretation, and communication of research findings. We feel that the combination of descriptive, inferential, and visual techniques provides a more complete understanding of empirical data, allowing researchers to more fully appreciate the phenomena under investigation.
Strengths and Limitations of the Current Study
The purpose of this study was to examine the extent to which gerontology researchers use inscriptions to present empirical data. The sample included 357 articles randomly selected from 24 selected gerontology journals over a 15-year period, enabling us to draw general conclusions about the use of inscriptions among gerontology researchers. The current study is the first to use the methods established by Cleveland (Reference Cleveland1984) in evaluating the use of inscriptions in gerontology. Our sampling strategy also allowed us to compare how inscriptions are used in gerontology, CCJ (Goggin & Best, Reference Goggin and Best2013), and psychology (Smith et al., Reference Smith, Best, Stubbs, Bastiani Archibald and Robertson-Nay2002) but did not allow us to critically examine changes within a single journal.
In a preliminary unpublished examination of graph use practices in gerontology, Yamashita et al. (Reference Yamashita, Bailer and Kunkel2012) reported that almost 40 per cent of 863 articles published in The Gerontologist between 2001 and 2010 included a visual inscription (graph and non-graph figures). In the current study, 40 per cent of articles sampled from that same journal, and 43.42 per cent of all articles, included at least one graph or non-graph figure. Thus, despite the fact that the current sample included a wide range of articles drawn from journals with varying publication policies, the percentage of articles that used visual inscriptions was similar to that reported within a single journal. Future researchers are encouraged to extend this research and focus on inscription trends within a single journal or subset of journals.
Although graphs are a useful data communication tool, their value depends largely on the quality of the inscriptions used. Attempts have been made to evaluate graph quality, but admittedly, its objective measurement is difficult. For example, the quality of an inscription often depends on characteristics that are specific to different sets of data, and thus, assessing quality in a survey study can be difficult. Further, our sample of journals was restricted in range such that it included only higher impact factor titles, which implies that the graphs published in those journals would also likely be of higher quality. At the same time, the imperative to adhere to existing graph quality standards remains with researchers. Guidelines regarding elements of graph quality are available (for example, Tufte, Reference Tufte2001; Tukey, Reference Tukey1990; Wainer, Reference Wainer2013), although that availability does not guarantee their adoption in practice. Regardless, we acknowledge that the examination of graph quality is lacking in the literature and our current research agenda aims to rectify this deficit.
General Conclusions
Knowledge cumulation and knowledge transfer must be appreciated as more than simply trendy catchphrases. They represent a much-needed shift in focus for researchers. The principal responsibility of all scientists, no less social scientists, must be to ensure the meaningful contribution of research results, as they relate to both basic and applied settings. We would argue that visual inscriptions enhance communication between primary researchers (Latour, Reference Latour, Lynch and Woolgar1990) and allow the transfer of results to applied settings (Ahmed & Boisvert, Reference Ahmed and Boisvert2003). For example, graphs and other visual aids can be used in clinical settings to aid communication, foster the evaluation of treatment responses, and illustrate the efficacy of various treatment protocols (Ahmed & Boisvert, Reference Ahmed and Boisvert2003). The incorporation of inscriptions into the process of knowledge transfer allows all stakeholders to fully appreciate the implications of specific research findings.
The empirical record is clear that the inclusion of visual inscriptions tends to enhance our ability to illustrate data patterns and that most social science researchers do incorporate such inscriptions, to a greater or lesser extent. The literature is also clear that journals which dedicate greater page space to visual inscriptions tend to be rated as higher in scientific impact. The fact that there are disciplinary differences in the use of visual inscriptions speaks to the question of why there is greater theory development and codification in the harder sciences (Smith, Best, Stubbs, et al., Reference Smith, Best, Cylke and Stubbs2000). As such, researchers in gerontology are encouraged to include a greater frequency and range of inscription types in their research summaries. Most immediately, such a change in practice would augment the persuasiveness of their findings and, over the long term, help to further the discipline’s codification. Through such efforts, the goals of knowledge cumulation and knowledge transfer will be met – translating empirical results into practical applications – yielding benefits for stakeholders in both applied and research contexts.