Implications
Genetic improvement in dual-purpose breeds needs to consider the genetic relationships between traits related to both milk and beef attitudes, and to account for functional traits important for animal well-being. This study aimed at estimating the genetic correlations between milk and beef traits already under selection in the native dual-purpose Rendena breed, and relationships with somatic cells. The antagonistic correlations found among milk and beef traits underlie the need of a proper economic weight to traits under selection, including functional traits, to maintain the distinctive dual-purpose characteristics in the breed and ensure animal well-being.
Introduction
Dual-purpose cattle breeds have been traditionally selected to improve milk and beef (i.e. meat) attitudes, with a greater emphasis to milk due to a greater economic value (Aass, Reference Aass1996). Compared with the more productive specialized dairy or beef cattle, dual-purpose breeds show valuable functional characteristics (health, fertility, longevity) that make it possible to rear them in harsh environments and marginal areas with low maintenance expenditures (Krupová et al., Reference Krupová, Krupa, Michaličková, Wolfová and Kasarda2016). However, few studies have been focused on the genetic relationships among traits involved in the dual-purpose attitude, maybe due to the greater economic importance of specialized breeds, but also to the local diffusion of dual-purpose cattle. However, local breeds have recently stimulated interest due to their close ties with landscape conservation, with manufacturing of typical products such as POD cheeses, and due to their indirect support to local economies (Gandini and Villa, Reference Gandini and Villa2003).
The few recent studies in dual-purpose breeds (Swiss and Italian Simmental: de Haas et al., Reference De Haas, Janss and Kadarmideen2007, Frigo et al., Reference Frigo, Samorè, Vicario, Bagnato and Pedron2013; Austrian Fleckvieh: Fuerst-Waltl et al., Reference Fuerst-Waltl, Fuerst, Obritzhauser and Egger-Danner2016; Aosta Red Pied cattle: Mazza et al., Reference Mazza, Guzzo, Sartori and Mantovani2016b) have found negative relationships between milk and beef traits. These studies were also the only ones considering in dual-purpose animals a joint evaluation of productive and functional traits, despite the importance of the latter ones for animal well-being. This issue was already highlighted at the beginning of 21st century (Sölkner et al., Reference Sölkner, Miesenberger, Willam, Fürst and Baumung2000), but some selection indices for dual-purpose cattle still include only productive traits (e.g. Slovak Pinzgau: Krupová et al., Reference Krupová, Krupa, Michaličková, Wolfová and Kasarda2016; Aosta Red Pied: Mazza et al., Reference Mazza, Guzzo, Sartori and Mantovani2016b).
Considering the Rendena breed as a case study, the present research aimed to investigate the genetic correlations among the productive traits involved in dual-purpose attitude: milk, fat and protein yield, factor scores for udder and muscularity obtained from linear type traits, and beef traits recorded on young bulls at performance test. Moreover, the study examined the genetic correlations between productive traits and a functional udder health trait, the somatic cells, as further possible selection goal intended to animal well-being. Finally, the genetic response to selection was quantified by using the selection index theory approach.
Material and methods
Subject of the study
Rendena is an Italian cattle widespread in North-east of Italy. The breed is appreciated for its adaptability to the harsh environments of Alpine pastures and for good fertility and longevity. Recent data from the national breeders organization (ANARE; www.anare.it) reported a population size of 3985 registered cows in 199 herds. The breed is ‘not-at-risk’ (FAO, 2017), and reared following a selection programme careful of limiting the inbreeding increase. Rendena is selected for milk and meat, with a particular emphasis on milk attitude. The current total selection index (TSI) assigns an economic weight (a) of 0.65 to protein and fat yields with an 3 : 1 economic importance to protein with respect to fat, an equivalent weight (0.10 each) to udder and muscularity factors derived from type traits, and the remaining weight (0.15) to beef traits on candidate young bulls (Mazza et al., Reference Mazza, Guzzo, Sartori and Mantovani2014).
Traits analysed and data structure
The study considered all the productive traits currently involved in the genetic improvement of Rendena breed and the somatic cells as suitable trait for being introduced in TSI as udder health indicator. Milk, fat and protein data (MY) consisted in all individual productions (kg/day) routinely collected from 1989 to 2014 according to the Italian official milk recording system. After editing (see Mazza et al., Reference Mazza, Guzzo, Sartori and Mantovani2016b), 281 497 records belonging to 16 974 cows up to the third lactation and referring to 22 542 animals in the pedigree were retained. Factorial traits for udder and muscularity were achieved from linear type evaluation of primiparous cows yearly performed by trained classifiers in years 1994 to 2014 and considering a one to five point scale with biological meaning (Mazza et al., Reference Mazza, Guzzo, Sartori and Mantovani2014). Among the 20 type traits routinely recorded, this study focused on 10 traits related to udder characteristics and muscularity (Table 1). Higher phenotypic scores are desirable for all traits with exception of teat length. After editing (see Mazza et al., Reference Mazza, Guzzo, Sartori and Mantovani2014), 11 992 records, one for cow, referring to 18 652 animals in pedigree were retained for analysis. On the phenotypic data of the 10 type traits a factor analysis (FACTOR Procedure; SAS Institute Inc., 2013) was performed, as in Mazza et al. (Reference Mazza, Guzzo, Sartori, Berry and Mantovani2016a). Beef traits (PT) included the average daily gain (ADG), and the visual appreciations of in vivo SEUROP fleshiness (FL) and dressing percentage (DP). About 60 male candidate calves are tested yearly from 1 to 11 months at the performance test station, grouped by birth month (Mantovani et al., Reference Mantovani, Gallo, Carnier, Cassandro and Bittante1997). The ADG (kg/day) was the linear regression of weight on age. At the end of the period three trained classifiers provided for FL and DP separate scoring then averaged within trait. The FL evaluation applies the same scores of SEUROP postmortem carcass appraisal established by the European Union Council. The middle class R was equal to 100 points and 10-points-variations were assigned to upper or lower classes. The study considered all the data recorded in years 1985 to 2014. A total of 1428 records, one for each young bull, referring to 4954 animals in pedigree, were retained for genetic analyses. The number of somatic cells/ml of milk routinely recorded under national functional controls was converted in the normally distributed somatic cells score (SCS; Ali and Shook, Reference Ali and Shook1978) expressed as SCS=3+(log2(n somatic cells/100×103)). Data without information on somatic cells or with negative values were discarded, and the same thresholds applied to MY data were applied, finally retaining 239 698 records of 14 586 cows and 20 592 animals in pedigree. Data sets and pedigree information were provided by ANARE.
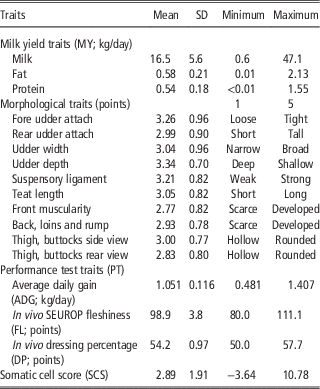
Descriptive statistics of the target phenotypic data in Rendena breed

Genetic parameters estimation
Variance components were estimated by applying the single-trait animal models routinely used in genetic evaluations, and (co)variance between each pair of target traits were obtained by running bi-trait analyses. The average-information restricted maximum likelihood (REML) algorithm was applied (AIREMLf90 software; Misztal, Reference Misztal2008) and preceded by 30 rounds of iterations under the expectation-maximization REML method to recruit initial variances within the parameter space. A repeatability test-day model was run to estimate the variance components for MY (kg). This model is preferred to a random regression model to avoid possible problems of poor evaluation at extremes, likely to be enhanced in a small population like Rendena, characterized by summer pasture (Swalve, Reference Swalve1995). The model in matrix notation may be written as:
 $${\bf y}\,{\equals}\,{\bf X}\,{\mib \bbeta } {\plus}{\bf Wp}{\plus}{\bf Zu}{\plus}{\bf e}$$
where y is the vector of records for milk, fat or protein (kg/day) of a given cow, and X, W and Z the incidence matrices of fixed effects, permanent environment and genetic effects, respectively. Vector β includes the fixed effects of herd-test-day within lactation number (LN), day of gestation’ classes, age at parity within LN (AP), month of parity (MP). Both AP and MP were fitted as covariates by using the 4th order Legendre polynomials. Vectors p, u, e represent the permanent environmental effect, the additive genetic component and the residual. The factor scores obtained for muscularity and udder were analysed through the following animal model:
 $${\bf y}\,{\equals}\,{\bf X\,\bbeta }{\plus}{\bf Zu}{\plus}{\bf e}$$
where y is the vector of the type factor scores for each cow, and the vector β includes the fixed effects of herd-year-classifier evaluation, age at first calving, and days in milk. Vector u and e and incidence matrices X and Z have the same meaning as previously. The single-trait animal model applied to PT has the same matrix notation of the model including factor scores, but vector y includes the young bulls’ phenotypes for ADG, FL or DP, and vector β the fixed effect of contemporary group, the parity order of the mother, and the individual age at the end of the test as covariate (not used for ADG). The SCS data set was analysed with the same model as for MY.
Bi-trait animal model analyses were run for each trait pair (45 analyses). Bivariate data sets were built by joining the single-trait data sets. The (co)variance matrices for bi-trait analyses were:
 $$\eqalignno{ &{\bf{G}} {\equals}\left| {\matrix{ {\sigma _{{{\rm a}1}}^{2} } & {\sigma _{{{\rm a}1{\rm a}2}} } \cr {\sigma _{{{\rm a}1{\rm a}2}} } & {\sigma _{{{\rm a}1}}^{2} } \cr } } \right|;\,\,{\bf{Pe}} {\equals}\left| {\matrix{ {\sigma _{{{\rm Pe}1}}^{2} } & {\sigma _{{{\rm Pe}1{\rm Pe}2}} } \cr {\sigma _{{{\rm Pe}1{\rm Pe}2}} } & {\sigma _{{{\rm Pe}1}}^{2} } \cr } } \right|;\,\cr& {\bf{R}} {\equals}\left| {\matrix{ \hskip-18pt{\sigma _{{{\rm e}1}}^{2} } &{0\left[ {\sigma _{{{\rm e}1{\rm e}2}} } \right]} \cr {0\left[ {\sigma _{{{\rm e}1{\rm e}2}} } \right]} & {\sigma _{{{\rm e}2}}^{2} } } } \right|$$
where G is the matrix of additive genetic (co)variances σ 2 a1, σ 2 a2 , σ a1a2 of traits 1 and 2, Pe is the matrix of permanent environmental (co)variances σ 2 pe1, σ pe1pe2, σ 2 pe2, and R the matrix of residual (co)variances σ 2 e1, σ 2 e2 and σ e1e2. The residual (co)variance σ e1e2 was set to 0 in bivariate analyses of traits from different data sets because traits were measured at different moments. A permanent environmental (co)variance was assumed in bivariate analyses of MY and SCS v. factor type traits and PT, although the latter two were measured only once, to detect any biologically relevant relationship between traits due to the common environment represented by the individual (Careau et al. Reference Careau, Wolak, Carter and Garland2013). The σ 2 pe2 component for factorial traits and PT is part of the residual variance, and has to be summed to σ 2 e2 (Hanford et al. Reference Hanford, Van Vleck and Snowder2002).
Heritability values were obtained from single-trait analyses as h 2=σ 2 a/σ 2 P, with σ 2 P summing all the other variances. Genetic and phenotypic correlations were r a =σ a1a2/(σ a1·σ a2) and r P =σ P1P2/(σ P1·σ P2), with σ P1P2 summing all (co)variances. Standard errors were computed using the delta method based on variance components’ SE (Lynch and Walsh Reference Lynch and Walsh1998). Heritabilities and correlations were tested against zero (Rønning et al., Reference Rønning, Jensen, Moe and Bech2007) by calculating a z-score as ratios between the estimated parameters and their SE. A two-tailed significance for z-scores was assumed from a standardized normal distribution.
Genetic trends and response to selection
Individual estimated breeding values (EBV) were obtained as solutions of the additive genetic effect in single-trait analyses (Misztal Reference Misztal2008) and then standardized using mean and SD of new-borns for year 2001 (EBV std). The EBVs were plotted in a graph to trace the annual genetic variations for traits in birth years 2000 to 2010. The genetic response to selection (R) in the target traits, that is the predicted change in trait mean after a generation, was calculated by applying the ‘Multivariate Breeder’s Equation’ in the form proposed by Kause et al. (Reference Kause, Mikkola, Strandén and Sirkko2015), R=(i/σ i)·b’·P -1 , where i is the selection intensity (set to 1.755), σ i is the SD of the selection index, σ i=(b’Pb)1/2, b is the vector of the weights for selection index and b’ its transpose, with b=P -1 Ga, where P and G are the phenotypic and genetic (co)variance matrices, respectively, and a is the vector including the economic weights of traits, that are the ones currently used in the genetic improvement of Rendena breed and detailed in Materials and Methods. Following Kause et al. (Reference Kause, Mikkola, Strandén and Sirkko2015), the relative emphasis of the traits in selection index was intended as a proportion of the standardized economic value of the trait (a s=a×σ a) compared with the sum of all standardized values of the traits accounted in the index. Moving from the current economic weights of traits, a relative emphasis from 0 to 1 with intermediate values was alternatively attributed to milk and beef traits. Milk, fat, protein and the two factor scores referring to the udder were considered as milk traits, whereas the factor score for muscularity, ADG, FL and DP as beef traits. Somatic cell score was included in the selection index by restricting to zero its genetic gain, as proposed by Kempthorne and Nordskog (Reference Kempthorne and Nordskog1959). A standardized response to selection (R dsi ) was calculated as R dsi =R/σ Pi , and an annual selection rate (R dsi /t i ) was found by dividing R dsi for the population generation length t=4.48 previously quantified from pedigree.
Results
Descriptive statistics
Descriptive statistics of traits are reported in Table 1. Rendena cows produced a mean of 16.5 kg/day of milk, containing an average of 3.5% and 3.3% of fat and protein, respectively. Many type traits showed a mean value around 3, the most desirable value for teat length, whereas high values are preferred for the other traits. Muscularity traits, excluding thigh and buttocks, side view, were below the mean (about 2.8 points). An ADG of 1.051 kg/day was observed in young bulls and a SCS of 2.89 in cows, roughly corresponding to 93 000 somatic cells/ml of milk.
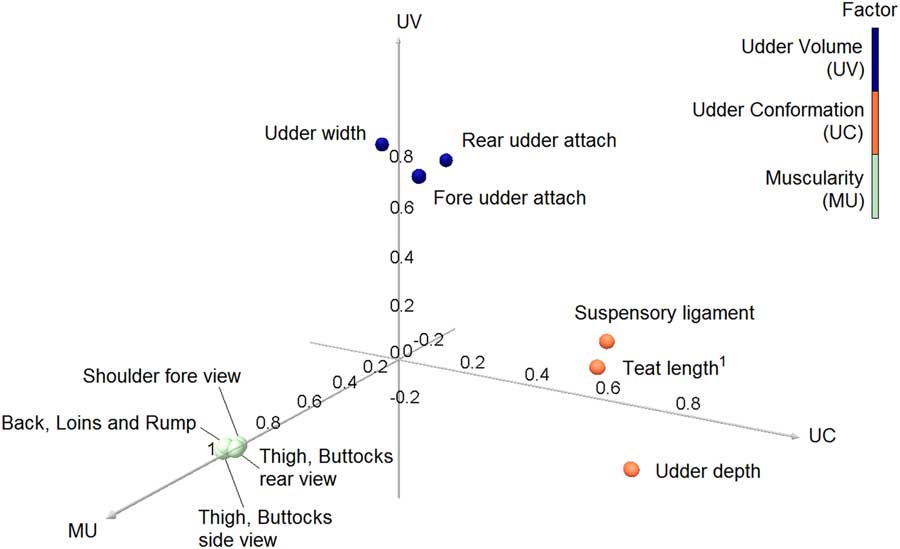
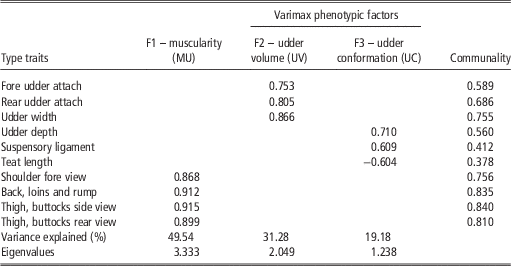
Factor analysis allowed the identification of three factor scores with eigenvalue ⩾1 and a specific biological meaning (Table 2 and Figure 1): muscularity (F1, MU), udder volume (F2, UV), udder conformation (F3, UC). All traits included in a single factor had a loading coefficient greater than 0.25. Teat length entered the UC factor with a sign opposite to its phenotypic variation. Therefore, a high value of UV is appropriate for a cow with a broad udder, a tight fore attach and a tall rear attach. On the other hand, high values for UC indicate a cow with a shallow udder, a strong suspensory ligament and short teats, that is more adapted to the milking machinery. Finally, developed front muscularity, back, loins and rump, and rounded thigh and buttocks are appropriate for a cow with a great MU. Muscularity explained 49.54% of the whole phenotypic variation, UV 31.28% and UC 19.18%. Communality, the proportion of traits variation explained by factors, was ⩾0.75 for muscularity traits and udder width, and <0.50 only for suspensory ligament and teat length.
Cartesian representation of factor scores for muscularity (MU), udder volume (UV) and udder conformation (UC) extracted after Varimax rotation from 10 type traits. Dots of the same colours indicate traits with a loading coefficient ⩾|0.25| in the same factor.

Phenotypic factors, loading of individual type traits for coefficients ⩾|0.25|, communality and eigenvalues obtained after Varimax rotation of linear type traits.

Genetic parameters
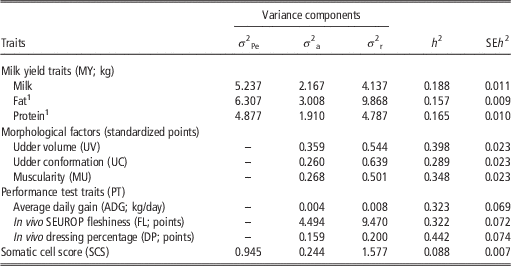
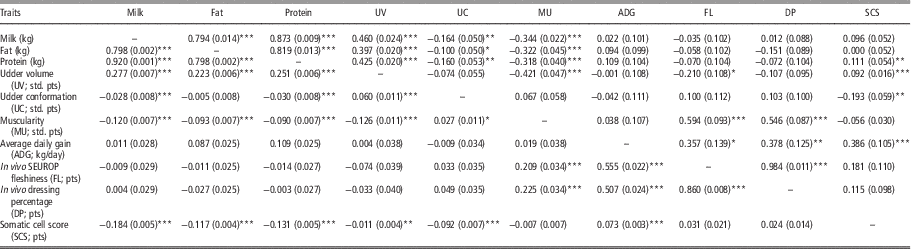
Heritabilities (Table 3) were moderate for all traits excluding SCS (0.088). Milk yield traits showed similar heritability (from 0.157 to 0.188), whereas UV had greater values (0.398) than MU (0.348) and UC (0.289). Heritability for ADG and FL were intermediate between MU and UC, whereas DP showed the greatest value (0.442). All heritabilities were significantly different from zero (Table 3). High genetic correlations (r a >0.79) were found among MY traits (Table 4), and between FL and DP. Close values were also found for the corresponding phenotypic correlations (r p ). High r a were achieved between MU and both FL (0.594) and DP (0.546), and the r p were slightly greater than 0.20. The UV showed r a with MY between 0.397 and 0.460 and r p between 0.223 and 0.277. Moderate r a (around 0.36), were found for ADG with FL and DP, whereas the r p were rather higher (>0.50). Negative r a were obtained between MU and both MY (about −0.33) and UV (0.421), and the related r p were low but also negative (about −0.10). Udder volume showed a moderate negative r a (−0.218) also with FL. Low but negative relationships were found between MY and UC (r a from −0.164 to −0.100; r p close to zero). Somatic cell score showed a moderate genetic correlation only with ADG (0.386), and low but positive r a (around 0.10) with UV, protein and milk, even if in this latter case r a was not significantly different form zero. The r p between SCS and MY were negative (−0.14 on average). Somatic cell score showed a negative significant r a (−0.193) only with UC, suggesting that a well conformed but not necessarily big udder is genetically linked to a lower production of somatic cells. The correspondent r p was also negative (−0.070). None of the other correlations differed from 0 (Table 4).
Variance components, heritability (h 2) with relative SE (SEh 2) and coefficients of additive genetic variation estimated via single-trait analyses for target traits in the Rendena breed

σ 2 Pe=phenotypic variance; σ 2 a=additive genetic variance; σ 2 r=residual variance.
All h 2 were significant with P<0.001.
1 Variances multiplied by 103.
Genetic (above the diagonal), and phenotypic (below the diagonal) correlations between 10 target traits in Rendena

std.=standardized; pts=points.
Standard errors of estimates are in brackets. Correlations significantly different from zero are indicated.
*P<0.05, **P<0.01, ***P<0.001.
Genetic trends and response to different selection scenarios
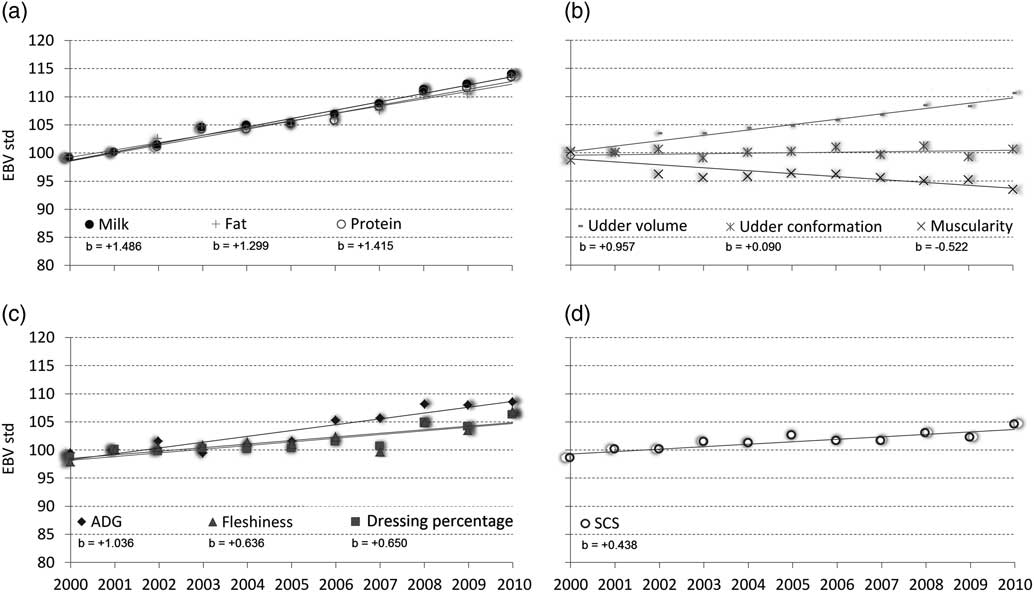
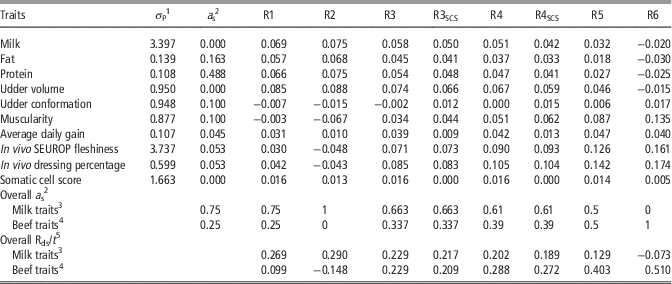
A positive genetic variation in years 2000 to 2010 was observed for most of traits (Figure 2), with greater variations for MY (average linear regression coefficient b of 1.4 standardized points per year), followed by ADG (b=1.036), UV (b=0.957), FL and DP (average b=0.643). A trend close to 0 was observed for UC (b=0.090), and a negative variation was found for MU (b=−0.522). Moving from a selection for the only milk attitude (standardized economic weight for milk traits, a smilk=1; a s for beef traits, a sbeef=0; selection index R2, Table 5) to one for the only meat (a smilk=0; a sbeef=1; selection index R6), the multi-trait response, expressed as annual standardized selection rate of traits (R ds /t), moved from positive values for milk traits and negative for meat, to slightly negative values for milk and strongly positive for beef traits (Table 5). Milk and beef traits respectively assumed an overall Rds/t of 0.290 and −0.148 in R2, and of −0.073 and 0.510 in R6. In R1, the current selection index, the ratio a smilk:a sbeef is 0.75 : 0.25, the overall response for milk (Rds/t=0.269) is threefold the response for beef (Rds/t=0.099), and a positive selection rate is expected for all traits excluding UC and MU. The same selection rate for milk and beef attitudes (Rds/t=0.229) is realized when a smilk:a sbeef is 0.66 : 0.34 (R3). All the traits apart from UC had a positive response under R3. The a s ratio of 0.61 : 0.39 (R4) avoided the negative response for UC. A greater selection response for beef than for milk traits was also observed under R4, and it increased when the same standardized economic weight was assigned to milk and beef traits (R5). The ADG was the only productive trait assuming positive Rds/t for the whole range of a s combinations. The indirect selection for SCS produced a slightly positive variation of the trait under all combinations of the global selection index, meaning an increase in somatic cells and a detriment in udder health. A restriction for the genetic gain of SCS was applied to R3 and R4, and this solution produced a slight reduction of the overall Rds/t for both milk and beef attitudes in both global indexes (R3SCS and R4SCS). All the traits considered had a trivial reduction of their Rds/t as well, excluding UC (positive under both R3SCS and R4SCS) and FL.
Current genetic variation of traits along an 11-years temporal window: (a) milk yield traits (milk, fat and protein); (b) factors (muscularity, udder conformation, udder volume); (c) performance test traits (average daily gain (ADG), in vivo SEUROP fleshiness and in vivo dressing percentage); (d) somatic cells score (SCS). EBV std=standardized estimated breeding values.
Genetic gain in 10 traits in response to selection for alternative global indexes in Rendena, including the current selection index (R1) and five alternatives (R2 to R6)

Two alternatives, respectively allowing the same genetic gain for milk and beef traits (R3), and a balanced genetic gain without a negative response for any traits (R4), have been restricted to a null genetic gain for somatic cell score (SCS) (R3SCS and R4SCS).
1 Phenotypic standard deviation.
2 Standardized economic weight of traits.
3 Milk; fat; protein; udder volume; udder conformation.
4 Muscularity; average daily gain; fleshiness; dressing percentage.
5 Standardized selection rate, with Rds=standardized selection response (R/σ P , with R=selection response) and t=generation interval (4.48 years).
Discussion
This study offers an overview of the composite genetic relationships among traits belonging to the dual-purpose attitude of milk and meat in cattle. A multivariate approach is necessary to investigate these traits, because genetic improvement may be enhanced by the positive genetic relationships among some trait pairs, or counteracted by the antagonistic genetic correlations in some others. These negative relationships may be due to an antagonistic pleiotropy of genes underlying traits, or to linkage. The dual-purpose Rendena breed offers an excellent case study because many traits are involved in genetic improvement, and the different heritabilities and genetic relationships affect the response to selection. Milk yield traits have resulted in heritabilities lower than in morphological factor scores and performance test traits, with a consequent lower response to selection. Simulation analyses of genetic gain under different traits’ combinations suggest that when only one attitude is positively selected, the response is greater for beef attitude. Extensive literature exists on milk traits genetic parameters. About dual-purpose cattle, close heritabilities to the present were reported in Austrian Fleckvieh (0.190 for milk; Koeck et al., Reference Koeck, Egger-Danner, Fuerst, Obritzhauser and Fuerst-Waltl2010), Italian Simmental (0.18; 0.13; 0.17 for milk, fat and protein; Frigo et al., Reference Frigo, Samorè, Vicario, Bagnato and Pedron2013) and Finnish Ayrshire (0.189 average for milk; Negussie et al., Reference Negussie, Strandén and Mäntysaari2008). Milk yield in Rendena has an overtime positive genetic gain because of the positive selection for fat and protein.
Factor analysis allowed the combination of traits in three factor scores with clear biological meaning (udder volume, udder conformation and muscularity) able to summarize the information of the single type traits included, and therefore suitable for breeding purposes (Russell, Reference Russell2002). Factor scores (Table 2 and Figure 1) were the same obtained in a previous factor analysis considering all type traits in Rendena (Mazza et al., Reference Mazza, Guzzo, Sartori, Berry and Mantovani2016a), and the correlations found reflected the ones between the individual type traits included in each factor (Mazza et al., Reference Mazza, Guzzo, Sartori and Mantovani2014). The positive selection for MY traits allows an indirect favourable improvement in udder volume (average r a=0.427 with MY). Positive genetic relationships for traits related to udder volume and lifetime milk yield is well-known from dairy cattle literature (e.g. Short and Lawlor, Reference Short and Lawlor1992), and it has been reported also in the dual-purpose Aosta Chestnut (Sartori et al., Reference Sartori, Mazza, Guzzo and Mantovani2015). Udder conformation score showed an r a not different from zero with UV and MU, but reported negative r a estimates with MY, meaning that an improvement in milk production may lead to a detriment in udder conformation, as suggested by the close to zero genetic trend (Figure 2), and by the slightly negative response to selection when a standardized economic value (a s) close to 1 is provided to milk attitude (Table 5). A negative r a among udder width, included in UC, and MY was also found in Italian Brown Swiss (−0.313 on average; Samoré et al., Reference Samoré, Rizzi, Rossoni and Bagnato2010). The negative correlation between MY and UC may be explained by considering that a greater milk production may be hosted in a wider, but not well shaped udder. Udder conformation traits are included in various selection indexes of dual-purpose or dairy breeds as functional traits.
The muscularity factor has a negative genetic correlation with MY (Table 4), and the current selection index (R1, Table 5), assigning to milk a three-times greater a s than to beef attitude, causes a negative selection response to muscularity, as seen in the genetic trend (Figure 2). The antagonism between milk yield traits and muscularity has been observed, reporting moderate-high negative r a (e.g. in Brown Swiss and in Swiss Simmental cattle; de Haas et al., Reference De Haas, Janss and Kadarmideen2007; in Italian Simmental; Frigo et al., Reference Frigo, Samorè, Vicario, Bagnato and Pedron2013). This may be due to a different allocation of available metabolic energy in cow, either directed to an increased milk production or to muscle mass growth. However, no studies have focused this issue yet. However, lower genetic correlations have been recently highlighted by Croué et al. (Reference Croué, Fouilloux, Saintilan and Ducrocq2017) in French dual-purpose Montbeliarde, Normande and Simmental, where a postmortem SEUROP conformation score resulted in null to slightly negative genetic correlation with milk, fat and protein.
Traits recorded at performance test stations have on average medium to high heritability, as in this study (e.g. Jensen et al., Reference Jensen, Mao, Andersen and Madsen1991; Aass, Reference Aass1996; Bonfatti et al., Reference Bonfatti, Albera and Carnier2013). A wide range of estimates was found for in vivo fleshiness (between 0.19 for Romagnola and 0.55 for Chianina; Sbarra et al., Reference Sbarra, Mantovani and Bittante2010). From zero to negative genetic relationships have been reported between ADG and milk traits (reviewed in Pirchner, Reference Pirchner1986), as well as between the net daily gain and fat and protein yield (Fuerst-Waltl et al., Reference Fuerst-Waltl, Fuerst, Obritzhauser and Egger-Danner2016). Correlation estimates for in vivo carcass traits v. cows morphology are lacking, whereas moderately low-negative genetic relationships (0.15 to 0.20) with milk and protein yield were found for in vivo EUROP scoring and DP in Austrian Fleckvieh and Brown Swiss (Fuerst-Waltl et al., Reference Fuerst-Waltl, Fuerst, Obritzhauser and Egger-Danner2016). The r a between PT and MY estimated in the present study, almost no different from zero (Table 4), showed that it is feasible to improve both the milk production of cows and the beef traits in young bulls, as suggested by R1. An enhanced selection for only one attitude may cause a detriment in the other due to the whole framework of genetic relationships among productive traits. Simulations suggest (Table 5) that when a s of 0.61 to milk traits and 0.39 to beef traits are assigned (R4), both attitudes improve without detriments.
A slight but positive selection response is expected for SCS under all combinations of economic weights, due to the positive r a with ADG and MY (Table 4). This is undesirable, as it corresponds to an increase in milk somatic cells. A low SCS heritability, close to the estimate of present study, was found for Finnish Ayshire (from 0.07 to 0.12; Negussie et al., Reference Negussie, Strandén and Mäntysaari2008), Italian Brown Swiss (0.14; Samoré et al., Reference Samoré, Rizzi, Rossoni and Bagnato2010), and Canadian Holstein (0.17; Jamrozik and Schaeffer, Reference Jamrozik and Schaeffer2012). Low but positive genetic correlations between SCS and milk have been reported in literature, for example in Canadian Holstein (0.14; Jamrozik and Schaeffer, Reference Jamrozik and Schaeffer2012), and Italian Brown Swiss (0.18; Samoré et al., Reference Samoré, Rizzi, Rossoni and Bagnato2010). In the latter study, SCS showed no different from zero r a with protein and fat yield, similarly to this study. These findings may shed light on the usefulness of introducing somatic cells within the breeding goals in dairy and dual-purpose breeds, as already done in some selection indexes, for example in Total Merit Indexes approved in 2016 for Austrian Fleckvieh and Brown Swiss, where udder health had an economical value of 0.10, 70% of which assigned to somatic cells (Fuerst-Waltl et al., Reference Fuerst-Waltl, Fuerst, Obritzhauser and Egger-Danner2016). The solution of restricting to zero the genetic gain for SCS to counteract its increase was previously adopted by Kause et al. (Reference Kause, Mikkola, Strandén and Sirkko2015) to fix the genetic value of carcass fat in beef breeds. The restriction of a trait in a global index implies a recalibration of standardized economic weights of all traits included. When the genetic value of SCS is kept constant via restriction (R3SCS, Table 5), a positive selection response is expected for all traits. Moreover, R3SCS allows similar responses for both aptitudes (standardized selection rates of 0.217 and 0.209 for milk and beef traits; Table 4). Also R4SCS consents a positive response with null genetic gain for SCS, but since this index has a greater standardized selection rate for beef, R3SCS should be preferred. This latter is likely to be the best selection index proposed, and could be considered for genetic improvement.
The choice of a proper selection index is important in cattle breeding, and depends on the genetic SD of traits, the economic weights assigned, and the complex framework of genetic correlations. The inclusion of functional traits in a selection index is effective for a responsible, forward-oriented and socially accepted genetic improvement plan (Fuerst-Waltl et al., Reference Fuerst-Waltl, Fuerst, Obritzhauser and Egger-Danner2016). Current genetic trends suggest a slight but progressive change towards a milk conformation. Therefore, a long-term maintenance of the dual-purpose attitude, including a control of somatic cells, could be attained using proper economic weights for selected traits, as in the R3SCS index. This study has not considered other functional traits such as mothering ability or productive life as Rendena is a rustic breed with good levels of longevity, fertility and calving ease, but in some selection indexes (e.g. Fuerst-Waltl et al., Reference Fuerst-Waltl, Fuerst, Obritzhauser and Egger-Danner2016) they have been included due to their importance for dual-purpose breeds.
To summarize, this study has considered Rendena as example of local cattle bred dual-purpose attitude. The antagonism between milk and beef attitudes has been highlighted by the negative genetic correlations of milk, fat, protein and udder volume with muscularity. The beef traits recorded at the performance test stations have mostly shown genetic correlations not different from zero with milk traits, but also high-positive genetic correlations with muscularity. The composite framework of genetic relationships among traits leads to assign proper economic weights to traits, to avoid detrimental effects to one attitude due to the improvement of the other. Moreover, somatic cells may undesirably increase via indirect selection, reducing animal well-being. A good knowledge of traits’ genetic correlations, and of the proper weights to be included in a global index for dual-purpose attitude, may be effective for genetic improvement in Rendena and other dual-purpose breeds.
Acknowledgements
The Authors would like to thank the National Breeders Association of Rendena breed (ANARE) for funding the research, and Professor Marina Canapero, University of Padua, for her kind careful linguistic revision.