


Background
More than 60 Clinical and Translational Science Awards (CTSAs; programs funded by the National Center for Advancing Translational Sciences [NCATS][1]) hubs nationally produce an array of educational content to train specific segments of the clinical and translational science workforce[2], including high school students, undergraduates, graduate students, medical students, postdoctoral scholars, early career scientists, and senior investigators. In the newest iteration of the CTSA program Request for Applications, online education will become even more important, as CTSA hubs have been charged with creating more educational and training content to meet the needs of large swaths of clinical and translational research (CTR) professionals[3].
Our internal review shows that not all CTSAs post their educational offerings on their public-facing websites, but doing so could democratize access to relevant training for a variety of research-related roles[Reference Trend4]. Our Online Educational Library (OEL) was created in 2010, shortly after our hub first received funding from NCATS. At that time, hubs that consistently recorded and posted curated educational content on their publicly facing website were considered “early adopters” of online learning[Reference Rogers5]. With much more education being made available online, there is a need to better organize these offerings. This manuscript showcases our framework for categorizing educational content, reports an analysis of the effectiveness of this framework, and offers guidance for planning future content.
Methods
Composition of our Online Educational Library
The OEL contains 263 entries going back to September 2014. Due to the varying needs of our learners and the nature of how the content was originally captured, we have trainings across three video-management platforms: YouTube, Vimeo, and Panopto. The Southern California Clinical and Translational Science Institute (SC CTSI) YouTube account was created in December 2012, the Vimeo account was created in 2013, and Panopto in 2018.
The content within the OEL follows a standard format – each individual training receives its own entry within the overall OEL, which is comprised of recorded seminars, panels, and presentations that have taken place in-person or exclusively online. Each entry includes information such as the title of the presentation, speaker(s) as well as their titles and affiliations, a one-paragraph overview of the session, specific learning objectives, a promotional flyer advertising the session, a video recording and slides if available. The speaker(s) provide their own learning objectives, which we require follow pedagogical best practices such as the SMART Criteria, Bloom’s Taxonomy, or other vetted and accepted frameworks[Reference Chaterjee and Corral6,7].
Identifying a Categorization Schema
We began by seeking a theoretical or practical framework that would be suitable for re-categorizing the educational content featured in the OEL and identified the framework from the Joint Taskforce for Clinical Trial Competency (JTF)[8,9]. JTF is composed of an international group of investigators, educators, and clinical research professionals who developed the framework and outlined the “knowledge, skills and attitudes necessary for conducting safe, ethical, and high-quality clinical trials.”[8] Their current framework contains eight competency domains: 1) Scientific Concepts and Research Design; 2) Ethical and Participant Safety Considerations; 3) Investigational Products Development and Regulation; 4) Clinical Study Operations (Good Clinical Practice); 5) Study and Site Management; 6) Data Management and Informatics; 7) Leadership and Professionalism; 8) Communications and Teamwork[8].
Qualitative Coding Process
The coding group tasked with re-categorizing the content was comprised of professionals with various education levels and professional backgrounds working at SC CTSI. Each person reviewed the JTF framework and associated competencies to ensure they understood the codes and definitions before we began the coding process. Next, we generated a thematic codebook that included the JTF codes, their definitions, and guidance for how to categorize the videos, and began training the group in the methodology. Simultaneously, one of the authors catalogued our existing educational content (n = 173 videos) into a spreadsheet, excluding 90 videos that were shorter than five minutes or whose content did not align with current NIH priorities. The spreadsheet included fields for the title of the video, date of presentation, competencies, URL, and any notes from the team. After selecting the JTF framework, the coding group met via Zoom to test the applicability and suitability of JTF’s codes for categorizing the educational content. Since the codes were already developed by the JTF and we were applying them to our content, we used deductive coding[Reference Bingham10]. After coding 25 videos, the group reflected and discussed the appropriateness and alignment of the codes, then agreed to modify some of the extant codes to better fit our content[Reference Saldaña11]. We also added an “Other” category to capture content that was unrelated to existing codes or appeared too infrequently to necessitate the creation of another code. The group would iteratively re-examine the videos coded under Other as they came up to ensure they were not missing a possible new code emerging[Reference Saldaña11].
We adapted the JTF framework into the following educational competency domains: 1) Communication, Dissemination, and Teamwork; 2) Data Management and Informatics; 3) Leadership and Professionalism; 4) Regulatory and Quality Sciences; 5) Research and Study Design; 6) Study and Site Management; 7) Ethics and Participant Safety; 8) Research and Study Conduct; 9) Other; 10) Multiple Categories. See Supplementary Material 1 for further detail on each competency.
Quantitative Analyses
Data on each video from March 2022 to February 2025 for each platform included (Panopto; Vimeo; YouTube; Other), view count, video age (in years), run time (in hours : minutes : seconds), and educational competency domain. Video run time was divided into quartiles. Educational competencies became viewable to users in March 2024, so view data was split into three, annual periods: March 2022-February 2023 (competencies unavailable), March 2023-February 2024 (competencies unavailable), and March 2024-February 2025 (competencies available). This data was summarized descriptively using means and standard deviations or by counts and percentages, as appropriate.
The relationships between video view counts and video characteristics were modeled with annual panel data for view counts using a multivariable, ordinary least squares linear regression. An interaction effect for educational competencies by year (as a proxy for competency availability) was included in this model. Robust standard errors were used in our model. Significance was determined using a two-tailed α of 0.05. All analyses were performed using Stata (StataCorp; College Station, TX; Version 19.5).
Results
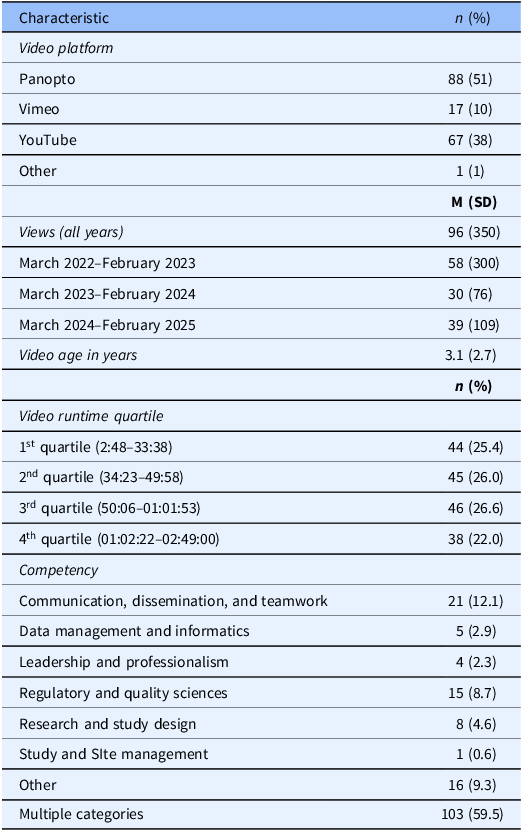
Our sample contained 173 educational videos (Table 1). The top five most accessed trainings across three video-management platforms included a virtual REDCap workshop (5784 views); recruiting participants using MTurk (4825); using the Covidence platform for systematic reviews (3996); using the PROSPERO protocol registration system for systematic reviews (2642); and participant recruitment strategies (2300).
Video characteristics (n = 173)

Table 1. Long description
Table provides descriptive statistics of videos, including counts or means and standard deviations of videos per platform, views, age, runtime, and educational competency domain.
M = mean; SD = standard deviation.
Most videos were hosted on Panopto (51%), followed by YouTube (38%), Vimeo (10%), and another platform (1%). The average number of views was 96 across all platforms, and the average video was about 3 years old. Views were highest from March 2022-February 2023 with an average of 58 views per video, and lower from March 2023-February 2025 with an averages of 30–39 views per video. Video length varied by quartile: between 2 and 33 minutes (1st quartile), between 34 and 49 minutes (2nd quartile), between 50 minutes and 1 hour and 1 minutes (3rd quartile), and between 1 hour and 2 minutes and 2 hours and 49 minutes (4th quartile). Most videos were coded as having multiple educational competency domains (59%), followed by videos focusing on Communication, Dissemination, and Teamwork (12.1%), Regulatory and Quality Sciences (8.7%), and other topics (9.3%). Other domains were less common.
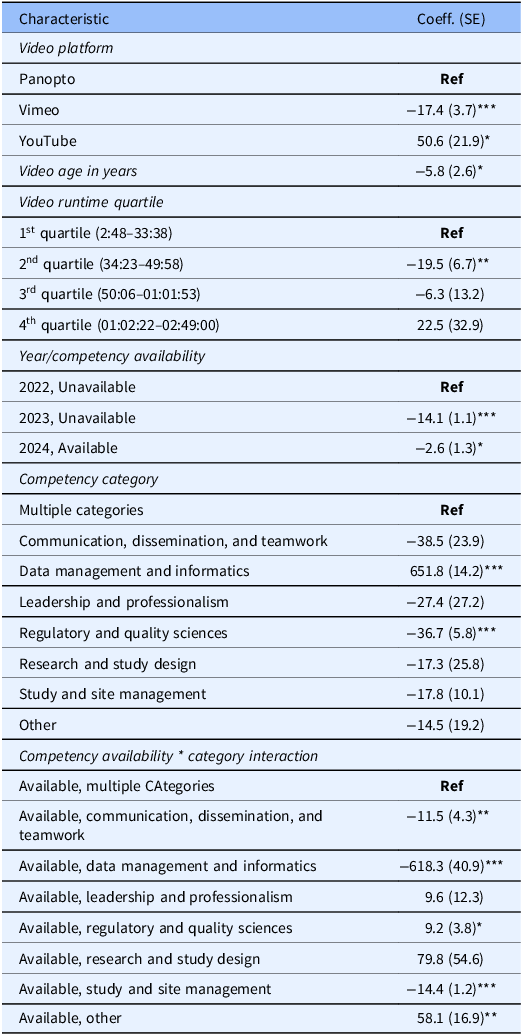
In our multivariable modeling, videos on Vimeo had 17 fewer (standard error [SE] 3.7) views and videos on YouTube had 50.6 additional (SE 21.9) views, on average (Table 2). Videos in the second quartile of length (34:23–49:58) had an average of 19.5 (6.7) fewer views than the shortest videos. Compared to 2022, videos watched in 2023 had 14.1 (1.1) fewer views, and videos watched in 2024 had an average of 2.6 (1.3) fewer views, even though educational competencies were only viewable to users starting in 2024. Videos solely categorized as “Data Management and Informatics” had an average of 651.8 (14.2) more views overall, when compared to videos with multiple categories. Videos with only the “Regulatory and Quality Sciences” category had an average of 36.7 (5.8) fewer views. When educational competency categories were available to users in 2024, users watched videos categorized solely as “Communication, Dissemination, and Teamwork,” “Data Management and Informatics,” and Study and Site Management videos significantly less than videos with multiple categories. However, users watched videos with only the “Other” designation significantly more. No other covariates were significantly related to differences in viewership.
Video views by video characteristics

Table 2. Long description
Table provides output of multivariable, ordinary least squares linear regression of video panel data, including coefficients and standard errors for video platform, age, runtime, year, competency domain, and a year times competency interaction term.
*p < 0.05; **p < 0.01: ***p < 0.001.
Note: Runtime is abbreviated as hours : minutes : seconds. The “Other” category for video platform was omitted from this model due to small cell size.
Discussion/significance
CTSAs have extensive educational content, some of which is publicly posted. Whether the content is meant for the public or only to be accessed internally, hubs can benefit from a cohesive, standardized categorization schema. This research is the first of its kind in which skills-based codes have been applied to educational content and trainings produced by a CTSA. Detailing our methodology can help other CTSAs better categorize their educational offerings to move toward a more unified approach for CTSAs to organize trainings and education in the CTR space.
Several factors were associated with video viewership. First, viewership declined with video age, indicating that users are watching newer videos. Second, videos coded in multiple categories are viewed more than videos coded in a single category, which corroborates the interdisciplinary nature of CTR. Third, implementing categories did not significantly improve viewership, which suggests that another organizational schema should be prioritized and ideally co-created by multiple hubs to ensure it meets our needs. Another possibility is that viewers are searching directly for the educational content they seek, such as typing in “REDCap” or “recruitment” into the website search bar. Thus, CTSA educational repositories should have robust searchability to meet these needs. Fourth, video platform is related to viewership – videos on YouTube were more likely to have higher views. As YouTube is such a widely used platform, many of these users may have found the content through YouTube search or recommendations rather than through visiting CTSA websites. Making relevant educational content publicly available through YouTube may be a practical way to engage members of the public. Understanding the factors that relate to CTSA content viewership can help CTSA hubs better categorize and promote content to achieve more widespread impact.
Future research should focus on applying these JTF codes (or another organizational mechanism) to the educational content produced by other CTSA hubs to follow a unifying categorization schema to observe trends, identify which hubs have educational content geared toward specific topics/expertise, and create opportunities to refine or overhaul the schema to better fit the type of educational content CTSAs produce. Additionally, it would be beneficial for hubs to come together in a CCOS Working Group format and collaborate by generating new codes (e.g. so that videos appearing in Multiple categories would be reduced) and refining existing codes. This group could also help to elucidate the “Other” code and perhaps create more codes to better organize relevant trainings on topics such as how to obtain funding, how to use specific research software/tools, using social media for recruitment, and how wearables and other emergent technologies can be used in research. Other research could focus on building a specific set of codes that align more fully with the ongoing needs of CTSA-affiliated learners, and that can capture the evolving goals of CTR education.
Through this work, we have also uncovered the need for strategic planning when it comes to educational content. As the educational and CTSA grant-based landscape changes, it’s necessary to evaluate the categories to see if they still meet the needs of our multifaceted audiences, or if further refinement is necessary. We have begun to explore the process of potentially applying and/or overlaying the NCATS Translational Science principles as a categorization framework to further refine the organizational schema[12]. Online educational content continues to be essential to clinical research, and CTSA hubs can help extend its reach through better classification and promotion.
Supplementary material
The supplementary material for this article can be found at https://doi.org/10.1017/cts.2026.10808.
Author contributions
Nicki K. Apaydin: Conceptualization, Data curation, Formal analysis, Investigation, Methodology, Project administration, Resources, Supervision, Visualization, Writing – original draft, Writing – review & editing; Ivy Hoang: Visualization, Writing – review & editing; Gordon Wimpress: Data curation, Project administration, Software, Writing – original draft, Writing – review & editing; Eric Andrew Apaydin: Formal analysis, Software, Visualization, Writing – original draft, Writing – review & editing.
Funding statement
This work was supported by the National Center for Advancing Translational Science (NCATS) of the National Institutes of Health under award number UL1TR001855. Dr. Eric Apaydin was supported by a VA Health Systems Research Career Development Award under award number IK2HX003534. The content is solely the responsibility of the authors and does not necessarily represent the official views of the National Institutes of Health.
Competing interests
The authors have no conflicts of interest to report.


 Open access

