Introduction
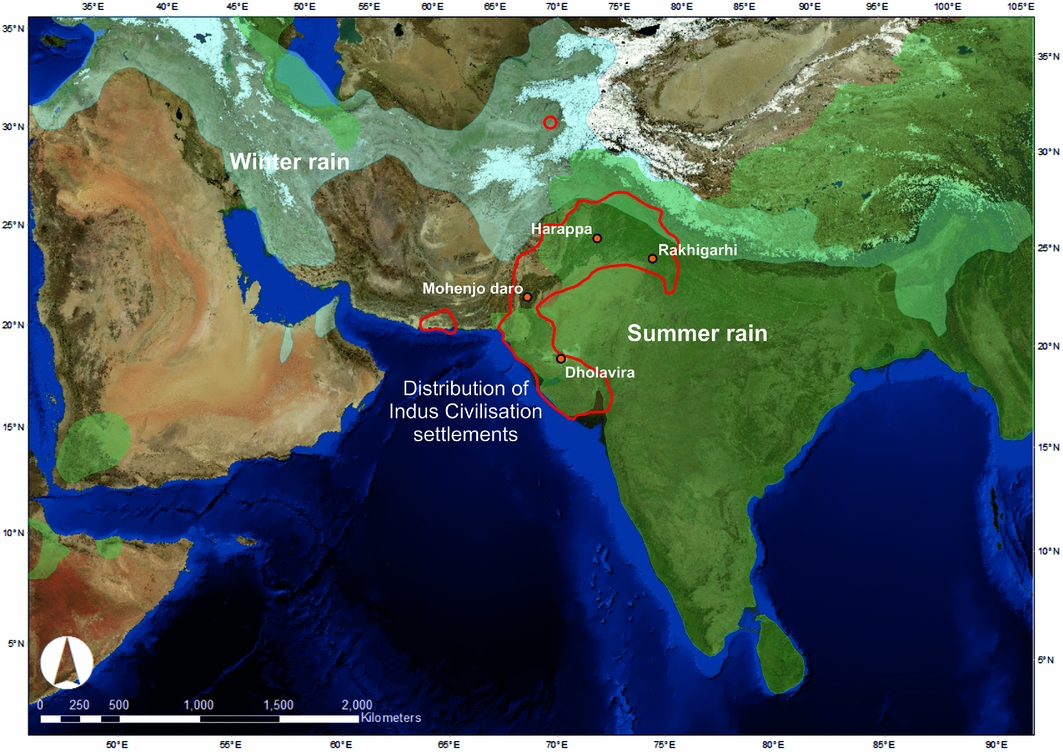
The ability to produce and control agricultural surpluses was a fundamental factor in the rise of the earliest complex societies and cities, but there was considerable variability in the crops that were exploited in different regions. The populations of South Asia's Indus civilisation occupied a climatically and environmentally diverse region that benefited from both winter and summer rainfall systems, with the latter coming via the Indian summer monsoon (Figure 1; Wright Reference Wright2010; Petrie et al. in press). While winter crops appear to have dominated the Indus subsistence strategies of many settlements prior to and during the period of major urbanism (c. 2600–1900 BC; e.g. Weber Reference Weber1999, Reference Weber, Weber and Belcher2003: 180; Wright Reference Wright2010: 169–70; Fuller Reference Fuller2011; see online supplementary material (OSM) 1, Table S1), scholars have long speculated that Indus populations practised some form of multi-cropping involving both winter and summer crops (Vishnu-Mittre & Savithri Reference Savithri and Possehl1982; Chakrabarti Reference Chakrabarti1988: 95; Weber Reference Weber1999, Reference Weber, Weber and Belcher2003). There has, however, been a lack of direct absolute dates to confirm the complexity and diversity of the subsistence strategies used by pre-urban- and urban-phase populations.
The region across which Indus-period settlements are distributed, with the distribution of modern winter and summer rainfall indicated. Precise rainfall distribution patterns during the Middle Holocene are as yet unclear (see OSM 1). Map generated using NASA Blue Marble: Next Generation satellite imagery, which was produced by Reto Stöckli and obtained from NASA's Earth Observatory (NASA Goddard Space Flight Center). See: http://earthobservatory.nasa.gov/Features/BlueMarble/. Rainfall distribution data were extracted from the University of Delaware's monthly global gridded high-resolution station (land) dataset of precipitation from 1900–2008 (v2.01) by D.I. Redhouse using GDAL/OGR41. Map prepared by C.A. Petrie using ArcMAP 10.2. Data available from: http://www.esrl.noaa.gov/psd/data/gridded/data.UDel_AirT_Precip.html.

Here we present the first direct absolute dates for the use of the summer crops—rice, millets and three tropical pulse species—at two settlements in the hinterland of the Indus urban site of Rakhigarhi. This was the easternmost of the Indus cities, and was occupied contemporaneously with Mohenjo-daro, Harappa and Dholavira. The accurate dating of the exploitation of summer crops by Indus populations confirms the role of native summer domesticates in the rise of Indus cities, and demonstrates that different crops, and thus variable provisioning strategies, were used to feed different urban centres from their earliest phases. These findings have important implications for our understanding of how the earliest cities developed in South Asia, how labour and provisioning were organised throughout the year, and also how Indus populations interacted with each other.
Agriculture and the Indus civilisation
The Indus civilisation was one of the great early complex societies of the Old World, and spanned large parts of modern Pakistan and India during its urban phase (e.g. Lal Reference Lal1997; Kenoyer Reference Kenoyer1998; Possehl Reference Possehl2002; Agrawal Reference Agrawal2007; Wright Reference Wright2010; Figure 1; OSM 1). The expansive region across which Indus settlements were distributed was both geographically and culturally variable, and there was similar variation in Indus subsistence practices (Possehl Reference Possehl and Possehl1982, Reference Possehl2002; Vishnu-Mittre & Savithri Reference Savithri and Possehl1982: 215; Chakrabarti Reference Chakrabarti1988: 95; Weber et al. Reference Weber, Barela and Lehman2010; Wright Reference Wright2010; Petrie Reference Petrie and Clark2013; Weber & Kashyap Reference Weber and Kashyap2016). Current models of the Indus subsistence economy suggest that it was based primarily on cattle- (zebu, water buffalo), sheep- and goat-based pastoralism and wheat- and barley-based agriculture supported by winter rain, with some exploitation of crops watered by summer rain (Chakrabarti Reference Chakrabarti1988, Reference Chakrabarti1999; Meadow Reference Meadow and Harris1996; Lal Reference Lal1997; Weber Reference Weber1999, Reference Weber, Weber and Belcher2003; Fuller & Madella Reference Fuller, Madella, Settar and Korisettar2002; Fuller Reference Fuller2006, Reference Fuller2011; Wright Reference Wright2010: 169–70, 176). The small number of well-published archaeobotanical assemblages has, however, meant that the complexity and diversity in the subsistence practices of Indus populations has been discussed in general terms, and the degree to which there was variation in the use of particular crops is somewhat speculative (e.g. Weber et al. Reference Weber, Barela and Lehman2010; Petrie Reference Petrie and Clark2013). The extent to which Indus populations practised some form of multi-cropping remains unclear as much of the published material shows that urban-phase populations predominantly exploited either winter crops such as wheat and barley (e.g. at Harappa), or summer crops such as millet (e.g. at Rojdi; cf. Wright Reference Wright2010: 169–70). At both of these sites, the proportionally limited use of crops grown in the non-dominant season is attested in the reports where quantification is presented (OSM 2; cf. Petrie & Bates in press). Thus, while the published assemblages certainly demonstrate the use of a range of winter and summer crops, and regional variation in subsistence practices (Weber Reference Weber, Weber and Belcher2003; Weber et al. Reference Weber, Barela and Lehman2010), they have not provided definitive evidence from any single location for cropping in two seasons in anything approaching equivalent proportions (OSM 2). It is probable, however, that the diversity in local environmental conditions, vegetation, rainfall and water supply across the zone occupied by Indus populations necessitated distinctive adaptations in practice and crop selection for successful farming in different areas (Petrie et al. in press). This diversity potentially included strategies relying predominantly on winter or summer crops, as well as strategies where particular combinations of summer and winter crops were used (Singh & Petrie Reference Singh and Petrie2009; Petrie Reference Petrie and Clark2013; Petrie et al. in press).
The date from which Indus populations used winter and summer crops in conjunction has long been debated. It has previously been argued that such practices began at the very end of the Indus urban phase, and continued when the Indus urban system transformed into a rural economy from c. 1900 BC (e.g. Meadow Reference Meadow and Harris1996; Fuller Reference Fuller2006, Reference Fuller2011; Madella & Fuller Reference Madella and Fuller2006; Fuller & Murphy Reference Fuller and Murphy2014; Pokharia et al. Reference Pokharia, Kharakwal and Srivastava2014). Summer crops such as millets, rice and tropical pulses have, however, been documented at early (pre-urban phase) settlements in various regions across South Asia, both inside and particularly outside the Indus zone (e.g. Weber Reference Weber1991, Reference Weber1999; Saraswat 2004/2005; Tewari et al. 2008/Reference Tewari, Srivastava, Saraswat, Singh and Singh2009; Fuller Reference Fuller2011; Fuller & Murphy Reference Fuller and Murphy2014; Kingwell-Banham et al. Reference Kingwell-Banham, Petrie, Fuller, Barker and Goucher2015). Combinations of winter and summer crops have also been attested at several Indus settlements in Haryana (north-west India), including at Banawali, Balu, Kunal and Farmana, in deposits believed to date before and/or during the Indus urban phase (Saraswat et al. Reference Saraswat, Srivastava and Pokharia2000; Saraswat Reference Saraswat2002; Saraswat & Pokharia Reference Saraswat and Pokharia2002, Reference Saraswat and Pokharia2003; Kashyap & Weber Reference Kashyap and Weber2010; Fuller Reference Fuller2011; Weber et al. Reference Weber, Kashyap, Mounce, Shinde, Osada and Kumar2011; Fuller & Murphy Reference Fuller and Murphy2014; Pokharia et al. Reference Pokharia, Kharakwal and Srivastava2014). The plains of north-west India receive significant quantities of both winter and summer rain, and are perhaps the place most likely to have seen an overtly mixed subsistence strategy involving both winter and summer crops during the Indus period. In each of these instances, however, the dating of the exploitation of summer crops remains unconvincing, partly because of incomplete reporting of material and sampling locations (cf. Fuller Reference Fuller, Settar and Korisettar2002: 299; Reference Fuller2011: S358). More crucially, although it has been pointed out that summer crops have been directly dated (e.g. Weber & Kashyap Reference Weber and Kashyap2016), to the best of our knowledge, no direct absolute dates on summer crops that confirm the chronology of their exploitation by Indus populations have yet been published.
The limitations of relative dating and the critical importance of direct dating to demonstrate that specific crops were being used in conjunction at particular times is emphasised by two specific instances of direct dating that have been attempted. Direct dating of wheat grains ostensibly from Mature Harappan deposits at Banawali and Kunal, which are both sites where summer crops were attested (Saraswat et al. Reference Saraswat, Srivastava and Pokharia2000; Saraswat & Pokharia Reference Saraswat and Pokharia2003), have produced ranges of cal AD 80–231 and 1500–1311 cal BC respectively (Liu et al. Reference Liu, Lister, Zhao, Staff, Jones, Zhou, Pokharia, Petrie, Pathak, Lu, Motuzaite Matuzeviciute, Bates, Pilgram and Jones2016: tab. 1). Although these dates are not for summer crops, the date ranges from Kunal are at least 500 years younger than expected, while those from Banawali are at least 2000 years younger than expected, prompting doubt about the proposed dates for summer crop use in each instance. Similarly, two rice grains from the site of Kanmer in Gujarat, ostensibly from Indus levels, were directly dated and produced ranges of cal AD 335–425 and cal AD 321–410 (Pokharia et al. Reference Pokharia, Kharakwal, Rawat, Osada, Nautiyal and Srivastava2011: 1836; Paleo-Labo AMS dating group Reference Kharakwal, Rawat and Osada2012: tab. 13.3). In each instance, it is probable that the dated material ended up in earlier contexts through bioturbation, and the lack of reliable direct absolute dates thus means that the date of the adoption of summer crops by Indus populations remains unclear.
Winter crops and summer crops at Masudpur VII and I
The plains of north-west India are the easternmost area across which Indus settlements were distributed, and are in relatively close proximity to the Ganges Valley (Figure 1). Within the zone occupied by Indus populations, a large area comprised of northern Rajasthan, Haryana and Indian Punjab has often been characterised as one large culture-geographic unit (Possehl Reference Possehl1999: 268, Reference Possehl2002; Wright Reference Wright2010). This zone has, however, significant and nuanced environmental and cultural variation. For example, while this region receives both winter and summer rain, it is marked by a very steep summer rainfall gradient, so the amount of summer monsoon rainfall on different parts of the plain is extremely variable, affecting water run-off patterns, natural vegetation and also the crops that can be grown (Petrie et al. in press).
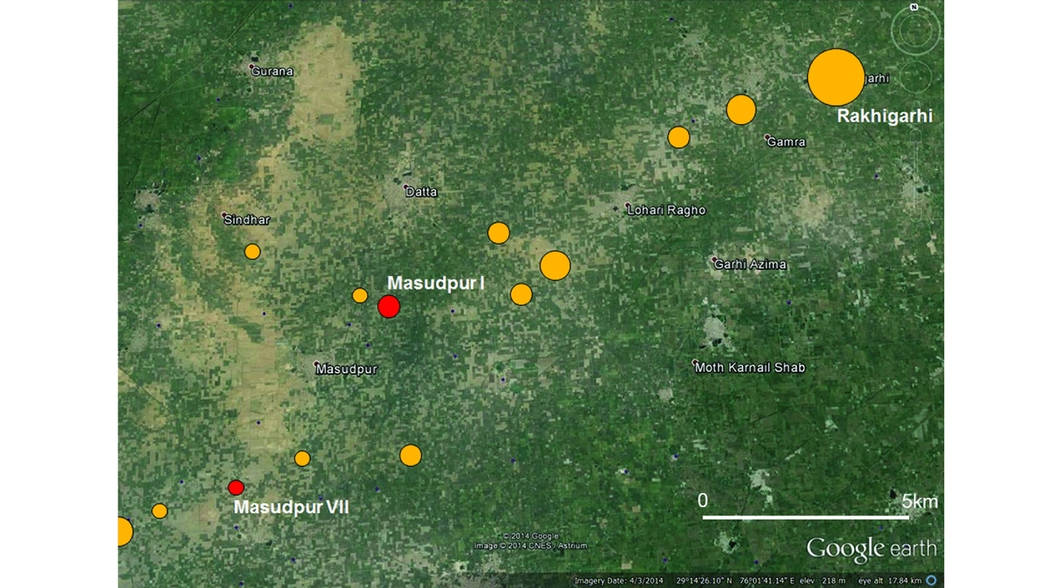
Archaeological surveys have identified hundreds of archaeological sites across this region dating to the period of the Indus civilisation, including settlements occupied in the pre-urban, urban and/or post-urban phases (e.g. Suraj Bhan Reference Bahn1975; Joshi et al. Reference Joshi, Bala, Ram, Lal and Gupta1984; Possehl Reference Possehl1999; Kumar Reference Kumar2009), and the ‘Land, Water and Settlement’ project has been carrying out fieldwork in the region since 2008 (http://www.arch.cam.ac.uk/research/projects/land-water-settlement). The first full-coverage survey of the immediate hinterland (around 15km radius) of an Indus urban site conducted around Rakhigarhi (Rakhigarhi Hinterland Survey, Hissar district, Haryana) highlighted a cluster of 14 settlements in the vicinity of the modern village of Masudpur (labelled Masudpur I–XIV), which lie around 14km from the city and within its sustaining area (Figure 2; Singh et al. Reference Singh, Petrie, French, Goudie, Gupta, Tewari, Singh, Srivastava, Yadav and Singh2008, Reference Singh, Petrie, Pawar, Pandey, Neogi, Singh, Singh, Parikh and Lancelotti2010; Petrie et al. Reference Petrie, Singh and Singh2009; see also Nath et al. Reference Nath, Garge and Law2014; Reference NathNath n.d.). Excavations to obtain well-stratified samples for archaeobotanical analysis and dating were conducted at two of these settlement mounds: Masudpur VII and I (Petrie et al. Reference Petrie, Singh and Singh2009). The proximity of these settlements to Rakhigarhi means that they provide insight into village and town life before, during and after the life of an Indus urban centre, and also into the relationship between urban and rural settlements (Figure 2, OSM 4).
Location of Masudpur VII and I in relation to Rakhigarhi and the other Indus-period settlements. Linear features visible in the digital elevation model (DEM) are modern canals and roads. Map generated using ASTER Global DEM and site location information obtained from Possehl (Reference Possehl1999) and Petrie et al. (Reference Petrie, Singh and Singh2009). Map composed by C.A. Petrie using ArcMAP 10.2.

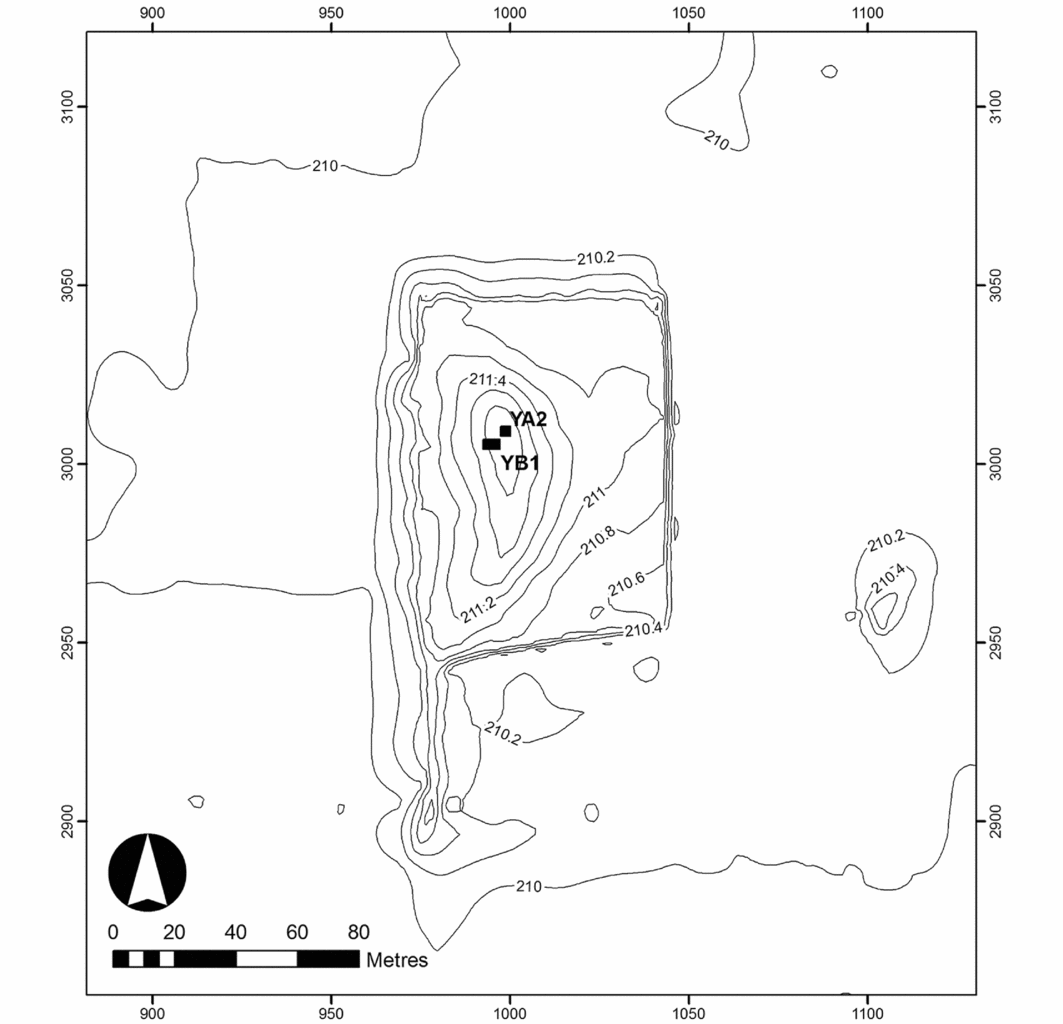
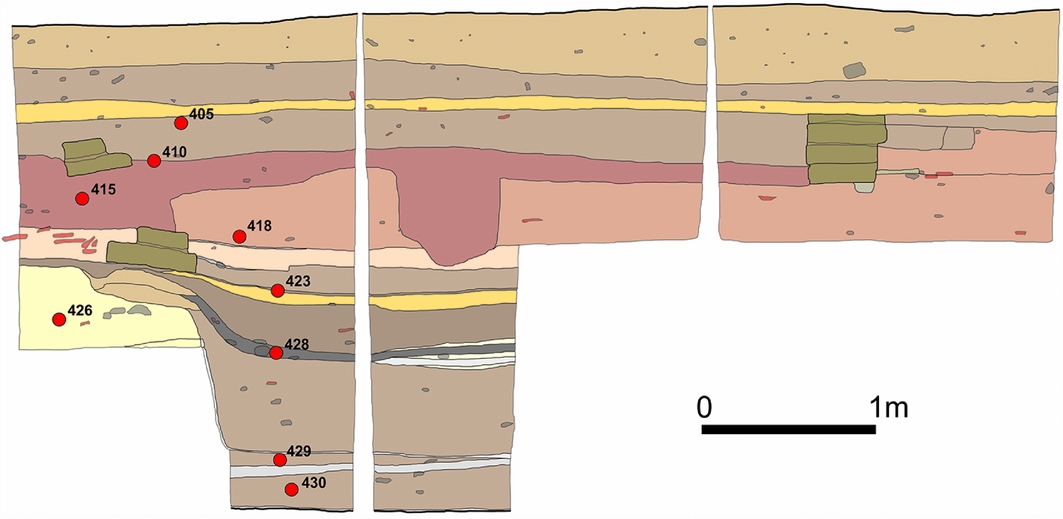
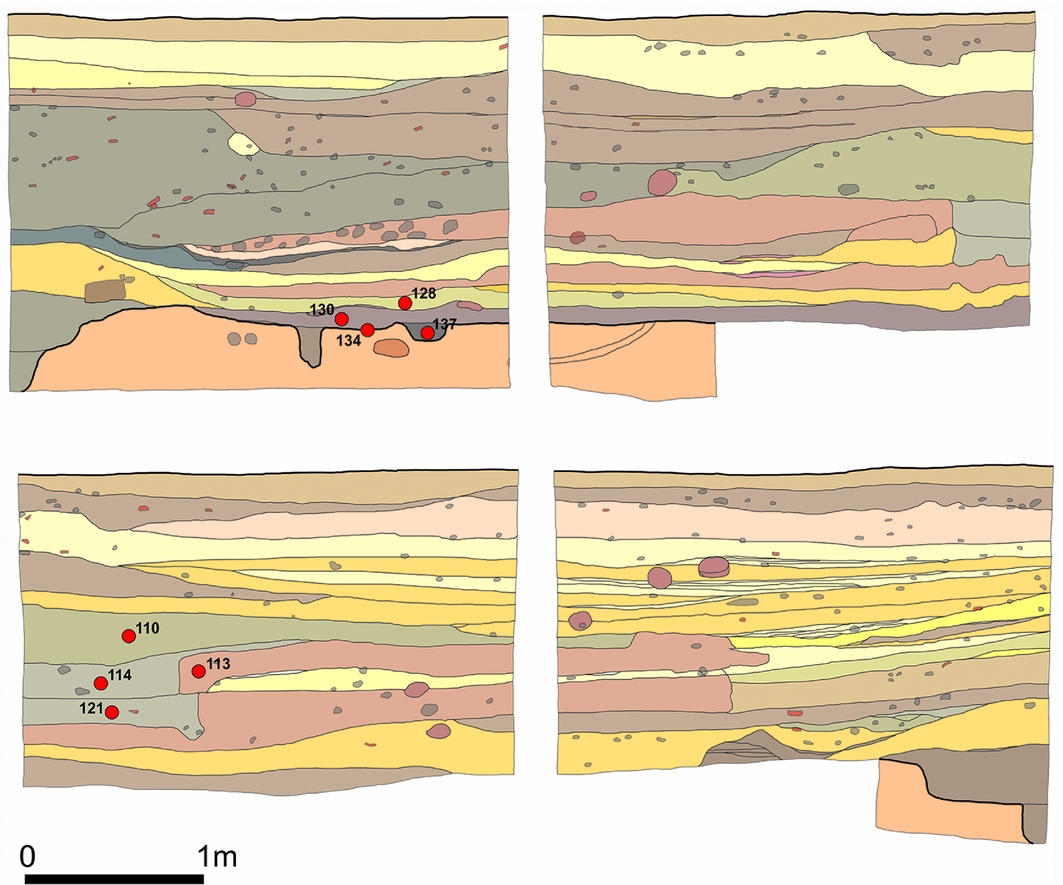
Excavations at Masudpur VII (Bhim Wadha Jodha, about 1ha in size) in April–May 2009 and December 2009 indicated that this was the older of the two sites and was occupied for longer (Petrie et al. Reference Petrie, Singh and Singh2009). Two trenches were excavated: YA2 and YB1 (Figure 3). Trench YA2 was a 2 × 2m sondage placed at the highest point of the mound with the aim of exposing the full cultural sequence of the settlement (Figure 4; Petrie et al. Reference Petrie, Singh and Singh2009). Thirty-one stratified deposits comprising 13 phases of occupation were identified, including structures, associated occupation and pit deposits (Figure 4; Petrie et al. Reference Petrie, Singh and Singh2009). A provisional chronology determined using ceramics, bangle fragments and beads recovered during the excavations indicated that the site was established in the pre-urban Early Harappan, and then occupied again in both the urban Mature Harappan and post-urban Late Harappan periods (Petrie et al. Reference Petrie, Singh and Singh2009). Trench YB1 was begun as a 5 × 3m trench, but was then reduced to a 3 × 1.5m sondage (Figure 5; Petrie et al. Reference Petrie, Singh and Singh2009). Twenty-eight stratigraphic levels were identified comprising 12 phases of occupation, including structures, associated occupation, fill and pit deposits, from which Early, Mature and Late Harappan material was also recovered (Figure 5; Petrie et al. Reference Petrie, Singh and Singh2009).
Location of trenches YA2 and YB1 at Masudpur VII. Contours are at 0.2m intervals.

Stratigraphy of YA2 at Masudpur VII. Contexts where samples were taken are indicated.

Stratigraphy of YB1 at Masudpur VII. Contexts where samples were taken are indicated.

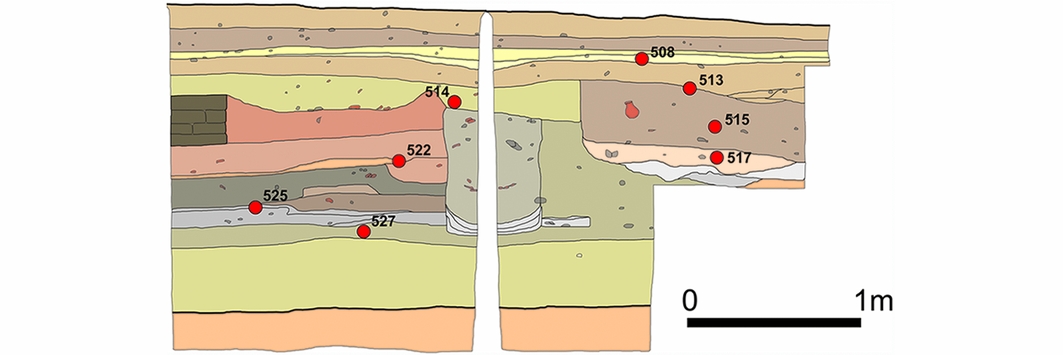
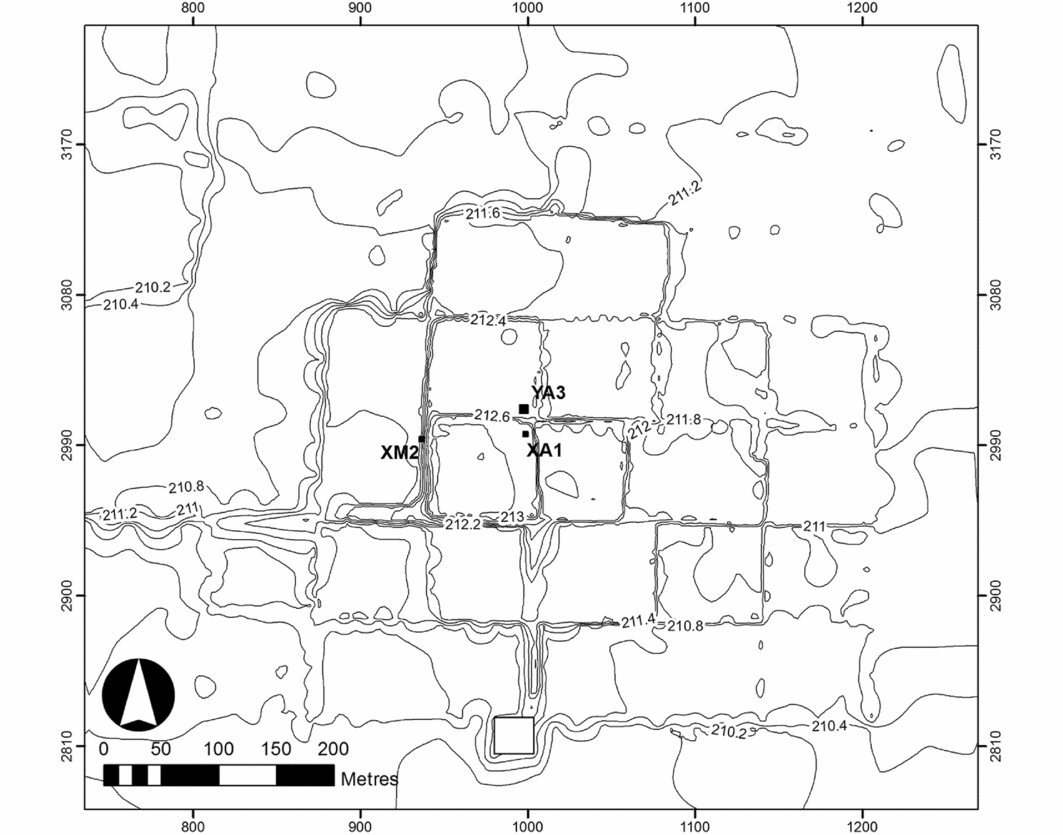
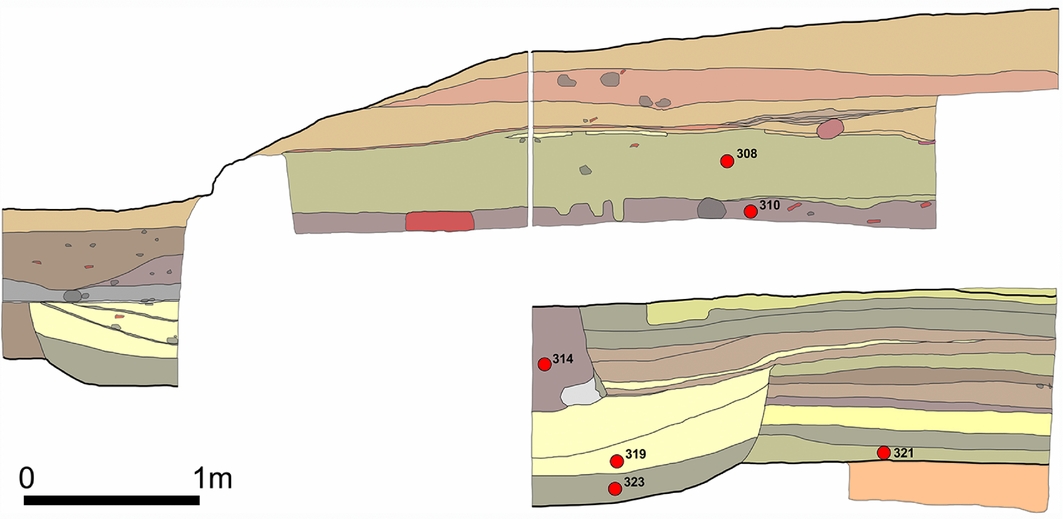
Excavations at Masudpur I (Sampolia Khera; around 6ha in size) were carried out in March–April 2009, and a total of three small trenches were excavated: XA1, YA3 and XM2 (Figure 6). Trench XA1 was a 3 × 3m trench placed at the highest point of the mound in the hope of exposing the full cultural sequence of the settlement (Figure 7; Petrie et al. Reference Petrie, Singh and Singh2009). Thirty-eight stratigraphic deposits were excavated comprising nine phases of occupation, including structures, associated occupation, fill and pit deposits (Petrie et al. Reference Petrie, Singh and Singh2009). Ceramic material, bangle fragments and beads indicated that the settlement was established in the urban Mature Harappan phase, with some occupation also in the post-urban Late Harappan phase (Petrie et al. Reference Petrie, Singh and Singh2009). Trench YA3 was located adjacent to XA1, but none of the material from this trench was submitted for archaeobotanical analysis, so it will not be discussed further (Petrie et al. Reference Petrie, Singh and Singh2009). Trench XM2 was a 3 × 3m trench situated on the western side of the mound, where an exposed section revealed remains of mud-brick architecture (Figure 8; Petrie et al. Reference Petrie, Singh and Singh2009). Twenty-four deposits comprising ten phases of occupation were identified in the excavated trench, including structures, associated occupation, fill and pit deposits. The ceramic material indicated that this part of the site was occupied in both the Mature Harappan and Late Harappan phases (Petrie et al. Reference Petrie, Singh and Singh2009).
Location of the trenches XA1, YA3 and XM2 at Masudpur I. Contours are at 0.2m intervals. The contour plan emphasises the extent to which areas of the site have been levelled to create one-acre fields.

Stratigraphy of XA1 at MSD I. Contexts where samples were taken are indicated.

Stratigraphy of XM2 at Masudpur I.

It is important to note that a number of the ceramic ware types appear to have been in use for extended periods, so the relative chronological indicators cannot be used to provide a high level of precision in dating, and absolute dates are essential. This is especially so as the nature of the stratigraphy at both sites indicated that occupation at these settlements was not continuous (Petrie et al. Reference Petrie, Singh and Singh2009).
Twenty-five samples for macrobotanical analysis were collected from the 59 deposits that were excavated in the two trenches at Masudpur VII, and the range of cereal grains and pulses identified in each context is presented in Table S2. Thirty macrobotanical samples were collected from the 62 deposits excavated in two trenches at Masudpur I, and the range of cereal grains and pulses identified in each context is presented in Table S3. In each instance, 20L of sediment from each sampled context was floated using a bucket flotation system, and the carbonised material was subsequently analysed using the George-Pitt River Laboratory reference collection at the McDonald Institute for Archaeology, University of Cambridge. Detailed macro- and microscopic archaeobotanical analysis revealed the presence of quantities of summer crops including millet (Echinochloa cf. colona and Setaria cf. pumila), rice (Oryza, possibly O. nivara (the wild form), or proto-indica (the semi-domesticated form)), several tropical pulses including mung bean (Vigna radiata), urad bean (Vigna mungo) and horsegram (Macrotyloma cf. uniflorum), as well as winter crops including wheat (Triticum sp.), barley (Hordeum vulgare) and several winter pulses (e.g. Vicia/Lathyrus; Bates Reference Bates2016). At each site, these crops constituted a significant proportion of the evidence for the food crops recovered, with winter crops comprising 15–19 per cent and summer crops comprising 48–68 per cent of the total crop assemblage (OSM 4, Tables S2–3; Bates Reference Bates2016). In addition to the radiocarbon dating of these crops, the archaeobotanical assemblages from Masudpur VII and I have proven suitable for investigating the organisation of Indus crop-processing over time (Bates et al. Reference Bates, Singh and Petrie2016), the ways that Indus populations in north-west India cultivated rice (Bates et al. in press a), the calorific role of different crop types (Bates et al. in press b), and the nature of Indus multi-cropping (Petrie & Bates in press).
Radiocarbon dates
In order to date the various phases of Indus occupation at Masudpur VII and I, and directly date the earliest attestation of carbonised rice, millet and tropical pulses at Indus settlements, a total of 48 samples were submitted for AMS radiocarbon dating at the Oxford Radiocarbon Accelerator Unit, with 24 samples coming from each site (Tables S4–5). Seed grains suitable for dating the earliest appearance of rice, the various millets and tropical pulses from both sites were identified, and, where available, single grains were submitted for analysis. Where this was not possible, multiple grains of the same species from the same context were used. A key objective of the programme was the dating of the earliest attestation of each crop in each trench at each site, with multiple samples from single contexts being used to provide robust dating. The rigour of the pre-treatment process (OSM 4) and a lack of carbonised material in a high proportion of the grains selected for dating meant that 21 samples produced no, or a very low yield of, datable carbon, and only 27 radiocarbon determinations were obtained (Tables S4–5).
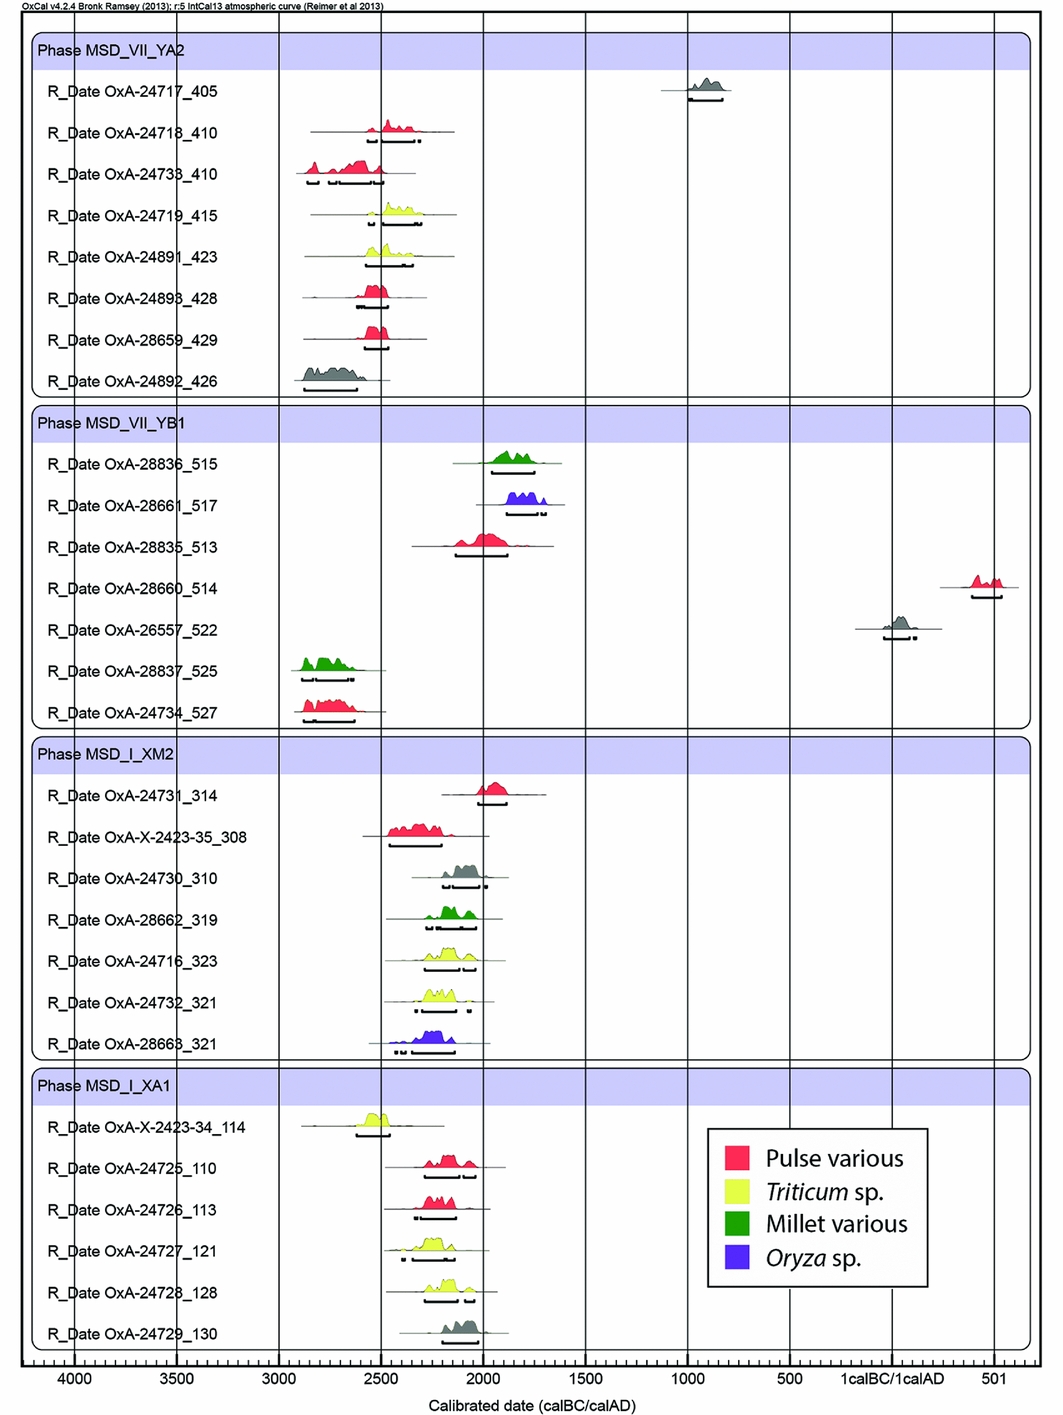
The direct dates of crop species recovered from Masudpur VII and I provide confirmation of the date at which individual crops were being used (Figure 9; OSM 5, Tables S6–7). The dates obtained from Masudpur VII show that Echinochloa sp. and Vicia/Lathyrus were in use by 2890–2630 cal BC (95.4% probability; Table S6). Grains of wheat from the same context were submitted for dating but produced no yield (Table S4). Additional dates show that Macrotyloma cf. uniflorum was in use by 2580–2460 cal BC, and wheat was in use by 2575–2345 cal BC (95.4% probability; Table S6). Fragments of wheat, barley, rice and millet grains, and tropical pulses were also obtained from the same or earlier contexts (Table S2), but these were too small for dating. While it cannot be confirmed, it can reasonably be assumed that all of these species were in use by c. 2580–2460 BC, and continued to be used throughout the occupation of the settlement (Figure 9, Table S2). It should be noted, however, that two of the dates obtained from Masudpur VII were problematic, as these determinations are notably later than expected for the contexts from which they originated (OxA-26557, OxA-28660; OSM 5/Table S6). The sampled material probably originated from an intrusive pit that could not be isolated during the excavations, but was visible in the stratigraphic section (Figure 5). The later date range confirms that these particular seeds were intrusive, and the presence of these later dates in earlier deposits also serves to emphasise the value and importance of direct dating.
Calibrated radiocarbon determinations from Masudpur VII and I.

Dates obtained from Masudpur I show that rice, wheat and Vicia/Lathyrus were in use there by 2430–2140 cal BC, and Fabaceae and Echinochloa sp. were in use by 2290–2030 cal BC (95.4% probability; Table S7). Grains of rice, Echinochloa sp., Setaria sp., Vigna mungo, Vigna radiata and Macrotyloma cf. uniflorum from the stratigraphically earliest deposits at Masudpur I were all submitted for dating but produced low or no yield (Table S5). Again, it can reasonably be assumed that all of these species were exploited at the same time or perhaps even earlier than the dated rice and wheat grains, i.e. by at least 2140 BC, and continued to be used throughout the occupation of the settlement (Figure 4, Table S3). Several determinations from Masudpur I were marked as being inaccurate during the analysis procedure, and this is reflected in the results shown in Figure 4 (see also Tables S6–7). All of the other radiocarbon determinations are stratigraphically consistent, and can thus be taken to date the deposits from which they originated accurately.
Discussion
The archaeobotanical remains from Masudpur VII and I show that wheat and barley were being used throughout the occupation at both settlements, as expected by the traditional models of Indus agriculture (Weber Reference Weber1999, Reference Weber, Weber and Belcher2003; Wright Reference Wright2010; Fuller Reference Fuller2011). These dates also confirm that summer crops were being used alongside winter crops, and confirm that rice, several types of millet, and a number of tropical pulses were being used by populations living in villages on the plains of north-west India before, during and after the existence of the Indus urban centre at Rakhigarhi. The absolute dates presented here are the earliest directly dated attestations of these crops at Indus settlements, and provide support for Fuller's (Reference Fuller2011) suggestion that there might have been local domestication of some crops native to South Asia in this region.
It has been suggested that the subsistence strategies supporting the Indus urban centres of Harappa and Mohenjo-daro, which are situated to the west and south-west of Rakhigarhi in central Punjab and Sind respectively, predominantly involved the procurement and exploitation of winter crops (Weber et al. Reference Weber, Barela and Lehman2010). The limited archaeobotanical remains that are available indicate that summer crops were not used at Mohenjo-daro at all, and although millets and other summer crops were used at Harappa (e.g. Weber Reference Weber, Weber and Belcher2003), proportionally, their use was limited (OSM 2; Petrie & Bates in press). In contrast, the archaeobotanical assemblages from Masudpur VII and I, which both lie in close proximity to Rakhigarhi, show that millets, rice and tropical pulses, as well as wheat and barley, all comprised significant proportions of the subsistence economy of both village settlements. These findings demonstrate that villagers in north-west India were engaging in year-long farming (OSM 4; Bates Reference Bates2016; Petrie & Bates in press), and that the crop proportions attested at Masudpur VII and I are distinct from those seen at the nearby site of Farmana (Weber et al. Reference Weber, Kashyap, Mounce, Shinde, Osada and Kumar2011) and also at Harappa, most notably the presence of rice.
While it is acknowledged that rice was being cultivated in the central Ganges Valley from as early as the seventh millennium BC (Tewari et al. 2008/Reference Tewari, Srivastava, Saraswat, Singh and Singh2009; Fuller Reference Fuller2011; Kingwell-Banham et al. Reference Kingwell-Banham, Petrie, Fuller, Barker and Goucher2015), there is a gap between the first evidence for the cultivation of wild rice stands at Lahuradewa c. 8000–6000 BC (Tewari et al. 2008/Reference Tewari, Srivastava, Saraswat, Singh and Singh2009) and the evidence for the exploitation of fully domesticated rice at Senuwar 2 (Saraswat 2004/2005) and Mahagara by c. 1800–1600 BC (Fuller et al. Reference Fuller, Sato, Castillo, Qin, Weisskopf, Kingwell-Banham, Song, Ahn and van Etten2010: 124–25). Fuller and Madella (Reference Fuller, Madella, Settar and Korisettar2002: 336–37) have previously suggested that rice was “available as a crop [. . .] but not adopted” by Indus populations, and that “there is no reason as yet to believe it was an important crop” until the Late Harappan and even post-Harappan period; i.e. after the arrival of Oryza sativa ssp. japonica from China (Fuller & Qin Reference Fuller and Qin2009). The presence of rice at Masudpur VII and I, however, indicates that rice was being exploited in the hinterland of Rakhigarhi during and potentially also before the Indus urban phase. Given the proximity of this region to the Ganges, the use of rice by Indus populations living there is in many ways logical, and this finding prompts the re-evaluation of the role of rice for Indus populations, and the way that it was transmitted from farther east.
The absolute dates presented here thus provide the first definitive evidence that different subsistence pathways involving combinations of winter and summer crops preceded and ultimately supported the urban settlements of South Asia's earliest complex society. The variation evident in different areas demonstrates that there was diversity in the types of multi-cropping practised across the Indus zone, and suggests that a nuanced approach to characterising Indus cropping systems is desirable (Petrie & Bates in press).
These findings have significant implications for the comprehension of the food-production and -consumption economy of Indus populations in north-west India, the nature of the surplus that they were capable of generating in multiple seasons, and the relationship between cities and the villages in their hinterland in this region. Indus populations generally appear to have been adapted to living in diverse and changeable ecological and environmental conditions, but shared distinctive cultural behaviours across a large area (Petrie et al. in press). In regions where only single-season cropping was possible, it is probable that some form of organised and potentially centralised storage would have been required to feed large urban populations throughout the year. In regions where multi-cropping was possible, food supplies were probably more constant throughout the year, and the storage requirements and potentially the degree and nature of centralisation were probably different. It is certainly possible that a sustainable food economy across the Indus zone was achieved through trade and exchange in staple crops between populations living in different regions (cf. Madella Reference Madella, Madella, Lancelotti and Savard2014). Such a system was probably well suited to mitigating risk (Petrie in press; Petrie et al. in press).
These findings are also significant for demonstrating that there were various ways of feeding early complexity and urbanism not only within South Asia but also across the Old World. It has been argued that there were multiple pathways to urbanism in ancient Mesopotamia, particularly in the dry farming zone of northern Mesopotamia during the Late Chalcolithic and Early Bronze Age, but much of this variation appears to have been related to the dynamics of settlement distribution and demography (Lawrence & Wilkinson Reference Lawrence and Wilkinson2015). In contrast, this South Asian example demonstrates diversity in the underlying environmental, climatic and geographic contexts of the Indus civilisation, and variation in the crops being used in different regions, which in turn appears to have promoted diversity in the approaches to subsistence used by populations occupying different parts of the landscape. The subsistence practices of the Indus civilisation therefore make a unique and important contribution to our understanding of the rise of early socio-economic complexity and urbanism.
Acknowledgements
The research presented in this paper was conducted under the auspices of the multidisciplinary ‘Land, Water and Settlement’ project, which ran between 2008 and 2014 under the co-direction of C.A. Petrie (Cambridge, UK) and R.N. Singh (BHU, India) (http://www.arch.cam.ac.uk/rivers/). The research of the ‘Land, Water and Settlement’ project was made possible thanks to a Standard Award from the UK India Education and Research Initiative, and funding from the British Academy's Stein Arnold Fund and International Mobility Scheme, the Isaac Newton Trust and the McDonald Institute for Archaeological Research. Permission to carry out the excavations conducted by the project, and to export samples for analysis, was granted by the Director of Exploration and Excavation, Archaeological Survey of India. The radiocarbon dating was made possible thanks to grants awarded by the Natural Environment Research Council (NERC) funded NERC Radiocarbon Facility (project numbers NF/2009/2/7 and NF/2013/1/6), and was overseen by T. Higham. During her PhD research, J. Bates was supported by an Arts and Humanities Research Council studentship, and was awarded funding for fieldwork by Trinity College and the Division of Archaeology, Department of Archaeology and Anthropology, University of Cambridge. We would like to thank C. Broodbank, M.K. Jones, C. Lancelotti, M. Madella, T.C. O'Connell and L.R. Weeks for providing useful comments on drafts of the manuscript.
Supplementary material
To view supplementary material for this article, please visit http://dx.doi.org/10.15184/aqy.2016.210