I. INTRODUCTION
Reducing structural weight is one of the most important goals for the improvement of the aircrafts' performance. Due to their low density and high strength, lower manufacturing and/or life cycle costs, aluminum alloys are particularly suitable for lightweight applications and have been the most widely used structural materials in aircrafts for several decades.Reference Williams and Starke1 Compared with the other aluminum alloys, aluminum–lithium (Al–Li) alloys exhibit higher elastic modulus, lower density, improved corrosion resistance, better fatigue performance, and higher specific strength. Nowadays, application of Al–Li alloys in the aerospace industry as structural components has become an important method to reduce the weight, increase the payload, and improve the fuel efficiency of aircraft.Reference Prasad, Gokhale and Wanhill2 The significant potential for weight savings has promoted the development of a series of Al–Li alloys.Reference Peters and Leyens3 As one of the newly developed Al–Li alloys, the 2099 alloy can be considered as a promising aluminum alloy for aeronautical applications that involve lowest structural weight, highest damage tolerance and durability. 2099-T83 extrusion products have been qualified for use on Airbus A380 (Toulouse, France) applications such as crossbeams, seat rails, false rails, cockpit, fuselage skin, emergency bay floor structures, and electronic racks.Reference Hirsch, Skrotzki and Gottstein4
It has been acknowledged that good corrosion resistance of aluminum alloys is attributed to the formation of a layer of rapidly formed passive oxide film on surface. The oxide film is naturally self-renewing, and accidental abrasion or other mechanical damage to the surface film is rapidly repaired.Reference Ghali, Sastri and Elboujdaini5 However, in the presence of aggressive halide anions, especially chloride ions (Cl−), aluminum alloys are subjected to localized corrosion.Reference Wong and Alkire6 The intermetallic phase such as Al7Cu2Fe and Al2CuMg can also promote pitting to initiate on the surface of aluminum alloy even in the solution without halide anions.Reference Liao and Wei7,Reference Chen, Gao and Wei8
Aluminum alloy products corrode in a localized manner either by pitting, intergranular attack, or exfoliation.Reference Soboyejo and Srivatsan9 Of the three types of localized corrosion, pitting is the least damaging and most easily controlled. Pitting can be minimized by surface treatments, and when it occurs, it is easily detected. Some older generation Al–Li alloys had corrosion performance which was similar to or lower than that of conventional aluminum alloys. The 3rd-generation Al–Li alloys provide significant improvements on corrosion resistance in comparison to the older generation Al–Li alloys.Reference Giummarra, Rioja, Bray, Magnusen and Moran10 The corrosion performance was improved mainly via alloying and tempering. It is reported that the 2099 alloy exhibits no exfoliation and only pitting corrosion after exposures to marine environment for 19.1 years.Reference Rioja and Liu11
In this study, the corrosion behavior of the 2099 Al–Li alloy was investigated using electrochemical measurements together with full immersion tests at ambient temperature to gain a better understanding of the corrosion mechanism. Scanning electron microscopy (SEM) and energy dispersive x-ray spectroscopy (EDS) enabled us to confirm the nature of the corrosion inhibition and to establish some features of the inhibition.
II. EXPERIMENTAL
A. Specimens preparation
Commercial 2099-T83 alloy sheet with a thickness of 2 mm was used in this study. In the T83 state, the alloy was hot-extruded, heat-treated, tempered, and subjected to a 3% cold working before a two-step aging. Its nominal chemical composition is shown in Table I. For electrochemical measurements, immersion test, and metallographic characterization, specimens were wet ground through successive grades of silicon carbide abrasive papers from P120 to P2000 followed by diamond finishing to 0.1 µm, followed by rinsing with alcohol and drying in warm air. In all cases, the tests were performed in duplicate to guarantee the reliability of the results.
Chemical composition of 2099 alloy.

B. Electrochemical measurements
The evaluation of polarization curves is often used in corrosion studies to obtain some kinetic information on the overall corrosion reaction like the corrosion potential (E corr) and the corrosion current density (i corr). Electrochemical measurements were performed using specimens of working area 38.5 mm2 immersed in stagnant, naturally aerated 1.5, 3.5, and 5 wt% NaCl aqueous solutions at room temperature (20 ± 1 °C). A potentiostat/galvanostat connected to a three-electrode cell was used for the electrochemical measurements. The working electrode was the test specimen. The counterelectrode was platinum (Pt) of diameter 0.2 mm and total length 40 mm, and the reference electrode was saturated calomel electrode (SCE) with a potential of 0.197 V with respect to the standard hydrogen electrode. Polarization measurements were carried out at a scan rate of 10 mV/s, from −2.0 to 0 V with respect to the corrosion potential (E corr). It is important to remark that the use of very small scan rates is suggested to minimize the effects of distortion in Tafel slopes and current density, as reported in literature.Reference Osório, Peixoto, Moutinho, Gomes, Ferreira and Garcia12–Reference Zaid, Saidi, Benzaid and Hadji14 The anodic corrosion current density was limited to 5 mA/cm2.
C. Immersion test
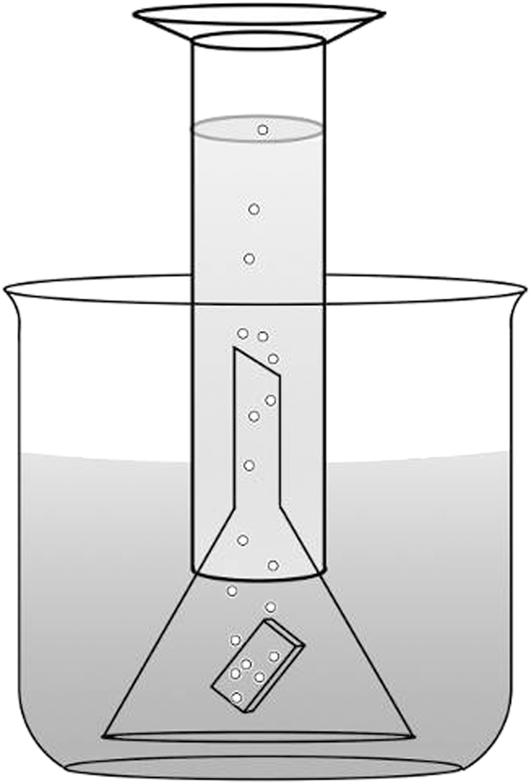
Immersion tests were developed to provide simpler, more easily controlled test methods.Reference Davis15 The specimens for the immersion test with size of 20 mm × 10 mm×2 mm were machined from the sheets. Before the test, the specimens were polished with silicon carbide abrasive papers from P120 to P2000, and cleaned with acetone and deionized water. Every specimen was weighed (original mass, m 0) and the surface area (S) was measured before the test. The corrosion media, 1.5, 3.5, and 5 wt% NaCl aqueous solutions, were prepared with analytical grade NaCl reagent (≥99.5 wt%) and deionized water. The specimens of 2099 alloy were immersed in the naturally aerated stagnant solutions for different periods of time and after each immersion they were cleaned by dipping in deionized water. The specimens were removed from the water and dried again, and weighed the final mass (m 1). Weight loss method and hydrogen evolution method were used to evaluate the corrosion rate. The difference between m 0 and m 1 was designated as the corrosion mass loss. For hydrogen evolution test, depicted in Fig. 1, each specimen was put in beakers containing 300 mL solutions. A funnel was placed over the specimen to collect hydrogen from the specimen surface. A measuring cylinder was mounted over the funnel and filled with solutions. The volumes of solutions in measuring cylinder were read before and after every immersion test to obtain the hydrogen evolution volumes. In this way, the rate of hydrogen evolution was measured.
Schematic diagram of immersion test.

D. Surface and microstructure characterization
After each immersion test, the specimens were analyzed by means of visual inspection, SEM, and EDS. JSM-6460 SEM equipped with an EDS (JEOL, Tokyo, Japan) was used to observe the corrosion morphologies and analyze the elements. After the each SEM observation, the specimen was then reimmersed into the NaCl solution. The microstructure of 2099 alloy was characterized by transmission electron microscopy (TEM). Specimens for TEM were prepared by grinding–polishing the specimen to produce a foil of 50 μm thickness followed by twin-jet electropolishing. Further thinning to a thickness of electron transparency was carried out by using ion milling.
III. RESULTS AND DISCUSSION
A. Electrochemical properties
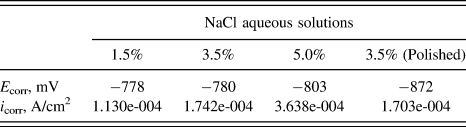
The corrosion potential (E corr) and corrosion current density (i corr) were determined from potentiodynamic polarization plot through Tafel extrapolation method. Figure 2 illustrates polarization curves of specimens in 1.5, 3.5, and 5 wt% NaCl solution, respectively. The corresponding data derived from polarization curves are summarized in Table II. Significant difference in polarization behavior between the specimens was observed. With the increase in molar concentration of the solution, corrosion potential decreases from −778 to −803 mV and corrosion current density increases from 1.130e-004 A/cm2 to 3.638e-004 A/cm2. It can be demonstrated that the increasing the concentration of NaCl in solution significantly declined the polarization behavior of the 2099 alloy, not only markedly decreasing the anodic current density and cathodic current density, but also having the tendency of shifting corrosion current density to higher value, and slightly lowering the corrosion potential. It is obvious that the corrosion rate increased with increasing chloride ion concentration.
The potentiodynamic polarization curve of 2099 alloy in NaCl solutions drawn in (a) E versus log i and (b) E versus i.
Results of electrochemical corrosion resistance tests of 2099 alloy.
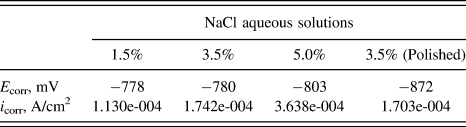
For comparative purposes, and to more fully describe the behavior of the native oxide film and further the understanding of protection mechanisms of 2099 alloy, the freshly polished specimen has been compared with the specimens with oxide films formed as a result of the manufacturing process (as-received condition). After polishing, the corrosion potential is decreased to −872 mV markedly. It indicates that the specimen in polished condition showed the poorer polarization behavior than the specimen in as-received condition although under same solution concentration. The 2099 alloys in as-received condition showed better corrosion resistance than the freshly polished alloys.
B. Immersion properties
To measure the effect of solution concentration on corrosion resistance of 2099 alloy, the specimens were immerged in 1.5, 3.5, and 5 wt% NaCl solutions. The surface morphologies of the corroded specimens were observed by means of visual inspection. The typical photographs are shown in Fig. 3. During the immersion, the alloy surface was found to corrode gradually. It is obvious that the immersion time plays an important role in the corrosion of the alloy. The corrosion degree increases with increasing immersion time. The surface of the specimens that appeared metallic luster at beginning became dark with increasing immersion time. It is also found that the solution concentration plays an important role in the corrosion of the alloy. The corrosion degree increases with the increase in solution concentration at different periods of immersion time. Immersion test results for the tested alloy confirmed the electrochemical measurements results that greater predisposition for electrochemical corrosion with the increase of solution concentration.
Photos of 2099 alloy after immersed in NaCl solutions for (a) 1 day, (b) 2 days, (c) 22 days, and (d) 33 days.
There was no corrosion pit can be observed in the early stage of immersion test, as shown in Figs. 3(a) and 3(b). After 22 days immersion, some pits become distinguishable [Fig. 3(c)]. In the other area, the corrosion products cover most surface resulting from uniform corrosion.
Figure 4 plots weight loss versus time curves of specimens immersed in 1.5, 3.5, and 5 wt% NaCl solutions. It was found that the curves are quite smooth without significant weight changes. Due to the formation of a layer of passive oxide film before the test and the deposition of the corrosion products that gradually deposited on the aluminum alloy surface, the contact between the aluminum alloy and the corrosive medium is hindered. The corrosion products also can be explained by the increases in several stages of the weight loss–time curves.
Weight–time curves of full immersed 2099 alloy specimens in NaCl aqueous solution.
The volume of evolved hydrogen is related to dissolution of aluminum. The corrosion products do not influence the relationship between hydrogen evolution and aluminum dissolution. The hydrogen evolution method is thus reliable, easy to implement, and not prone to errors inherent to weight loss measurements. However, very few hydrogen evolutions are evolved from the surface of the specimens during immersion test. Figure 5 depicts the hydrogen evolution volume as a function of immersion time in NaCl aqueous solutions with different concentrations. It is obvious that there is very small hydrogen volume during immersion test.
Hydrogen evolution volume–time curves of full immersed 2099 alloy specimens in NaCl aqueous solution.
It is well known that the corrosion of aluminum alloy is closely related with the intermetallic phase.Reference Osório, Spinelli, Ferreira and Garcia16–Reference Osorio, Freitas, Spinelli, Cante, Afonso and Garcia18 In the early stage of weight loss and hydrogen evolution, the curves of more concentrated solutions, such as 3.5 and 5 wt% NaCl solutions, are characterized by a rapid rise. It occurs as a consequence of a rapidly and drastic corrosion, and results in a detaching of these intermetallic precipitates from the lattice. After detached nobler intermetallic precipitates, the corrosion process tends to stabilize due to corrosion products on the surface of specimens providing a protective oxide layer.Reference Osorio, Freitas, Spinelli, Cante, Afonso and Garcia18 However, the 1.5 wt% NaCl solution has shown less aggressive when compared with other solutions. For this reason, the intermetallic precipitates are not rapidly detached from alloy matrix. It induces to more pitting and consequently increases the hydrogen volume. Results from the hydrogen evolution method and the weight loss method are quite consistent. Both hydrogen evolution and weight loss are generally not a good indication of the extent of pitting due to uniform corrosion is slight and pitting is not severe. Therefore, we are able to conclude that the 2099 alloy has very good corrosion resistance in NaCl aqueous solution.
C. Surface morphology of the corroded alloy
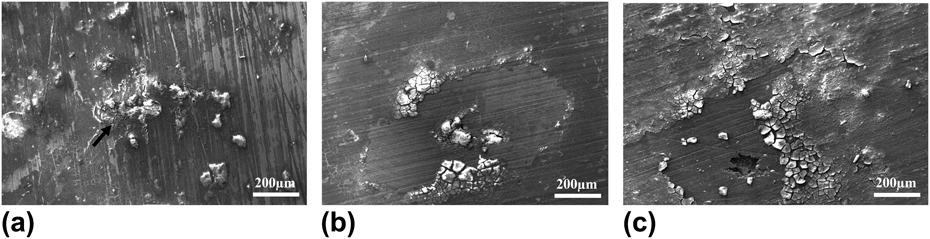
The surface morphologies of the corroded specimens were observed by means of SEM. Figures 6(a)–6(c) presents the typical defects in the NaCl solution after 14 days of immersion. As seen from Fig. 6(a), the surface oxide films immersed in 1.5% NaCl solution contain microcracks, as marked by arrow. Figure 6(b) shows the microcracks in 3.5% NaCl solution had appeared to widen apparently in the area around a pit, which has a higher number of corrosion cracks compared with Fig. 6(a). With further increase of solution concentrations to 5.0%, pitting corrosion grew and the large pitting cavities formed, as shown in Fig. 6(c). It supposes that a sufficient amount of Al around the particle is dissolved away, and the particle drop off from the Al substrate. For Al, dissolution results in the release of Al3+. Hydrolysis of the Al chloride corrosion products results in the precipitation of Al(OH)3 as solid corrosion products around the pit mouth and on the surface of the matrix nearby.
Corrosion morphologies of 2099 alloys after immersed in (a) 1.5%, (b) 3.5%, and (c) 5.0% NaCl solution for 14 days.
And as can also be seen from Figs. 6(b) and 6(c), the surface oxide films of the alloys showed brittle behavior.Reference Mearini and Hoffman19 The surface oxide films in the area around pits drop off from the substrate during the dipping in deionized water. The phenomenon is not observed in Fig. 6(a) due to the low corrosion degree. It is well known that a thin layer of amorphous native Al2O3 will form on surface of aluminum upon exposure to oxygen or dry air at room temperature. The thickness of Al2O3 becomes 2–4 nm in several hours, and reaches a value of about 5 nm after long time.Reference Saif, Zhang, Haque and Hsia20 Since the molar volume of Al2O3 is 1.7 times that of Al, the oxide films form a continuous film on Al surface. It offers a natural sealant against corrosion of the alloy if the oxide films are thin. However, it may lead to cracks due to the volume ratio of Al2O3 to Al and brittleness of Al2O3 if the oxide films become thicken by immersed in aggressive NaCl aqueous solution.
D. EDS analysis
To verify the assumption on cracks of the oxide films, EDS analysis was carried out in the area away from pits of less severe corrosion. Figure 7(a) shows the corrosion morphologies of 2099 alloy after immersed in 3.5% NaCl solution for 14 days. It is clearly seen from the SEM images that there are oxide films with separation, cracking, and drop-off observed on the surface in central area. The oxide films white out due to the electrons accumulation which relates the poor electric conductivity of the oxide films. However, the oxide films around central area have high adherence and uniformity.
Corrosion morphologies and EDS analysis of 2099 alloy after immersed in 3.5% NaCl solution for 14 days.
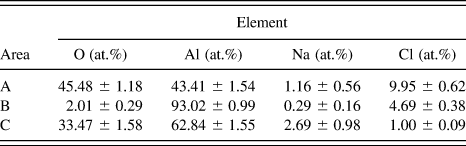
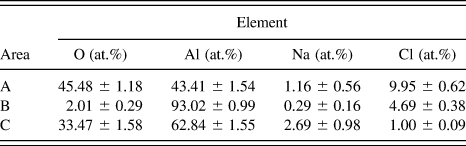
The corresponding EDS profile analyses for the selected areas A, B, and C on Fig. 7(a) are shown in Figs. 7(b), 7(c), and 7(d), respectively. The element contents are given in Table III. As EDS profile presented in Fig. 7(b), the atomic percentage of the elements found in the selected white area A were 43.41% Al, 45.48% O, 1.16% Na, and 9.95% Cl. This suggests that the compounds formed in the area are mainly aluminum oxides and aluminum chlorides. On the other hand, the atomic percentages of the elements found in the area B were 93.02% Al, 2.01% O, 0.29% Na, and 04.69% Cl. It is obvious that the new-exposured surface is the comparatively fresh alloy with less corrosion after the oxide films drop off. The atomic percentages of the elements found in the area C were 62.84% Al, 33.47% O, 2.69% Na, and 1.00% Cl. It means that the oxide film in the area A are relatively thicker than the area C as the percentage of O in the area A is higher. It is illustrated that the oxide films are likely to suffer separation, cracking, and drop-off with increasing the oxidation degree.
Chemical composition distribution of oxide films.
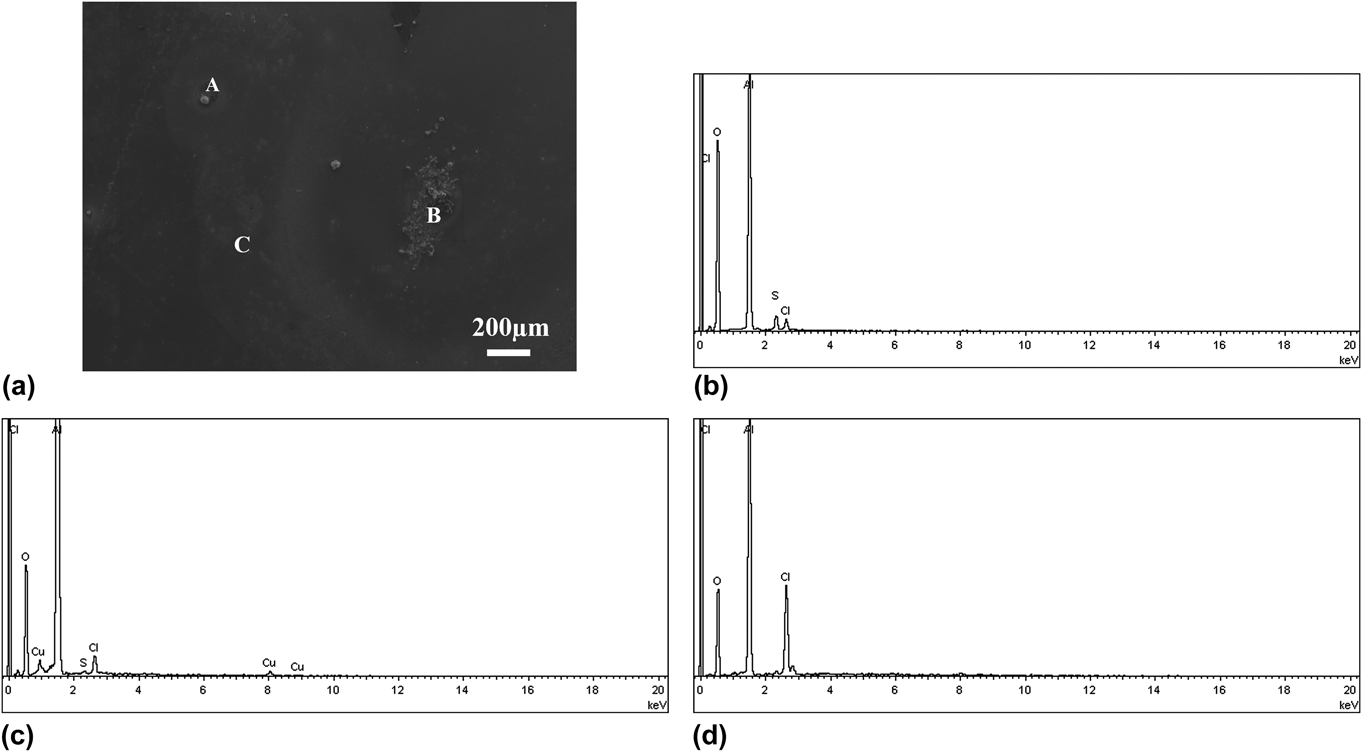
To verify the initiation of pitting corrosion of 2099 Al alloy, EDS analysis was also conducted to analyze the chemical elements in corroded and noncorroded areas of the surface. Figure 8 shows the corrosion morphologies and the EDS analysis of 2099 alloys after immersed in 3.5% NaCl solution for 10 h. Table IV presents the results from the EDS analysis. For both alloys, Al and O peaks can be detected in all area, while Cl and Cu are detected in some area. Figure 8(d) is EDS spectrum from area C with less corrosion. The percentage of O in the area C is lowest. Figures 8(b) and 8(c) are EDS spectra from area A and B in Fig. 8(a), the pits on the surface of 2099 alloys after immersion for 10 h. The surface is characterized by Al and O mainly. Furthermore, the sulfur can be detected. The sulfur element may occur infrequently as an impurity in aluminum alloy in the form of sulfide. It accelerates the attack in the presence of NaCl solution, and this leads to surface pitting. It indicates that the onset of pitting corrosion of 2099 Al alloy is indeed associated with the impurity.
Corrosion morphologies and EDS analysis of 2099 alloy after immersed in 3.5% NaCl solution for 10 h.
Chemical composition distribution of oxide films.
A schematic diagram of the corrosion process on 2099 alloy is given in Fig. 9. Figure 9(a) shows the area around impurity just after the alloy covered with a thin layer of aluminum oxide is immersed in the solution. Figure 9(b) shows the reactions involved in the corrosion process after short-term exposure to the solution. The main anodic reaction is the oxidation of aluminum. The cathodic reaction is the water containing dissolved oxygen reduced to hydroxide ions. An amount of Al around the impurity is dissolved away and the cracks have appeared. Figure 9(c) shows a more sufficient amount of Al around the impurity is dissolved away and the cracks is widen. The impurity and surface around is completely covered by corrosion deposits. The surface oxide films are thickening and microcracks nucleate from oxide films. Figure 9(d) shows a final state where the impurity drops off from the Al substrate. The oxide films around impurity are also separated from the Al substrate.
Schematic diagram of the reactions inside the pit.
E. Microstructure characterization
Due to the potential difference between the precipitates and the matrix, the precipitates or particles usually cause localized corrosion such as pitting corrosion and intergranular corrosion. The intermetallic precipitates or particles which are electrochemically nobler than the matrix can act as effective cathodes initiating pitting corrosion.Reference Szklarska-Smialowska21 Therefore, the nature and spatial distribution of precipitates were investigated by TEM.
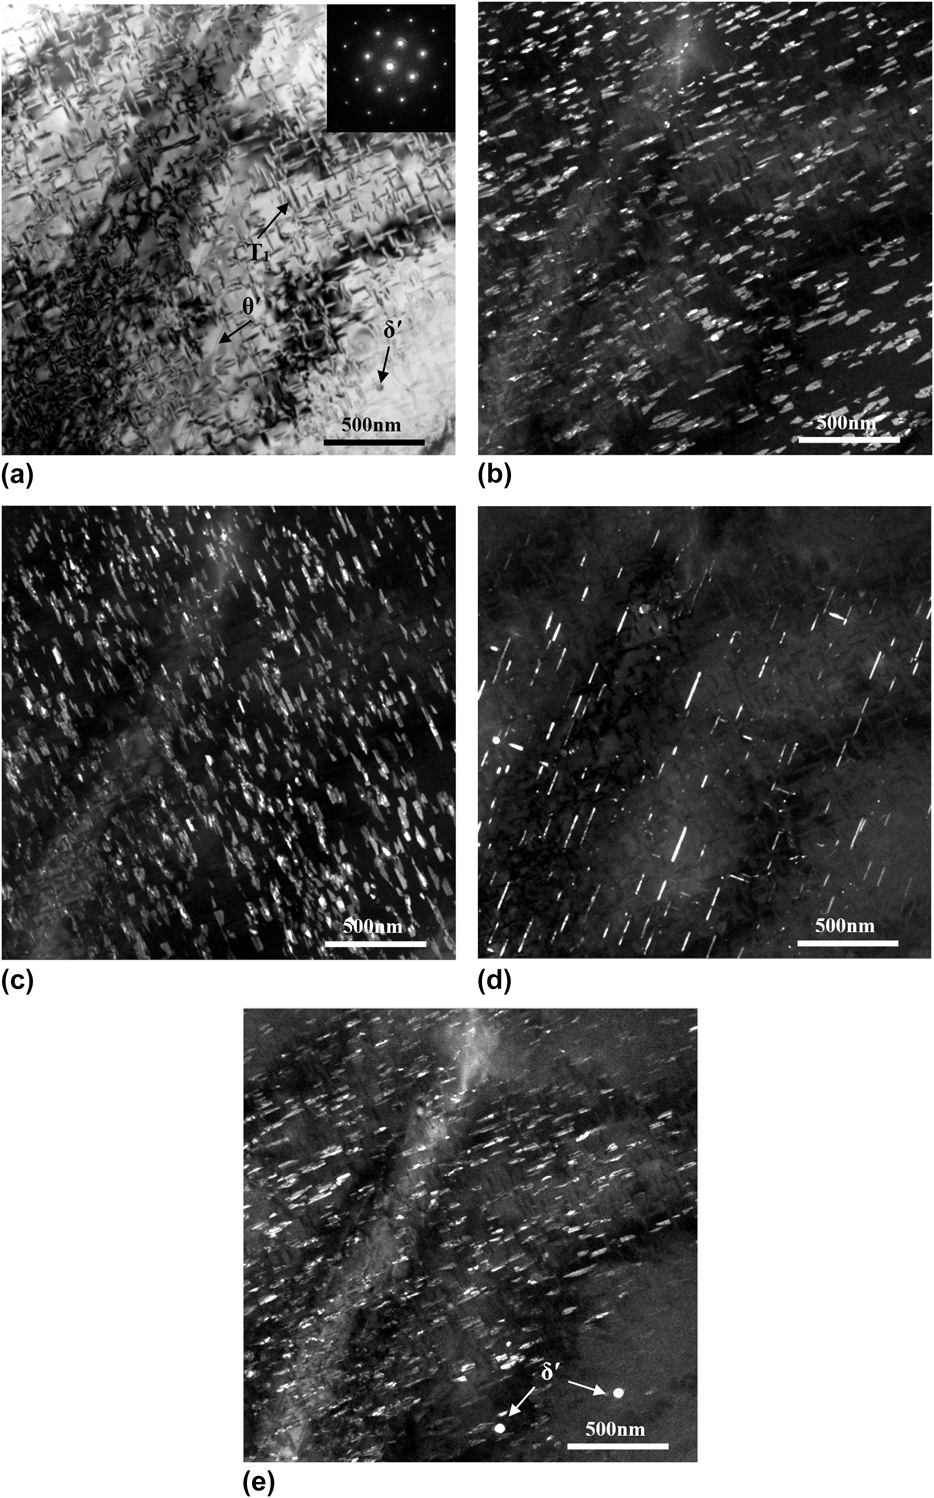
Figure 10 shows a typical TEM image of the 2099 alloy, viewed along the [001]Al axis. It reveals a high density of precipitates within the matrix. The insert depicted in Fig. 10(a) is the selected area electron diffraction (SAED) pattern taken from the region. Several sets of diffraction spots, including aluminum matrix diffraction spots, are shown in the SAED pattern. The diffraction spots at 1/3 [220]Al are from the needle-like T1 (Al2CuLi) phase. The orientation relationship with matrix was determined as  ${(0001)_{{\rm{T}}1}}//{(1{\rm{ }}1{\rm{ }}1)_{{\rm{Al}}}},\,{[10\overline 1 0]_{{\rm{T1}}}}//{[1\overline 1 0]_{{\rm{Al}}}}{\rm{.}}$Reference Wang and Starink22 The obtained dark field TEM images using the diffraction spots from the spots are shown in Figs. 10(b) and 10(c). The images show a homogeneous distribution of precipitates with 60–100 nm in length and 20–40 nm in width. The superlattice spots are from the plate-like θ′ (Al2Cu) phase. The orientation relationship with matrix was determined as (1 0 0)θ′//(1 0 0)Al, [0 0 1]θ′//[0 0 1]Al.Reference Muddle and Polmear23Figure 10(d) shows the obtained dark field TEM images using the diffraction spots from the spots. The precipitates on {001} planes are 100–150 nm long and occur less frequently than T1 phase. Besides, there were few spherical precipitates, δ′ (Al3Li) phase, observed. The δ′ phase is fully coherent with the matrix: (100)δ′//(100)Al, [001]δ′//[001]Al.Reference Wang and Starink22 A dark field transmission electron micrograph of the δ′ phase is shown in Fig. 10(e).
TEM bright field image of 2099 alloy together with an inset SAED pattern (a), dark field images of T1 phase (b–c), θ′ phase (d), and δ′ phase (e), respectively.
As discussed above, the precipitates such as T1(Al2CuLi), θ′(Al2Cu), and δ′(Al3Li) are the main age hardening precipitates of 2099 Al–Li alloy. It is hypothesized that the good corrosion susceptibility of alloy may be attributed to homogeneous coherent nanoscale precipitates.Reference Ahmad and Aleem24 Some reports indicate that precipitate features below a critical precipitate size can be tolerated from a corrosion perspective.Reference Ralston, Birbilis, Weyland and Hutchinson25–Reference Ralston, Birbilis, Cavanaugh, Weyland, Muddle and Marceau27 The area effect or the ratio of cathodic to anodic area is an important factor in galvanic corrosion. The smaller the cathode compared with the anode, the less oxygen reduction can occur and, hence, the less the galvanic current. These noble intermetallic precipitates also act as pit initiation sites. However, after detached intermetallic precipitates, the corrosion process tends to stabilize due to corrosion products on the surface of specimens providing a better protective oxide layer. Under this condition, the pits are too small to be clearly observed by SEM.
IV. CONCLUSIONS
In conclusion, the corrosion behavior of 2099 Al–Li alloy in NaCl aqueous solutions with different concentrations (1.5, 3.5, and 5.0%) has been investigated by using electrochemical measurements together with full immersion tests in this work. The following conclusions have been obtained from the present investigation.
The results showed that the 2099 Al–Li alloy possessed good corrosion resistance in NaCl aqueous solutions. Potentiodynamic tests proved that increase of chloride ion concentration is responsible for decrease of corrosion potential and polarization resistance, as well as increase of corrosion current density and alloy corrosion rate. Deterioration of corrosion properties with the increase of NaCl concentration was also confirmed by immersion test as well as surface topography test. The main form of corrosion failure was pitting corrosion. The impurities such as sulfides tend to accelerate the attack and lead to surface pitting. The oxide films that formed during the manufacturing process offer good resistance to corrosion. They are likely to suffer separation, cracking, and drop-off when immersed in aggressive NaCl aqueous solution. The noble nanoscale intermetallic precipitates also act as pit initiation sites. It is hypothesized that the good corrosion susceptibility of alloy may be attributed to homogeneous coherent nanoscale precipitates.