I. INTRODUCTION TO ENGINEERING OF GRAPHENE—DOPING
The vital aim of all chemical sensors is single atom/molecule level sensitivity, and such a level of sensitivity was far from the reach of practical sensors, including in solid state gas sensors. Reference Schedin, Geim, Morozov, Hill, Blake, Katsnelson and Novoselov1 The limitations for reaching such an extreme sensitivity was the thermal fluctuations of charges and defects in the sensing platform, leading to increased noise levels. Reference Kong, Franklin, Zhou, Chapline, Peng, Cho and Dai2,Reference Collins, Bradley, Ishigami and Zettl3 This intrinsic noise levels in a sensing platform can be circumvented by the use of low electronic noise systems such as graphene, where it combines the following exceptional properties to increase the signal to noise ratio: (i) a truly two-dimensional (2D) material where the whole volume is available (all the atoms are exposed) for interactions with the adsorbent or analyte, (ii) low Johnson–Nyquist noise due to its very high conductivity, (iii) low level crystals defects and hence low Flicker noises, and (iv) high precision conductivity measurements with low contact resistances are possible due to its large area, high crystallinity and low level defects. Reference Schedin, Geim, Morozov, Hill, Blake, Katsnelson and Novoselov1,Reference Novesolov4–Reference Zhang, Tan, Stormer and Kim6 These properties make graphene as a unique platform for single quanta (atom/molecule) detection of analyte to a level of monitoring the changes of its local carrier concentration by less than one electron charge with ultra low noises at room temperature. The operational principle of most of the graphene based sensors is the changes in the electrical conductivity due to the adsorbed molecules, where the molecules act as electron acceptors or donors. Further, all the above properties along with high carrier mobility of graphene bring exceptionally enhanced sensing possibilities. But, the experiments on pristine graphene demonstrating its ultra-high signal to noise ratio showing single molecule level detection is limited to only a few molecules such as NO2. It is also found to be unselective with weak adsorption of molecules, while it is found that introducing defects or active adsorption sites in graphene can improve its selectivity and sensitivity in the detection of molecules. Reference Schedin, Geim, Morozov, Hill, Blake, Katsnelson and Novoselov1,Reference Tadi, Pal and Narayanan7
Functional derivatives of graphene—graphene honeycomb lattice containing induced defects such as heteroatoms or adatoms, attached functional groups or adsorbed groups, size or shape engineered graphene structures inducing the dimensions dependent band gap variations and adsorption centers, and van der Waals stacked solids containing graphene are coined here as functional derivatives, are known to the research community for the long time and they are receiving tremendous scientific attention since after ground breaking research of graphene. Reference Krishna, Man, Vinod, Chin, Harada, Taha-Tijerina, Tiwary, Nguyen, Chang, Narayanan, Rubio, Ajayan, Talapatra and Dani8–Reference Galande, Gao, Mathkar, Dattelbaum, Narayanan, Mohite and Ajayan12 It is found that these functional derivatives can abruptly change the electronic properties and low temperature fluctuations in graphene depending upon the nature of the chemical modifications, and hence this can bring exotic properties such as localized magnetic moments, high electric polarization, low surface energy along with specificity in adsorption of molecules by tuning the interactions. Reference Sudeep, Vinayasree, Mohanan, Ajayan, Narayanan and Anantharaman13–Reference Tang and Cao16 Hence graphene can be chemically and/or structurally modified to tune its functionality, and henceforth its numerous applications. Moreover, graphene can be derived from graphite, an abundant material at the earth’s surface, make it as a potential candidate not only for basic studies but for practical applications such as electronic devices and chemical sensors too. Reference Feng, Long, Feng and Li17–Reference Yang, Sun, Alemany, Narayanan and Billups19
Pristine graphene is a semimetal having zero band gap which limits it applications. Reference Jaison, Narayanan, Prem Kumar and Pillai18 Tuning the band gap of graphene with heteroatoms has a clear edge over size/shape tunable band gap modification due to the large control over the dopants level and its reproducibility. Hydrogenation is a promising pathway to introduce band gap in graphene, and the resulting graphane (both sides hydrogenated)/graphone (one side hydrogenated) has potential applications in various fields. Reference Yang, Sun, Alemany, Narayanan and Billups19 Complete hydrogenation transforms sp 2 carbon to sp 3, resulting an insulator without π electrons. The other major heteroatoms sought after in graphene include boron (B), nitrogen (N), sulfur (S), phosphorus (P), and halogens such as fluorine (F), chlorine (Cl), bromine (Br), and Iodine (I). Halogenation of graphene results in sp 3 carbon similar to hydrogenation. Reference Poh, Šimek, Sofer and Pumera20 Out of various heteroatoms attempted, being a small and highly electronegative element, F has a clear edge over other halogens. Reference Mathkar, Narayanan, Alemany, Cox, Nguyen, Gao, Chang, Romero-Aburto, Mani and Ajayan21 Fluorination of graphene is found to be bringing many intriguing properties to the lattice, while the morphology of graphene retains the same. The changes in the properties after F incorporation include localized magnetic moments in graphene and hence make graphene as paramagnetic otherwise a diamagnetic material, enhance the dielectric properties, lower the surface energy of graphene to make it as superhydrophobic and extended oleophobic, induce large positive spin and charge densities to make graphene electrocatalytically active etc. and hence to make them enable for various applications. Reference Radhakrishnan, Samanta, Sudeep, Maldonado, Mani, Acharya, Tiwary, Singh and Ajayan22 Further, similar to the C/H ratio dependent electrical conductivity of graphane, conductivity of fluorographene is highly dependent on the C/F ratio and it can vary from 0 eV (pure graphene) to 3.4 eV (stoichiometric fluorographene), similar to hydrogenation from 0 eV to 4 eV. Reference Poh, Šimek, Sofer and Pumera20,Reference Mazanek, Jankovsky, Luxa, Sedmidubsky, Janousek, Sembera, Mikulics and Sofer23 But the changes in the other physico–chemical properties with fluorination is more drastic than hydrogenation, and hence need to be pursued more vigorously. Furthermore, it is studied that on the heterogeneous electron transfer (HET) kinetics of various halogenated graphene oxides, the electron transfer rates increases with the decrease in atomic number of the doped halogen (transfer rates track the following order, Cl-TRGO > Br-TRGO > I-TRGO) (where TRGO means thermally reduced graphene oxide). Reference Yang, Sun, Alemany, Narayanan and Billups19 But, in another report the HET rates obtained for RFGO (functional groups reduced fluorinated GO, chemically modified FG) was found to be ∼3.2 × 10⁻³ cm/s. Reference Boopathi, Narayanan and Senthil Kumar24 This value was found to be higher than that of report for Cl-TRGO (2.52 × 10⁻³ cm/s). Hence, atomic weight of the doped element in graphene also plays an important role in determining the resultant HET rates, and hence its applications in sensing.
II. FLUORINATION OF GRAPHENE—SYNTHESIS AND CONTROL OF FLUORINE
In the ‘nanoarchitectonics’ of graphene, highly reactive moieties such as halogens have a seminal role in controlling the physico–chemical properties and henceforth their applications. Reference Pan, Zhu and Mao25 Various attempts were made for the development of different halogenated graphenes’. Reference Poh, Šimek, Sofer and Pumera20,Reference Boopathi, Narayanan and Senthil Kumar24 Out of numerous methods, post-treatment of graphene in halogen atmosphere, thermal annealing of graphene oxide in the presence of iodine, UV irradiation of a few-layer graphene in Cl/Br solutions, Cl plasma treatment of graphene, thermal exfoliation and reduction of graphite oxide in halogen atmosphere etc. are to name a few. Reference Chang, Cheng, Liu, Gao, Li, Li, Tao, Ding and Zheng26–Reference Li, Zhou, Wu, Peng, Yan, Zhou and Liu28 The methods such as halogenation based on UV irradiation are noted for their reversible storage of chlorine or bromine in graphene materials where the halogen is freed from the material upon laser irradiation or thermal treatment. This leads to the large control over the doping level of halogens in graphene and hence controlling their physico-chemical properties. Further, different halogens doped graphenes’ also show variation in their properties, such as electrocatalytic properties, and hence the selection of halogen and its doping level are identified as important parameters.
Since 1934, organic as well as inorganic fluorocarbons are extensively researched in the literature due to their many ‘nonclassical’ properties, due to high C–F bond energies (90–115 kcal/mol, similar to C–C bond), such as increased stability toward hydrolysis and thermolysis, and inactivity with most reagents. Reference Mitkin29 Unlike classical fluoroorganic polymers those are synthesized via polymerization or polycondensation, inorganic polymers were synthesized using oxidative fluorination of organic polymers. These lead to development of fluorinated graphite and intercalated fluorographite compounds. Reference Mitkin29 The exotic properties and applications rendered by the fluorocarbons motivated researchers toward the synthesis and studies on fluorinated fullerenes and carbon nanotubes (CNTs), when they were discovered in the later years. Reference Kniaz, Fischer, Selig, Vaughan, Romanow, Cox, Chowdhury, McCauley, Strongin and Smith30,Reference Mickelson, Chiang, Zimmerman, Boul, Lozano, Liu, Smalley, Hauge and Margrave31
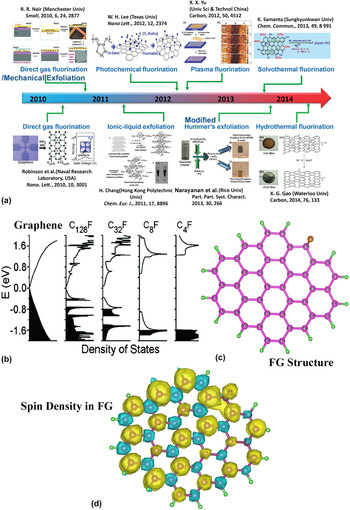
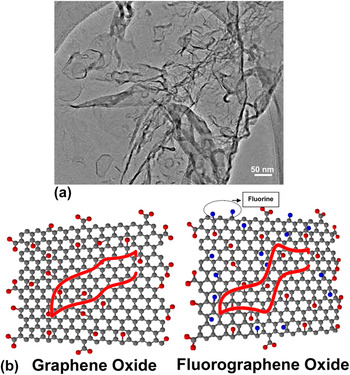
Fluorinated graphene (fluorographene, FG) was initially developed by Robinson et al. through the fluorination of graphene and then by Nair et al. via the mechanical exfoliation of graphite fluoride. Reference Robinson, Burgess, Junkermeier, Badescu, Reinecke, Perkins, Zalalutdniov, Baldwin, Culbertson, Sheehan and Snow32,Reference Nair, Ren, Jalil, Riaz, Kravets, Britnell, Blake, Schedin, Mayorov, Yuan, Katsnelson, Cheng, Strupinski, Bulusheva, Okotrub, Grigorieva, Grigorenko, Novoselov and Geim33 The mechanical exfoliation method is limited for the practical use of FG due to the constraints on the large scale production, and direct gas fluorination was successfully attempted over graphene followed by photochemical fluorination of graphene and ionic liquid based exfoliation of fluorographite resulting to the formation of FG with varied F content. Reference Chang, Cheng, Liu, Gao, Li, Li, Tao, Ding and Zheng26 A milestone in FG synthesis has happened with the development of fluorographene oxide having different F content via the direct oxidative exfoliation of fluorographite polymer. Reference Mathkar, Narayanan, Alemany, Cox, Nguyen, Gao, Chang, Romero-Aburto, Mani and Ajayan21 Fig. 1 shows the road map of synthesis and fabrication of FG and possible availabilities of adequate techniques for the large scale production. Figure 2 shows a transmission electron microscope (TEM) image and corresponding atomic models of FG, which indicates the 2D nature and ultra-thinness of FG. Large area single step catalyst free growth of FG is not realized yet and it is highly important for the designing of electronic devices and sensors. Researches on these aspects are intensely pursuing and authors are also working close to its reality.
(a) A roadmap of fluorographene development. (b) Calculated total density of states of single-side FG for several fluorine coverage. (c) The structure and (d) corresponding spin density mapping of FG—where yellow color represents positive spin density and blue color represents negative spin densities. Reference Feng, Long, Feng and Li17,Reference Vineesh, Nazrulla, Krishnamoorthy, Narayanan and Alwarappan36

(a) Low resolution TEM image of FG showing its sheet like morphology and ultra-thinness. (b) Structure comparison between GO and FGO. Presence of additional C–F bonds are shown in FGO. Presence of covalent C–F bonds is confirmed from 19F NMR analysis. More C–F bonds are found in the basal plane than at the edges. The schematic shows the enhancement in the electron transfer properties while using FGO for a reversible redox probe. Reference Boopathi, Narayanan and Senthil Kumar24

The F content or C/F ratio control is highly crucial in deciding the properties of FG. The variation in band gap upon different F content (from graphene to C4F) is studied via the density of states calculations, as shown in Fig. 1(b). Reference Feng, Long, Feng and Li17 In our report describing the development of fluorographene oxide [FGO, a structure comparison between graphene oxide (GO) and FGO is shown in Fig. 2] via oxidative exfoliation of fluorographite polymer, the water wetting properties of different amount of F containing FGO is demonstrated. Reference Mathkar, Narayanan, Alemany, Cox, Nguyen, Gao, Chang, Romero-Aburto, Mani and Ajayan21 Large F containing (∼23 at.% F) FGO is phase separated out from water (as shown in Fig. 1) though it contains considerable amount of oxygen functionalities. The molecular origin of hydrophobicity in highly polar C–F bond containing materials is highly intriguing (unlike C–Cl bonds), and this was suggested due to the fatness of C–F bonds. Reference Dalvi and Rossky34 It was stated that low level inhomogeneous F on graphene can induce partial positive surfaces on graphene and it can prevent thromboembolism. Reference Sudeep, Vinayasree, Mohanan, Ajayan, Narayanan and Anantharaman13 Further, F doping can greatly enhance the lipophilicity of the drug carrier, an important criterion while designing in vivo drug carrier platforms. Reference Sudeep, Vinayasree, Mohanan, Ajayan, Narayanan and Anantharaman13 FGO is also shown to be promising for ultra-sound imaging and MRI contrast enhancement due to its paramagnetic centers (first carbons based nanoparticle free contrast enhancement agent) Reference Hu35 along with its capability of carrying drug molecules due to the presence of oxygen functionalities. Further, electrocatalytic studies on FGO and FG show that F centers drastically change the spin and charge density distributions in graphene and C–F bond can make graphene as electrocatalytically active toward various reactions [Figs. 1(c) and 1(d)showing the spin density distribution of FG]. Reference Vineesh, Nazrulla, Krishnamoorthy, Narayanan and Alwarappan36 But, the large amount of F can convert graphene to an insulator (Fig. 1), adversely affecting the charge transfer properties. Hence the control of F is not only important in catalysis but also found to be very crucial in impedimetric and conductometric sensors. So the development of different methods for controlled fluorination of graphene or controlled defluorination (removal of C–F bonds) of FG/FGO is important for the use of FG based sensing platforms.
Recently, it is reported that the concentration of F in FG/FGO can be decreased by the post-synthesis routes such as electron beam irradiation, hydrothermal, and ultrasonic treatments. Reference Philipp, Daniel, Thomas, Julio, Esteban, Shannon, Stephan, Matthias, Volckmar, Christian, Michael, Markus and Rainer37–Reference Tadi, Bikkarolla, Bhorkar, Pal, Kunchur, Indulekh, Radhakrishnan, Biroju and Narayanan40 It is also shown that the defluorination can be achieved by exposing FG to ultraviolet irradiation for long time in aromatic solvents like toluene and benzene. Reference Mazanek, Jankovsky, Luxa, Sedmidubsky, Janousek, Sembera, Mikulics and Sofer23,Reference Wang, Wang, Liu, Ren, Xiao and Liu41 On a different report, the possibilities of defluorination by the solvent based treatment of fluorinated graphene is also discussed, where the semi-ionic C–F bonds were removed from fluorinated graphene upon its treatment with dipolar solvents such as N-methyl-2-pyrrolidinone (NMP) via ultra-sonication. Reference Mazanek, Jankovsky, Luxa, Sedmidubsky, Janousek, Sembera, Mikulics and Sofer23 Recently, the authors have demonstrated that the interactions between polar solvents and C–F bond in FG are highly crucial for the solvent assisted defluorination, and even moderately polar solvents such as tetrahydrofuran (THF) can interact with FGO to remove C–F bonds in a day or two without any extensive sonication. Reference Tadi, Bikkarolla, Bhorkar, Pal, Kunchur, Indulekh, Radhakrishnan, Biroju and Narayanan40 This method also proves that other oxygen functionalities are kept intact even after 30 days of THF treatment indicating that the reaction is quite selective. Hence this can be considered as an important step toward the development of controllably fluorinated graphene/graphene oxide based devices and sensors.
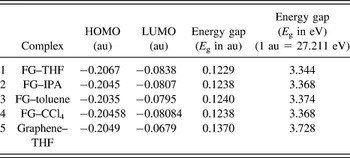
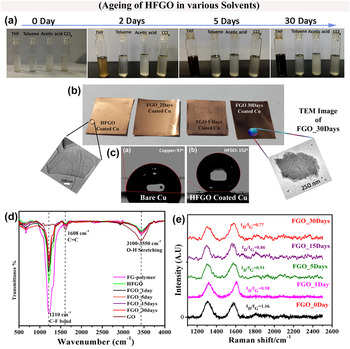
To study the interactions between FG and various solvents such as THF, toluene, isopropyl alcohol (IPA), and carbon tetrachloride (CCl4), DFT studies were conducted. The energy gaps (E g) of the complexes were determined from the energy difference between highest occupied molecular orbital (HOMO) and lowest unoccupied molecular orbital (LUMO), which give the direct measure of interactions. As shown in Table I, the least energy gap is found to be in the case of THF among other solvents. This indicates that THF has a strong interaction with FG making the energy differences between HOMO and LUMO smaller. It is further noted that the energy gap of THF–graphene is higher than THF–FG, indicating that the C–F makes THF more interactive in FG. This corroborates with the experimental findings given in Fig. 3. The FGO in various solvents upon aging shows a change in color only in THF. In THF, it completely changes its color from whitish (large F content) to black (low F content). This has further shown in the FGO coated copper films, as shown in Fig. 3(b). The FGO is found to be making a superhydrophobic coating over the copper (as evident from the contact angle measurements where it has a contact angle above 150°), another important factor (wettability of the analyte) need to be taken considered while designing chemical sensors. The changes in the C–F vibration intensity upon aging (defluorination) is shown in the Fourier transform infrared spectra (FTIR) as shown in Fig. 3(d) and I D/I G ratio changes in different aged FGO samples show that partial recovery of the sp 2 carbon is occurring while getting defluorinated since the ratio is decreasing upon aging [Fig. 3(e)].
HOMO–LUMO gaps for various solvents with FG and graphene, calculated using density functional theory. Reference Tadi, Bikkarolla, Bhorkar, Pal, Kunchur, Indulekh, Radhakrishnan, Biroju and Narayanan40

(a) Photographs of HFGO treated various solvents and their aging, (b) FGO coated copper foils (inset: TEM images of a few layered HFGO (without any treatment) and FGO_30 days. The TEM images show that there is no structural change after the solvent (THF) treatment and defluorination.), (c) WCA of copper foil and HFGO showing their hydrophobicity and superhydrophobicity (d) FTIR spectra of FGOs and GO, (e) normalized Raman spectra of FGOs (excitation ∼633 nm). Reference Tadi, Bikkarolla, Bhorkar, Pal, Kunchur, Indulekh, Radhakrishnan, Biroju and Narayanan40

Hence it can be inferred from the above discussions that there are techniques available for the large scale synthesis of FG/FGO and controllability in the F content can also be achieved by tuning the reaction time with the fluorine precursors or changing the nature of precursor or by post-treatment methods. The exact F content and nature of F in the samples need to be verified using techniques such as X-ray photoelectron spectroscopy (XPS) and 19F NMR studies. Otherwise, there are techniques reported for the controlled defluorination of FG/FGO via post-treatment methods such as electron beam irradiation, solvent assisted defluorination etc.
III. FLUOROGRAPHENE AS A SENSING PLATFORM
FG or its other functional derivatives such as FGO and other elements co-doped FG are reported for their sensing applications. Reference Tadi, Pal and Narayanan7,Reference Urbanova, Karlicky, Matej, Sembera, Janousek, Perman, Ranc, Cepe, Michl, Otyepka and Zboril42 The main advantage of FG for sensing is its high electrocatalytic activity and hence augmented electron transfer, and its specificity toward certain analyte due to the presence of C–F bonds. It is also reported that the highly electronegative fluorine bound to the graphene scaffold would affect the surface properties and sensing performance for various analytes and biomarkers. Reference Boopathi, Narayanan and Senthil Kumar24 It is also found that low fluorinated graphene exhibits excellent sensing properties for all the studied biomolecules, outperforming pristine graphene, thus opening new possibilities for biosensing applications. The low F content will augment the electron transfer from electrode to bio-molecule or vice versa, will not affect much the electrical conductivity of graphene and also wetting properties of graphene. The mostly studied biologically important molecules include, ionized (NH4 +), unionized ammonia (NH3), and gaseous NH3, nicotinamide adenine dinucleotide (NADH), ascorbic acid (AA), uric acid (UA), and dopamine (DA). Reference Urbanova, Karlicky, Matej, Sembera, Janousek, Perman, Ranc, Cepe, Michl, Otyepka and Zboril42
NADH electrochemical oxidation has enormous interest since the effective regeneration of NADH/NAD+ system plays a crucial role in many key biosynthesis reactions, organic chemistry and also as cofactors of large number of enzymes, mostly dehydrogenes. Due to the importance of an efficient NAD+/NADH recycling in dehydrogenase-based devices, namely biofuel cells and bioreactors, efficient NADH detection is receiving attention. One of the key challenges in the electrochemical regeneration of NAD+ is its high overpotential due to slow kinetics when conventional electrodes were used. Various strategies were attempted to overcome this limitation which include electrode modification by redox mediators such as phenothiazine or phenoxazine derivatives, quinones, or diaphorase enzymes, and also the use of different nanomaterials based electrodes such as pyrolytic graphite, carbon nanotubes, and graphene oxide etc.
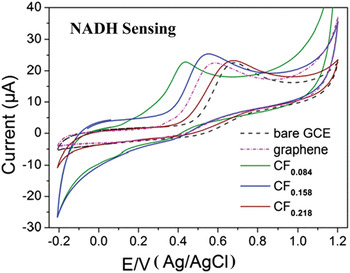
It can be seen from Fig. 4 that the well-defined oxidation peaks of NADH are shifted with the use of different electrodes. The peak potential for NADH oxidation in glassy carbon electrode (GCE) is at ∼0.4 V (versus Ag/AgCl) has been shifted close to 0 V (versus Ag/AgCl) when it is modified with CF0.084. The higher F content FGs (CF0.218 and CF0.158) have better onset potential than that of GCE but the current is drastically reduced and hence it may be becoming more insulating with large content of F. On the other hand, low F content sample has high electrocatalytic activities (better than graphene) with considerably large current indicating the importance of F in graphene lattice for this particular reaction.
CVs of 2.5 mM/L NADH at GCEs modified by fluorographene samples: CF0.084 (green line), CF0.158 (blue line), and CF0.218 (brown line). Responses of the GCE modified by pristine graphene (dashed-dotted magenta line) and bare GCE (dashed black line) are also shown. All measurements were performed in 0.1 M/L PBS, pH 7.0 at a scan rate of 100 mV/s. Reference Urbanova, Karlicky, Matej, Sembera, Janousek, Perman, Ranc, Cepe, Michl, Otyepka and Zboril42

The DFT studies were reported for understanding the electron transfer processes happening in different electrodes in various reactions. It is found that the adsorption of biomolecules at fully fluorinated graphene (C1F1) was weaker in the cases of biomolecules such as NADH, DA, AA etc. than that on pristine graphene. In the case of homogeneously partially fluorinated graphenes’, the adsorption energy is reported to be drastically increased with decreasing number of fluorine atoms. But the adsorption energies of biomolecules (NADH, DA, and AA) to the sample with the lowest fluorine coverage (CF0.082) are higher than those calculated for pristine graphene. Further, it is proposed that mechanism behind the higher adsorption energies in weakly fluorinated graphene can be due to the combination of π–π stacking interactions from the graphene regions and hydrogen bonding interaction from the fluorine. Thus different adsorption energies together with electrical conductivity matters in the charge transfer process and the detection efficiency of these molecules differ while using different FG modified electrodes. Reference Urbanova, Karlicky, Matej, Sembera, Janousek, Perman, Ranc, Cepe, Michl, Otyepka and Zboril42
An important neurotransmitter like dopamine (DA) and its coexistent analyte ascorbic acid (AA) are other vital biomolecules those are need to be monitored. Decrease in the DA level may cause neurological imbalance and its deficiency can result in Parkinson’s disease. The detection of DA is always challenging due to its physiological concentration is in the range of ∼0.01 μM, which is considerably low for detection, and the interference originating from the coexisting analyte like AA and UA makes the detection of DA quite challenging. Reference Valappil, Alwarappan and Narayanan43 Electrochemical methods are often preferred for DA detection due to its electrochemical activeness. Hence to avoid the interference from AA and UA during the detection, sensitive electrodes of suitable materials are need to be used. But, the electro-oxidation of these biologically important molecules using graphene electrodes are found to be dependent on the alignment of graphene electrodes and the nature of functional groups present on graphene surfaces.
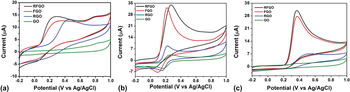
AA oxidation is a chemically irreversible reaction, and the electrode kinetics mainly depend upon the oxidation potential. Figure 5(a) shows that (where four different graphene based electrodes are used) the AA oxidation is fully hindered in GO electrode, and it can be due to the electrostatic repulsion between oxygenated functional groups in GO and negatively charged AA molecule. In the case of RGO, AA oxidation is clear and anodic peak current start at ∼0.2 V, indicating that hydrazine reduction of GO used in that work effectively removes the oxygenated functional groups. But, the FGO electrode shows lower over potential with anodic peak current starting at 0.0 V, indicating a fast electron transfer kinetics even with the presence of oxygen containing functional groups. In the case of reduced FGO (RFGO), AA oxidation peak starts at 0.0 V and small peak current (2 mA) enhancement is observed in comparison to FGO electrode. AA oxidation is a surface sensitive electrochemical reaction, and it also depends on the density of electronic states near the formal potential. But unlike in the case of AA, DA oxidation peak is noticeable at even GO surface as shown in Fig. 5(b). This is due to the electrostatic attraction between negatively charged GO surface and positively charged DA in PBS solution. RGO shows a lower DA oxidation potential (0.1 V) than GO and a higher peak current (10 mA). But in FGO, superior catalytic activity was observed for DA oxidation both in term of less anodic over potential (0.05 V) with 3.3 times (33 mA) higher current than GO surface. Similar to the case of AA oxidation, DA oxidation at RFGO surface was not much affected in terms of oxidation potential and peak current in comparison to FGO electrode. But it is well established that DA is less sensitive to the surface oxygen functional groups on graphene surface and hence this study indirectly reveals that F doping in graphene can have a prominent role in altering the density of electronic states near Fermi level too. UA oxidation on different electrodes are also shown in Fig. 5(c). UA is a negatively charged one similar to AA and hence no characteristic oxidation behavior is observed in GO electrode. In the case of FGO surface, UA oxidation peak starts at 0.208 V with 4.5 times higher current than RGO. This also confirms that the surface of FGO has higher catalytic nature than GO and RGO (chemically modified graphene). Reference Boopathi, Narayanan and Senthil Kumar24
CVs obtained in various materials modified GCE surfaces in PBS (pH 7.4) containing (a) 1 mM AA, (b) 1 mM DA, (c) 1 mM UA solutions at a scan rate of 0.1 V/s. Reference Boopathi, Narayanan and Senthil Kumar24

Ammonia is another analyte studied for FG based sensing. Reference Tadi, Pal and Narayanan7 Various sensing methods are existing for ammonia due to its importance in diverse industrial and biological processes, and also due to its natural and industrial origin. Low dosages of ammonia can cause problems to human respiratory, skin, eyes etc., and its prolonged exposure can lead to pulmonary oedema, a situation of fluid accumulation in the tissues and air spaces of the lungs. Since ammonia is also excreted from the body in the form of urea, breathe ammonia measurement (measuring the quantity in the exhaled gas) can be a diagnostic tool for monitoring the function of kidney or ulcers caused by Helicobacter pylori bacterial stomach infection. Apart from the ammonia gas sensors, ammonia (ionized/un-ionized) levels in the blood are also of interest in medicine. Blood ammonia monitoring has of interests in sports (0.1–10 ppm) medicines and also in pediatrics (>100 µM/L). Blood NH3 concentrations are normally below 35 μM/L, maintaining this low level concentration is as important as ammonia is neurotoxic at higher concentrations. Excessive cerebral ammonia uptake in hyperammonemic states can lead to glutamine accumulation and cerebral edema, which is important in the pathogenesis of hepatic encephalopathy.
Some of the existing ammonia sensing platforms are: metal oxide based sensors where the conductance change due to the chemisorptions of gas molecule is monitored, catalytic ammonia sensors by the catalytic activity of certain metals toward ammonia gas and the ammonia concentration dependency in their charge carriers, conducting polymer based ammonia sensors where a 2-fold oxidation-reduction mechanism is used for quantification of ammonia, optical and spectrometric ammonia detection where the coloration upon ammonia exposure is used as a measure, and gas permeable membranes based selective detection techniques. These frequently used methods lack the desirable selective, sensitive, cost effective, and fast sensing platform. For example, a clinical ammonia sensor necessitates the above mentioned features along with a low limit of detection value of ∼50 ppb with a fast response time. The existing selective fast optical methods for ammonia are inadequate for the development of a portable ammonia sensors where limited sample needs to be detected using economically viable routes. Hence graphene based platforms were searched for ammonia sensing. Reference Tadi, Pal and Narayanan7
DFT calculations were conducted to study the interactions between GO and ammonia. Reference Tang and Cao16 It is found that adsorption of ammonia on GO is stronger than that in graphene due to the presence of oxygen containing functional groups such as hydroxyl and epoxy—where formation hydrogen bonding with ammonia will lead to a charge transfer process. But GO is known for its poor stability and structural variation depending upon the synthesis protocols. Hence low thermal stability, instability of GO under long exposure of ammonia (where it can be reduced), and difficulties in controlling the extend of oxidation limit the use of GO as a sensing platform for ammonia. Above all, GO is an electrical insulator and its electrochemically activity is also poor. In another report, RGO based conductometric ammonia sensor was discussed with a limit of detection ∼200 ppm. The detection mechanism of RGO sensor is exactly same as that in GO with an enhanced electrical conduction platform due to the reduction of functional groups, and hence RGO is also not a recommendable sensing platform for ammonia. Hydrogen bonding possibilities of ammonia with other thermally and chemically stable functional groups of other functional derivative of graphene is a viable option for graphene based ammonia sensor. In this possibility, hydrogen bonding (hydrogen in ammonia) with the most electronegative element fluorine (F) will be ideal, and hence FG with optimum fluorine content is proposed for the detection of ammonia with very high sensitivity. Reference Tadi, Pal and Narayanan7
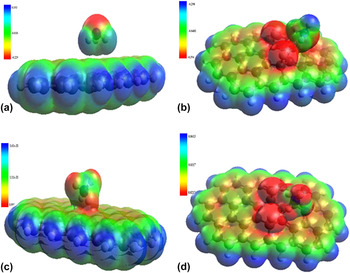
DFT studies were conducted to identify the interactions between graphene and FG [∼5 atomic F% (C39H16F2)] with both ammonia and ammonium. Optimized individual structures and electrostatic interactions between ammonia/NH4 + and graphene/FG were calculated from HOMO and LUMO energies of the corresponding stabilized complexes. The calculated energy gaps show that the gap between NH3/NH4 + and FG is less than that of NH3/NH4 + and graphene. This is due to the strong interactions of NH3 or NH4 + with FG, making the energy differences between HOMO and LUMO much smaller. The electrostatic potential maps of the interactions plotted in Fig. 6 and it can be seen that the positive charged 1s orbital of hydrogen on NH3/NH4 + has strong electrostatic interaction with negatively charged 2p orbital of F in FG, leading to a site specific hydrogen bonding (electrostatic) interaction. The electrostatic potential maps show considerable orbital overlapping of NH3 and NH4 + with FG, while almost no interaction between NH3 and graphene. But NH4 + shows a better interaction with graphene possibly due to its positive charge.
Electrostatic potential plots for (a) graphene–ammonia, (b) FG–ammonia, (c) graphene–ammonium, and (d) FG–ammonium. Reference Tadi, Pal and Narayanan7

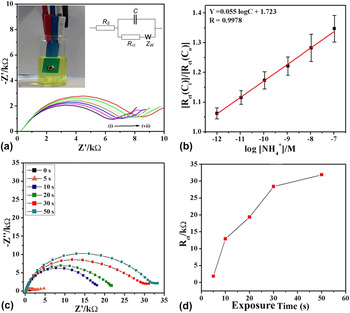
The efficacy of the FGO modified electrodes in ammonia sensing was experimentally also tested. An impedimetric platform was used to test the efficiency of FGO modified electrodes via a three-electrode electrochemical sensing platform. It was found that FGO has a very high sensitivity toward ammonia and the limit of detection is as small as ∼0.4 pM with a linearity in detection over a wide range of concentrations (1 pM–0.1 μM) (Fig. 7).
(a) Nyquist plots of FG coated electrode on screen printed electrode sensor for varying ammonium ion (NH4 +) concentrations [(i) blank, (ii) 1 pM, (iii) 10 pM, (iv) 100 pM, (v) 1 nM, (vi) 10 nM, and (vii) 0.1 μM], (inset) the photograph of an FG coated screen printed sensor, (b) normalized charge transfer resistance for various ammonium ion concentrations, (c) Nyquist plots showing increased impedance with increase in direct NH3 exposing time, (d) R ct values with varying direct NH3 exposures. Reference Tadi, Pal and Narayanan7

Further, it is also interesting to note the reversibility of this sensor, where a simple washing is found to be reversing the impedance back to its original value, indicating that no strong chemical bond formation is happening between ammonia and FG based electrode. But interestingly when this study was extended to ∼24 at.% F containing graphene (C39H16F12), it is found that the interactions between highly fluorinated FG and NH3 is weaker than that of low fluorinated FG. Impedimetric sensing studies also show that higher F containing FGO has no sensing property with the required qualities of a sensor such as linearity. Another notable advantage of chemically derived FG/FGO or ultra-thin sheets of FGO/FG is their amenability in making printable or paintable or patternable sensors and electrodes. It was also shown that FGO based large area sensor electrodes can be developed using simple techniques such as soft-lithography. Reference Tadi, Pal and Narayanan7
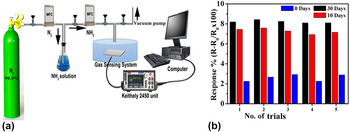
Recently, it has also shown that ammonia gas can be detected using FG by conductivity measurements (conductometric sensor) (Fig. 8). Reference Tadi, Bikkarolla, Bhorkar, Pal, Kunchur, Indulekh, Radhakrishnan, Biroju and Narayanan40
(a) Ammonia gas sensing set up where the gas flow can be accurately controlled (conductometric sensor). (b) Response variation for different fluorine containing FGOs. 30 days has minimum FGO while 0 days has maximum. The number of days show the days of aging in THF solution. Reference Tadi, Bikkarolla, Bhorkar, Pal, Kunchur, Indulekh, Radhakrishnan, Biroju and Narayanan40

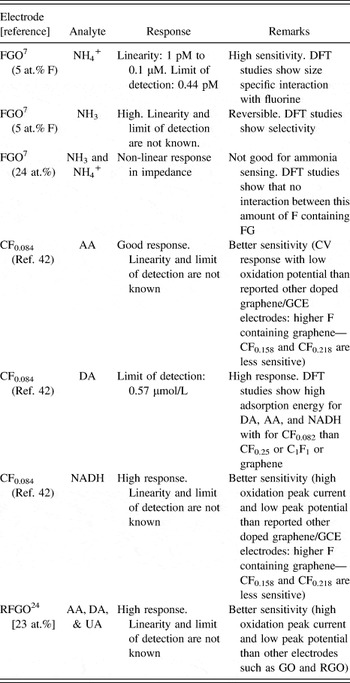
It is found that the solvent assisted interactions can reduce the F content in FGO, and this has a significant role in the response of the FG based conductometric sensor. Low F containing sample (30 days treated FGO) has the highest response indicating that changes in the conductivity (along with adsorption properties as observed from the DFT studies) of FGO upon defluorination and its effects in the sensing response. Table II summarizes various analytes and FG electrodes reported for molecular sensing applications.
Various analytes sensing using FG electrodes.

There are many other biologically important analytes such as serum glucose, cholesterol, triglyceride, glycated hemoglobin etc., where their monitoring is valuable in the management of diabetes and cardiovascular diseases. Reference Viswanathan, Narayanan, Aran, Fink, Paredes, Ajayan, Filipek, Miszta, Tekin, Inci, Demirci, Li, Bolotin, Liepmann and Renugopalakrishanan44 Graphene based point-of-care devices are developed for some of these enzymatic and nonenzymatic analyte sensing, and it is found that direct electron transfer to graphene is possible through proper functionalization of enzyme over graphene. It is also found that biomolecule (analyte)–graphene interfaces play a crucial role in deciding the functionality of such a sensor after analyte immobilization, and a lot more need to be studied on their interfaces and role of other entities such as water molecule is need to be unraveled. Reference Tadi, Narayanan, Arepalli, Banerjee, Viswanathan, Liepmann, Ajayan and Renugopalakrishnan45 On this context, little progress has been undergone with FG or FGO based biomolecular interfaces. It will be interesting to look in to this aspect since FG is reported as hydrophobic in nature and hence hydrogen in water cannot be bonded with FG (beyond DFT based calculations are needed). FG containing optimum amount of F may be an ideal platform for some of these bio-sensing applications, and bioanalyte–FG interfaces will be more fascinating to investigate due to the presence of intriguing C–F bonds in FG.
IV. CONCLUSION
Fluorination of graphene brings many exotic and desirable properties to graphene honeycomb lattice. The F doping can drastically affect the spin and charge density distributions in graphene and hence the charge transfer kinetics in FG based electrodes are getting augmented in comparison to that of pristine graphene. This opens the possibilities of FG/FGO based electrochemical sensors for various analytes, and it is established that FG/FGO has better sensitivity in electrochemical detection in the cases almost all tested analytes or bio-molecules than graphene/GO. But the fluorination makes sp 2 carbon in graphene to sp 3, thereby affecting the electronic conductivity of graphene, and hence controlling and optimizing F content are important while developing FG based sensors. Moreover, wettability of graphene with the analyte can also get altered with F content, and hence it needs to be optimized when FG based sensors are proposed for biomolecular sensing. The C–F bond can bring specificity in the interactions such as it is shown for ammonia. But, the interactions between FG and biomolecules can be drastically modified with higher amount of F, and it is reviewed that larger fluorine on graphene may destabilizes the molecules and hence weakening the interactions between molecules and graphene. Present investigations on FG/FGO based biosensors are found to be limited to a very few molecules. Recent developments in the FG synthesis and the control over the fluorination or defluorination of FG propose FG as a futuristic sensing platform for other biologically important molecules, proteins, and enzymes. But, as in the case of other nanomaterials such as graphene, biomolecule–FG interfaces need to be subjected to a detailed study, and the factors affecting these interfaces such as water, molecular alignment etc. Reference Viswanathan, Narayanan, Aran, Fink, Paredes, Ajayan, Filipek, Miszta, Tekin, Inci, Demirci, Li, Bolotin, Liepmann and Renugopalakrishanan44 are need to be studied for the development of FG based biosensors and point-of-care devices.
ACKNOWLEDGMENTS
TNN and RKB thank TIFR-Centre for Interdisciplinary Sciences, Tata Institute of Fundamental Research, Hyderabad, India for the financial support. Research at BCH and NEU are supported by endowments and NIH.