INTRODUCTION
Since the discovery of rapid cosmic-ray events (e.g. Miyake et al. 2012, Reference Miyake, Masuda and Nakamura2013; Jull et al. Reference Jull, Panyushkina, Lange, Kukarskih, Myglan, Clark, Salzer, Burr and Leavitt2014; Güttler et al. Reference Güttler, Adolphi, Beer, Bleicher, Boswijk, Christl, Hogg, Palmer, Vockenhuber, Wacker and Wunder2015; Rakowski et al. Reference Rakowski, Krąpiec, Huels, Pawlyta, Dreves and Meadows2015; Fogtmann-Schulz et al. Reference Fogtmann-Schulz, Østbø, Nielsen, Olsen, Karoff and Knudsen2017; Wang et al. Reference Wang, Yu, Zou, Dai and Cheng2017), interest in high-precision annual radiocarbon (14C) records has grown rapidly (e.g. Dee and Pope Reference Dee and Pope2016). This interest highlights a need for updating the international radiocarbon calibration curve with new annual 14C data. Most annual 14C records are based on radiocarbon analysis of whole-ring samples, but a few studies have used sub-annual fractions, such as the late-wood fraction, to reconstruct past atmospheric 14C levels (e.g. Miyahara et al. Reference Miyahara, Masuda, Muraki, Kitagawa and Nakamura2006; Beramendi-Orosco et al. Reference Beramendi-Orosco, Gonzalez-Hernandez, Villanueva-Diaz, Santos-Arevalo, Gomez-Martinez, Cienfuegos-Alvarado, Morales-Puente and Urrutia-Fucugauchi2010). However, even fewer studies have measured the 14C content of both early-wood (EW) and late-wood (LW) fractions in an attempt to study sub-annual variations (Olsson and Possnert Reference Olsson and Possnert1992; Rakowski et al. Reference Rakowski, Nakamura, Pazdur and Meadows2013; Xu et al. Reference Xu, Cook, Cresswell, Dunbar, Freeman, Hastie, Hou, Jacobsson, Naysmith and Sanderson2015; Fogtmann-Schulz et al. Reference Fogtmann-Schulz, Østbø, Nielsen, Olsen, Karoff and Knudsen2017). The origin and relative age of 14C in EW therefore remain poorly understood, which limits the potential for resolving sub-annual variations in past atmospheric 14C levels.
Trees in temperate regions grow by producing annual tree rings, which are composed of an EW and a LW component. In the start of the growing season (spring and early summer), EW is produced from a reserve stored in the tree from the previous growing season (Pilcher Reference Pilcher1995; Speer Reference Speer2010). EW is succeeded by LW, which is produced in the late summer (Speer Reference Speer2010). Hence, one could expect that the EW fraction contains a significant amount of radiocarbon atoms from the previous year, i.e. carbon representing a different year than the growth year.
In a study by Olsson and Possnert (Reference Olsson and Possnert1992), EW and LW fractions were measured separately for the period 1938–1981 CE. This study indicated that incorporation of radiocarbon from the previous year in EW may occur, but no systematic differences between 14C in α-cellulose extracted from EW and LW could be detected. Some studies, however, suggest that it might be possible to resolve sub-annual changes in the atmospheric 14C level by measuring both components (Rakowski et al. Reference Rakowski, Nakamura, Pazdur and Meadows2013; Xu et al. Reference Xu, Cook, Cresswell, Dunbar, Freeman, Hastie, Hou, Jacobsson, Naysmith and Sanderson2015; Fogtmann-Schulz et al. Reference Fogtmann-Schulz, Østbø, Nielsen, Olsen, Karoff and Knudsen2017). Data published by Xu et al. (Reference Xu, Cook, Cresswell, Dunbar, Freeman, Hastie, Hou, Jacobsson, Naysmith and Sanderson2015) (cedar tree) and Rakowski et al. (Reference Rakowski, Nakamura, Pazdur and Meadows2013) (pine tree) indicate that EW and LW record sub-annual 14C variations in the atmosphere. Both of these records, however, cover a period (1986–2007 CE [Rakowski et al. Reference Rakowski, Nakamura, Pazdur and Meadows2013] and 1984–2013 CE [Xu et al. Reference Xu, Cook, Cresswell, Dunbar, Freeman, Hastie, Hou, Jacobsson, Naysmith and Sanderson2015], respectively) where the anomalously high atmospheric 14C content has leveled off following the peak in 1964 CE caused by the nuclear weapon tests (Hua et al. Reference Hua, Barbetti and Rakowski2013). The differences between EW and LW are therefore difficult to ascertain with the available tree-ring data, and new sub-annual 14C records across the bomb pulse are needed to investigate differences between 14C in EW and LW. The available monthly atmospheric 14C concentrations across the bomb pulse (Hua et al. Reference Hua, Barbetti and Rakowski2013) make it possible to investigate the relationship between the atmospheric 14C concentration and sub-annual 14C data from tree rings.
To investigate whether EW contains a significant amount of radiocarbon from the previous growth year, we measure the radiocarbon content of EW and LW in Danish oak covering the bomb peak. We calculate the time of 14C incorporation from the atmosphere of the two tree components by performing a lagged least-squares analysis of the monthly atmospheric 14C content in the Northern Hemisphere zone 1 (Hua et al. Reference Hua, Barbetti and Rakowski2013) and the newly produced sub-annual 14C dataset from Denmark. The same analysis is also performed on the sub-annual 14C data published by Olsson and Possnert (Reference Olsson and Possnert1992) to investigate if the lag is consistent between the two tree-ring records from Scandinavian oak.
METHODS
Oak tree samples (Quercus sp.) from Risskov in Eastern Jutland, Denmark, were collected and dendrochronologically dated by the tree-ring laboratory Wormianum, Jelshøjvænget 29, DK-8270 Højbjerg, Denmark. The piece of wood, which covers the period 1954–1970 CE, was separated into EW and LW fractions, and α-cellulose was extracted from both fractions using the method proposed by Southon and Magana (Reference Southon and Magana2010) with some modifications. The wood samples were first bleached at 70°C with 1M sodium chlorite (NaClO2) acidified with 1M hydrochloric acid (HCl), then treated at room temperature with 17% sodium hydroxide (NaOH) to dissolve hemicellulose. Lastly, they were treated with 1M hydrochloric acid at room temperature to remove any contamination associated with atmospheric CO2.
After extraction, the α-cellulose was sealed in glass tubes containing copper oxide (CuO) and combusted to CO2 at 900°C, cryogenically purified, and then reduced to graphite using hydrogen and iron as catalysts. All samples were analyzed in the 1MV accelerator mass spectrometer (AMS) system from High Voltage Engineering at the Aarhus AMS Centre (AARAMS), Aarhus University, Denmark (Olsen et al. Reference Olsen, Tikhomirov, Grosen, Heinemeier and Klein2017). Radiocarbon values are provided as fraction modern, F14C, and are fractionation corrected using online δ13CAMS (Reimer et al. Reference Reimer, Brown and Reimer2004).
RESULTS AND DISCUSSION
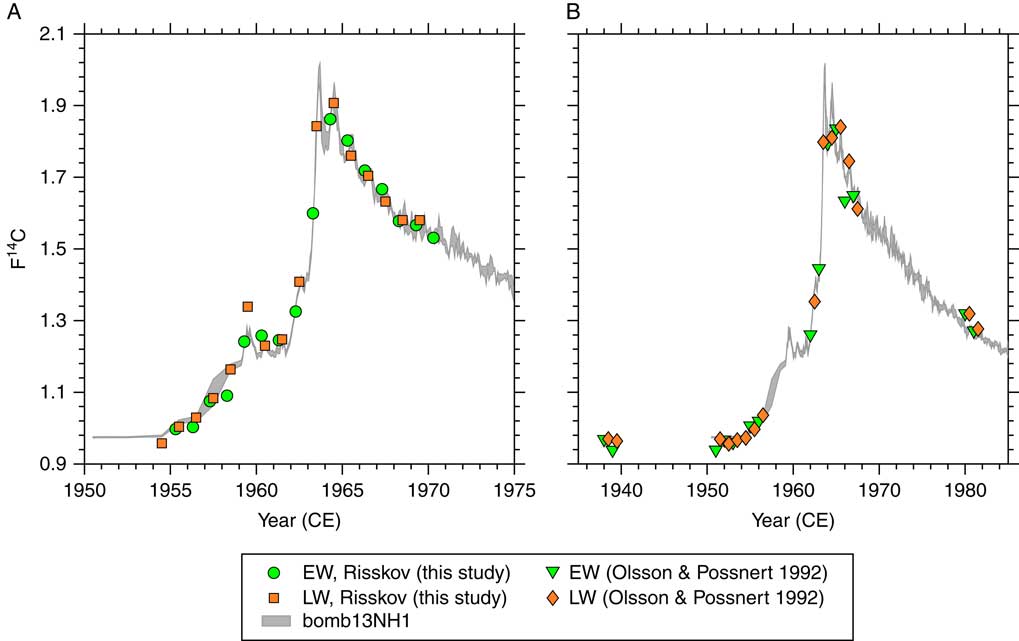
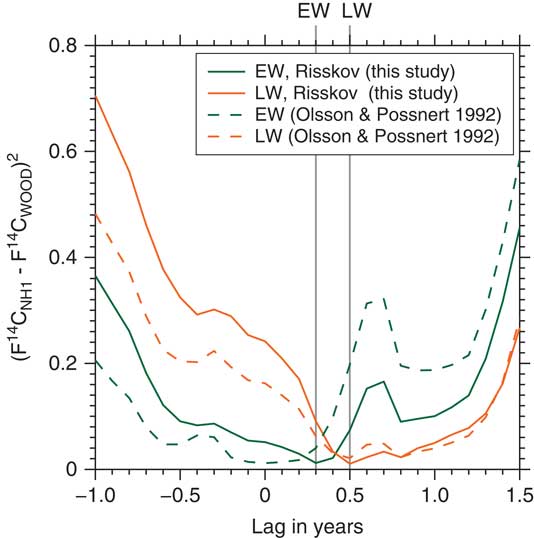
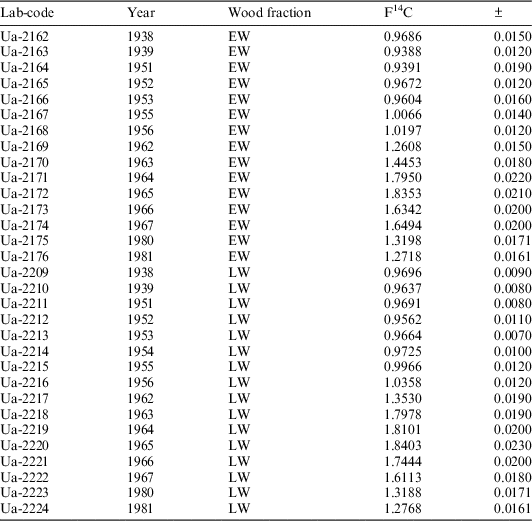
The measured F14C values (Figure 1A; Table 1) cover the period 1954–1970 CE and range between 0.9573±0.0049 and 1.9072±0.0048. The highest value is recorded in the LW fraction from 1965 CE, one year after the atmospheric 14C concentration peaked. To find the optimal fit between the new 14C data and the monthly atmospheric radiocarbon calibration curve (bombNH1) proposed by Hua et al. (Reference Hua, Barbetti and Rakowski2013), lagged squared distances between EW and LW relative to the bombNH1 record were calculated (Figure 2). The lagged squared distances are obtained by displacing the tree-ring curves in monthly steps between –1 and +1.5 years relative to January of the corresponding calendar year, and then calculating the summed squared difference between the 14C measurements and the calibration curve (bombNH1) for each of the monthly steps. The LW fraction shows a minimum in the lagged squared distance for a lag of 0.5 years, suggesting that this fraction predominantly contains carbon from June-July (coinciding with the time of growth of Danish cereals (Tauber Reference Tauber1960)). The lagged squared distance further shows that low values extend to 0.8 years (September–October) corresponding well with an expected growth period from mid-summer to early autumn of Danish oak (Ladefoged Reference Ladefoged1952; Schweingruber Reference Schweingruber1988). The EW fraction shows a minimum in lagged squared distance values for lags around 0.3–0.4 years (March–May), suggesting that the EW carbon predominantly originates from the period late March to early May (Figure 2). Hence, the EW and LW data are shifted by 0.3 years and 0.5 years, respectively (Figure 1A). The annual cycle in the atmospheric CO2 concentration due to photosynthetic CO2 uptake during Northern Hemisphere summers results in an annual cycle of 4–7‰ in the atmospheric Δ14C (Graven et al. Reference Graven, Guilderson and Keeling2012). To test the effect of this annual cycle on the 14C activity, we added an annual cycle to the bombNH1 curve with an F14C amplitude of 0.0055, using a sine function in which the annual cycle is given by F14Cannual=0.0055·sine(2π·t+π/2) where t is in years. The lagged squared distances in the analysis that include the annual cycle are indistinguishable from the lagged squared distances computed in the analysis excluding the annual cycle. Hence, the effects of the annual cycle are insignificant when considering atmospheric Δ14C changes across the bomb peak, and therefore do not influence the results of this study.
A: F14C values of EW and LW measured in oak tree from Risskov Dyrehave, Denmark (Table 1). EW values are plotted as green circles (EW; Risskov, this study) and LW values as orange squares (LW; Risskov, this study) along with the atmospheric 14C content in the Northern Hemisphere zone 1 (bomb13NH1) (Hua et al. Reference Hua, Barbetti and Rakowski2013). Dendrochronologically dated ages of EW and LW are shifted 0.3 and 0.5 years into the year of growth, respectively. B: F14C values of EW (green triangles) and LW (orange diamonds) measured in the study by Olsson and Possnert (Reference Olsson and Possnert1992) (Table 2), along with the atmospheric 14C content (bomb13NH1) (Hua et al. Reference Hua, Barbetti and Rakowski2013). Dendrochronologically dated ages of EW and LW are added 0.3 and 0.5 years, respectively. (See online version for color figures.)

Least-square tests of the atmospheric 14C content and the 14C dataset from this study and Olsson and Possnert (Reference Olsson and Possnert1992). The x-axis shows the shift in years the dendrochronologically dated age of EW and LW must be added in order to align with the atmospheric curve. The green solid and dashed lines represent EW from this study (EW; Risskov, this study) and the study by Olsson and Possnert (Reference Olsson and Possnert1992), respectively. The orange solid and dashed lines represent LW from the two studies.

Wood fractions and F14C data from this study.

Wood fractions and F14C data from Olsson and Possnert (1992).

The F14C values for EW appear to have a smooth transition to LW when compared to the bombNH1 curve (Figure 1A). The F14C values generally track both smaller (1966–1970 CE) and greater variabilities (1963–1964 CE) in the atmospheric 14C content. In particular, the EW and LW measurements from 1963 CE and 1964 CE are almost perfectly aligned with the atmospheric curve and record even rapid excursions in the 14C level, lasting 1 year or less. One data point (1959 CE, LW) has a greater F14C value than the measured atmospheric value, coinciding with a minor peak in the atmospheric curve. Also, one EW data point from 1958 CE has a lower F14C value than the atmospheric curve, which is a point in time where the atmospheric curve is associated with relatively high uncertainties.
An existing sub-annual 14C record based on Swedish oak (Olsson and Possnert Reference Olsson and Possnert1992) also showed consistency between analyzed F14C values and the atmospheric F14C content (bombNH1) (Figure 1B; Table 2). The minimum least-squares lag obtained for LW in the Swedish record is very similar to the lag obtained for the new 14C record from Risskov, Denmark, supporting the conclusion that the LW fraction is produced mainly in mid-summer (Figure 2). However, the EW lagged squared distances from the Swedish record indicate that the EW fraction may originate from September/October of the previous year to February/March of the growth year, corresponding to the hibernation period with no photosynthetic activity. Thus, it is therefore possible that the EW fraction in the Swedish oak tree incorporated a significant amount of carbon from the previous year. However, the Swedish record originates from a location around Uppsala, Sweden, at 60°N, which is close to the northern tree line of the northernmost oak specie, Quercus robur (Hultén Reference Hultén1971). We speculate if the origin of the Swedish record close to the northern tree line may explain the observed difference in the EW carbon source between the Danish and Swedish records due to increased stress on the Swedish tree. The inconsistency between the time lags inferred for the two records may also originate from the discontinuities in the Swedish record, which could influence the lagged least-squares analyses. The differences in time of growth of EW between the two records indicate that care must be taken when interpreting 14C values from EW. On the other hand, the consistency between the lags obtained in the least-squares analysis of LW from the two records shows that LW generally provides robust 14C values.
This study suggests that the incorporated 14C in EW and LW in Danish oak originates from the actual growth year, which is in contrast with the notion that EW is produced from a reserve stored in the tree from the previous growing season (Pilcher Reference Pilcher1995; Speer Reference Speer2010). This might imply that the contribution from stored reserves in EW in Danish oak is small compared to the carbon incorporated during the growth year. The time of growth of EW and LW during a year varies among tree species, however, and is also influenced by environmental factors (Speer Reference Speer2010), implying that this result may not be considered representative of all 14C data derived from tree rings. This is illustrated by the study of Carbone et al. (Reference Carbone, Czimczik, Keenan, Murakami, Pederson, Schaberg, Xu and Richardson2013) who measured the ages of tree-ring cellulose from the innermost ring in 2-cm stemwood cores, sampled primarily from maple trees (Acer rubrum). The cellulose extracted from tree rings covering a full year yielded ages 0.9 years older than the counted tree-ring age. A study by Richardson et al. (Reference Richardson, Carbone, Keenan, Czimczik, Hollinger, Murakami, Schaberg and Xu2013) yielded ages of starch and sugars (i.e. the reserves stored in the tree) in maple tree rings of 7–14 years. Comparing the relatively small lag of 0.9 years in cellulose and the lag of 7–14 years in starch and sugar suggest that the amount of 14C stored in the reserve and used for tree-ring production is relatively small. This comparison also highlights the importance of utilising α-cellulose for 14C measurements to avoid the storages of old 14C in tree rings.
In contrast with the existing ambiguity concerning the origin of 14C in various trees, the results reported in this study clearly show that by measuring 14C in α-cellulose from both EW and LW in Danish oak, it is possible to reconstruct sub-annual changes in past atmospheric 14C levels. This is in agreement with recent results by Fogtmann-Schulz et al. (Reference Fogtmann-Schulz, Østbø, Nielsen, Olsen, Karoff and Knudsen2017), who showed how such a sub-annual 14C record can be used to constrain the timing of cosmic-ray events, which may be of key importance for high-precision dating of archaeological artifacts.
CONCLUSION
Few studies have until now measured radiocarbon in both early-wood and late-wood fractions from tree rings. By analyzing radiocarbon from the two wood components in tree rings from Danish oak, this study shows it is possible to resolve sub-annual variations in atmospheric 14C content across the bomb peak. The results further show that early-wood in Danish oak predominantly is produced during the months March/April. Measured 14C values in an older study of Swedish oak suggest that the early-wood component may contain 14C from the previous growth season, indicating that 14C measurements of the early-wood fraction should be interpreted with care. The late-wood component in Danish and Swedish oak trees is produced between June/July and September/October, and late-wood clearly seems to be the most robust recorder of past variations in atmospheric 14C levels. The results achieved in this study, however, solely depend on lagged least-squares analyses, which could be influenced by discontinuities in the Swedish record. Differences regarding the origin of 14C in the early-wood component in Danish and Swedish oak could also relate to the fact that the Swedish oak derives from a location close to the northern tree line for oak trees.
ACKNOWLEDGMENTS
We sincerely acknowledge Wormianum, Kjeld Christensen for the dendrochronologically dating and provision of the piece of Danish oak tree analyzed in this study, which has made this work possible. Sabrina Gjødvad Kaiser Kudsk, Mads Faurschou Knudsen, and Christoffer Karoff are grateful for financial support from the Villum Foundation