1.0 INTRODUCTION
Modern combat ships, e.g. frigates and destroyers, routinely operate with maritime helicopters. The challenge of landing the helicopter in bad weather is acknowledged as being both demanding and dangerous; moreover, if the flying conditions are too difficult, the helicopter will not be cleared to take off, and an important component of the ship's capability will be lost(Reference Lumsden and Padfield1). The maritime helicopter is often regarded as one of the most important tactical systems on the ship and is used to perform a variety of different roles, including anti-submarine warfare, surveillance, troop-transfer and supply replenishment at sea. While these operations are now considered routine, the ship-helicopter dynamic interface still presents one of the most challenging environments in which a helicopter pilot will operate. As well as a restricted landing area and a pitching, rolling and heaving deck, the pilot must also contend with the presence of a highly dynamic airflow over the flight deck. This phenomenon, known as the ship's ‘airwake,’ is caused by the air flowing over and around the ship's superstructure as a result of the combined effect of the prevailing wind and the forward motion of the ship.
There has been considerable research into understanding the ship's airwake and how it affects a helicopter's handling qualities, particularly the use of unsteady computational fluid dynamics and piloted simulation of the helicopter launch and recovery. Observations of the airwake characteristics and their effects on flying difficulty and pilot workload have also led to research into how a ship's superstructure affects the airwake. Other aerodynamic factors which affect helicopter operations are the accuracy of the ship's anemometers when they are immersed in the ship's airwake, and the dispersion of the ship's exhaust gases through mixing with the turbulent airwake.
The great majority of the research into understanding ship airwakes and how they affect a helicopter has been conducted through modelling and simulation, both computer-based and experimental. The main purpose of this paper is to describe the contribution that the Flight Science and Technology Research Group at the University of Liverpool has made to the UK's development of modelling and simulation of the helicopter-ship dynamic interface e.g. Refs Reference Roper, Owen, Padfield and Hodge2–Reference Forrest, Owen, Padfield and Hodge5.
2.0 BACKGROUND
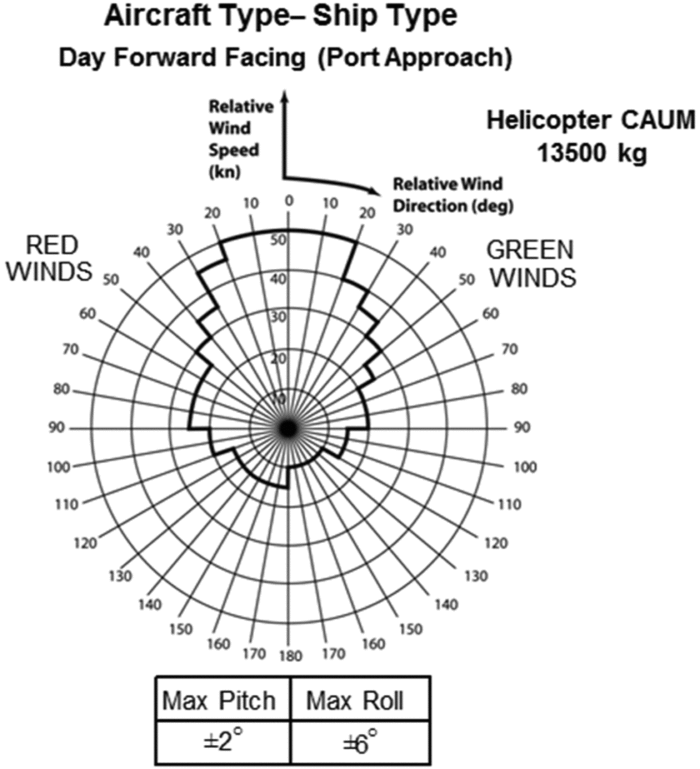
As outlined above, the task of landing a helicopter to a ship in bad weather is both dangerous and difficult. Ship-Helicopter Operating Limits (SHOL) for a given ship and helicopter combination are normally determined during the ship's First of Class Flight Trials (FOCFT) in which the ship and the helicopter are put to sea, and test pilots perform numerous launch and recovery tasks for winds of different strength and direction. Figure 1 shows an example SHOL diagram where the limits of wind strength and direction, relative to the deck, are indicated on a polar chart.
Example SHOL showing wind-over-deck envelope for a UK port-side landing manoeuvre.

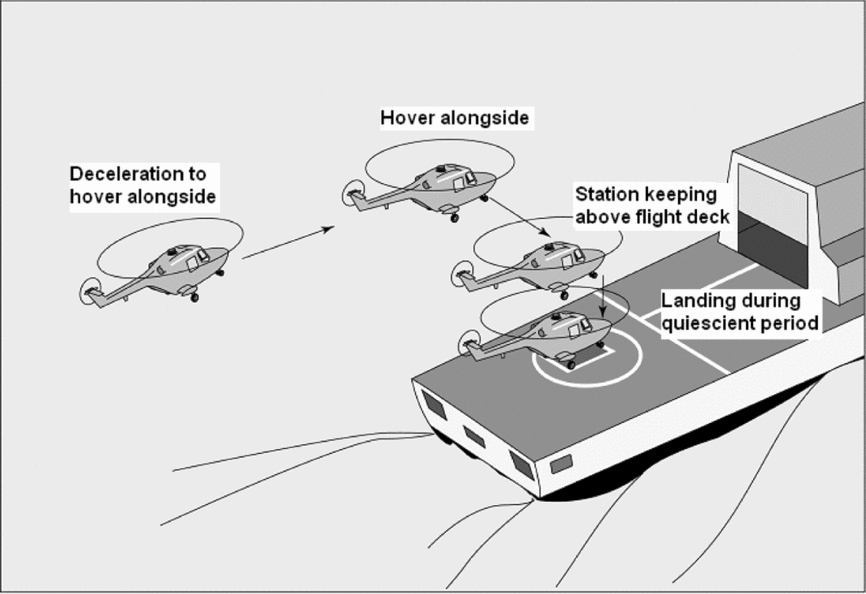
The chart is for a UK standard port-side landing manoeuvre, Fig. 2, where the pilot first positions the helicopter parallel to and alongside the port side of the ship, matching the ship's speed. The aircraft is then translated sideways across the deck, with the pilot's eyeline at about hangar height until positioned above the landing spot; during a quiescent period in the ship's motion, the pilot will descend to the deck and land the aircraft. It can be seen for the case shown in Fig. 1, that for a headwind, the helicopter is still able to operate with a relative wind speed up to 50 Kn, while this reduces to some 20–30 Kn for oblique winds, partly because of the complex unsteady flows being shed from the ship's superstructure and partly because of the control authority required to overcome the side winds. The lower permissible winds from astern are because they push the helicopter towards the hangar and they also reduce the effectiveness of the tail rotor. The asymmetry in the SHOL is partly due to the translation being from the port side regardless of whether the winds are from the starboard (Green) or port (Red). In practice, it is very difficult in a FOCFT to obtain a full range of Wind-Over-Deck (WOD) conditions in the chosen trial period and the costly and time-consuming trials are often incomplete. While various techniques can be used to fill the gaps in the SHOLs, these normally err on the conservative side and lead to a restricted SHOL. More recently, a method of using shore-based hover trials and ship airwake data to construct a ‘candidate flight envelope’ that can be assessed in shorter at-sea trials has been developed to support the Dutch navy(Reference Hoenkamp, Lee, Pavel and Stapersma6).
Final stages of the recovery of a Royal Navy helicopter to a single spot frigate.

Significant research into the air flow over ship superstructures and the effect on maritime helicopter operations began to emerge in the mid-1990s, e.g. Ref Reference Tai and Carico7. In the US, the Joint Shipboard Helicopter Integration Process (JSHIP) was established to support the interoperability of helicopters from the US Navy, Army and Air Force with a range of ships. Conducting the at-sea trials for the multiplicity of possible ship/helicopter combinations is prohibitively expensive and time-consuming, so a major task of JSHIP was to develop a high-fidelity simulation capability, including use of the NASA Ames Vertical Motion Simulator, to demonstrate that realistic piloted launch and recovery missions could be conducted for different aircraft and ship combinations and simulated SHOLs could be determined. Meanwhile, in 2003, the UK Ministry of Defence began funding a project to develop a simulation capability for predicting SHOLs using the Merlin helicopter training simulator at the Royal Navy Air Station in Culdrose, Cornwall(Reference Cox, Turner, Finlay and Duncan8). The Ship/Air Interface Framework (SAIF) project, as it is called, has created a federated computer architecture where the different elements specific to ship operations (e.g. motion, visuals and airwake for different ships, and different aircraft types) could be flexibly used with the Merlin simulator. Having created the computer architecture with the ability to implement different flight models, this made it possible to include the simulation of maritime unmanned vehicles that did not require the use of the motion base(Reference Cox, Turner, Finlay and Duncan8). The SAIF project has conducted simulated SHOL trials for a Merlin operating to a Type 23 frigate and a Type 45 Destroyer(Reference Turner, Clark, Cox, Finlay and Duncan9).
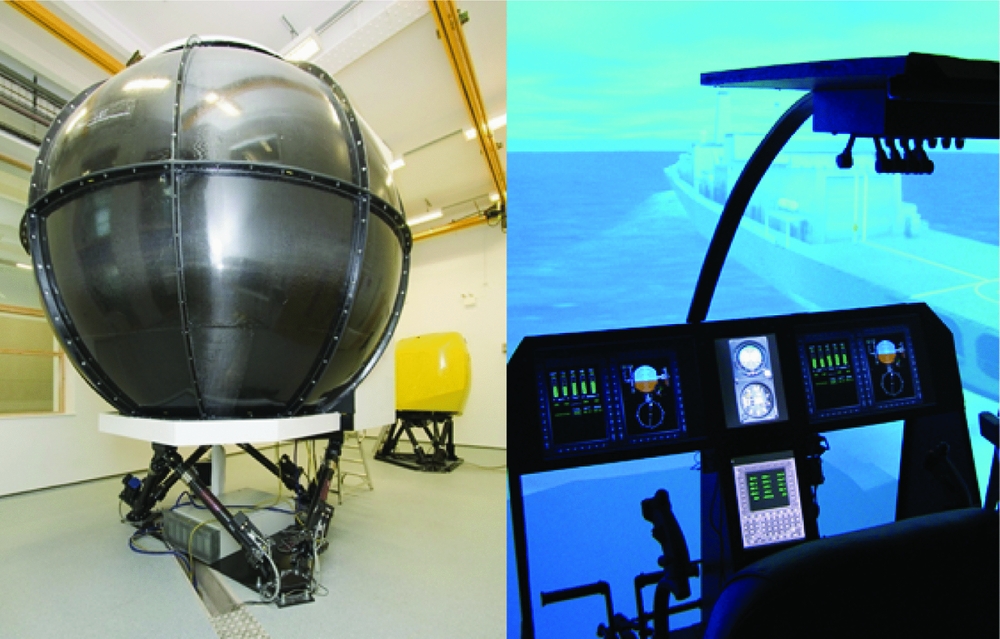
Separately, within the UK, the Flight Science and Technology Research Group at the University of Liverpool was established in 2000, central to which was research into rotorcraft flight dynamics and control, including flight simulation using a motion base. Flight simulation research began with a single-seat, full motion flight simulator, HELIFLIGHT(Reference Padfield and White10) which was built with a technical and functional specification that would allow research into flight handling qualities, flight mechanics, flight control system design, aircraft design concepts and cockpit technologies. As a research simulator it provided greater availability and flexibility than a qualified naval training simulator and also allowed access to the simulator's motion system controllers. In 2008 a second, larger and more capable simulator, HELIFLIGHT-R, was installed(Reference White, Perfect, Padfield, Gubbels and Berryman11) by Advanced Rotorcraft Technology (ART), shown in Fig. 3 (the smaller single-seat HELIFLIGHT simulator can be seen in the background).
HELIFLIGHT-R simulator – internal and external views.

HELIFLIGHT-R is also a full-motion research flight simulator that has a three channel 220 × 70° field of view computer visual system, a 6-degree-of-freedom motion platform, a four-axis force feedback control loading system and an interchangeable crew station. Flight mechanics models are developed in either FLIGHTLAB or Matlab/Simulink and the current aircraft library features a range of fixed wing, rotary wing and tilt-rotor aircraft. The outside world imagery is generated using Presagis’ Creator Pro software to produce either geo-specific or custom visual databases. Using Presagis’ VEGA Prime software, the Liverpool group has generated its own runtime environment, LIVE, which allows the simulator operator to change environmental effects such as daylight, cloud, rain and fog, along with maritime effects such as sea state, ship exhaust and rotor downwash on the sea surface. A heads-up display can either be generated using an LCD screen with a beam splitter located above the instrument panel or projected directly onto the inside surface of the dome. The motion and visual cues, together with realistic audio cues, provide a powerful immersive environment for a pilot. Data from the flight models, e.g. aircraft position, accelerations, attitudes, together with pilot control inputs can be monitored in real time and recorded for post-flight data analysis, while in-cockpit cameras provide audio and video recordings of a flight, together with computer-generated ‘chase’ views of the aircraft.
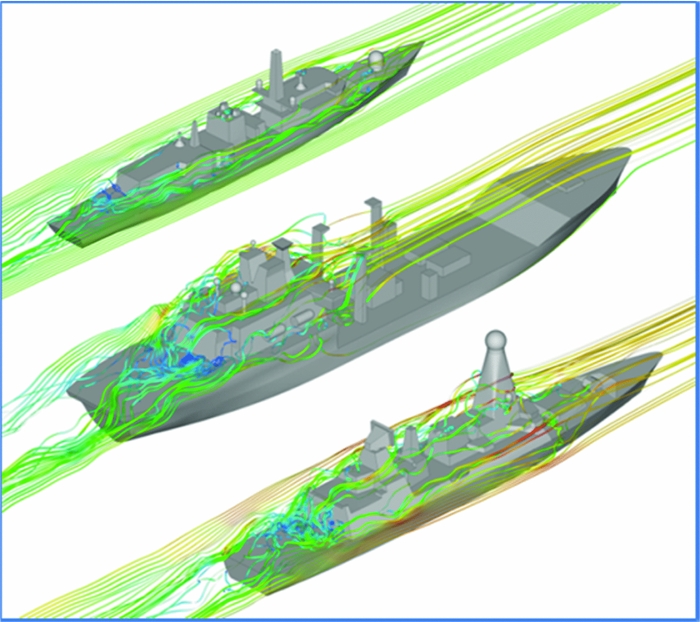
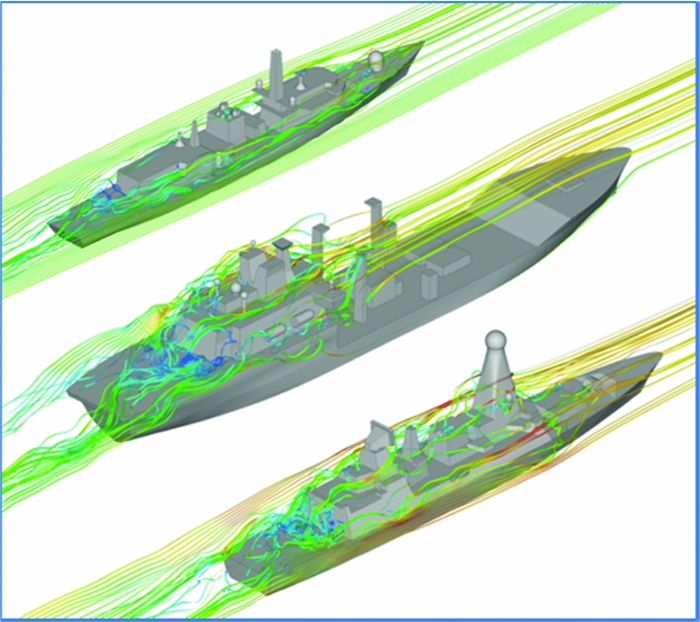
Amongst the flight simulation projects that were initiated at Liverpool in the early 2000’s was research into the ship-helicopter dynamic interface. As well as developing the flight simulation capability, the research was also concerned with the effect of the ship superstructure geometry on the airwake, and hence on the potential flight envelope of the helicopter. Figure 4 shows the mean air flows over three ship geometries for a headwind, generated using Computational Fluid Dynamics (CFD). The ships are a Type 23 frigate (133 m long), a Type 45 destroyer (152 m) and a Wave Class Tanker (197 m). For each ship, the path lines show the chaotic air flow over the aft landing deck and it should also be noted that these flows are highly unsteady.
Mean pathlines over (from top) Type 23 Frigate, Wave Class Tanker, Type 45 Destroyer.
It is this research capability and experience that has enabled the University of Liverpool to support the UK's SAIF project and current and future FOCFTs, as well as providing practical ship design guidance. The following sections will describe aspects of this research.
3.0 HELICOPTER FLIGHT SIMULATION AT THE SHIP-HELICOPTER DYNAMIC INTERFACE
The creation of a full-motion flight simulation environment for a helicopter operating to a ship requires: a simulator, in this case the HELIFLIGHT-R shown in Fig. 3; a helicopter flight dynamics model; a ship visual model, such as those shown in Fig. 4; a CFD-generated airwake; a ship motion model; and a visual scene.
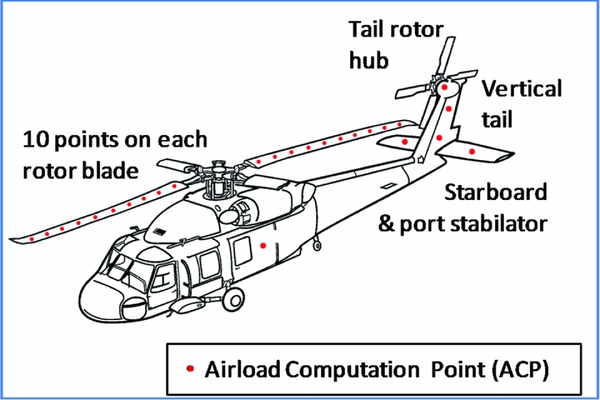
The FLIGHLTAB modelling and simulation software has a library with a number of flight models for both rotary and fixed wing aircraft. Figure 5 shows the FLIGHTLAB Generic Rotorcraft, which has been configured to represent a Sikorsky SH-60B Seahawk helicopter model that was used, for example, by Hodge et al(Reference Hodge, Forrest, Padfield and Owen4). The SH-60B was selected because of the availability of engineering data in the open literature for that type of helicopter(Reference Howlett12). The FLIGHTLAB Generic Rotorcraft model comprises the following major subsystem components: (1) individual blade-element main-rotor model including look-up tables of non-linear lift, drag and pitching moment coefficients stored as functions of incidence and Mach number; (2) a Bailey disk tail-rotor model, (3) finite-state Peters-He dynamic inflow model; (4) separate aerodynamic look-up tables for the fuselage, vertical tail and the port and starboard stabilator forces and moments stored as non-linear functions of incidence and sideslip; (5) turbo-shaft engine model with a rotor-speed governor; (6) primary mechanical flight control system and Stability Augmentation System (SAS) models including sensor and actuator dynamics; and (7) a landing gear model to provide deck reaction cues on touchdown.
Seahawk helicopter model showing location of Airload Computation Points.

The Airload Computation Points (ACP) indicated in Fig. 5 are where the three-dimensional velocity components of the air flow are applied to the helicopter model to create the forces and moments that are imposed on the aircraft by the unsteady airwake. The velocity components (u,v,w) created by the CFD are stored in a lookup table at fixed positions in space (x,y,z) and at different times (t). The x,y,z locations in the lookup table have to be translated to the locations of the ACPs shown in Fig. 5, including those along the rotating blades of the main rotor.
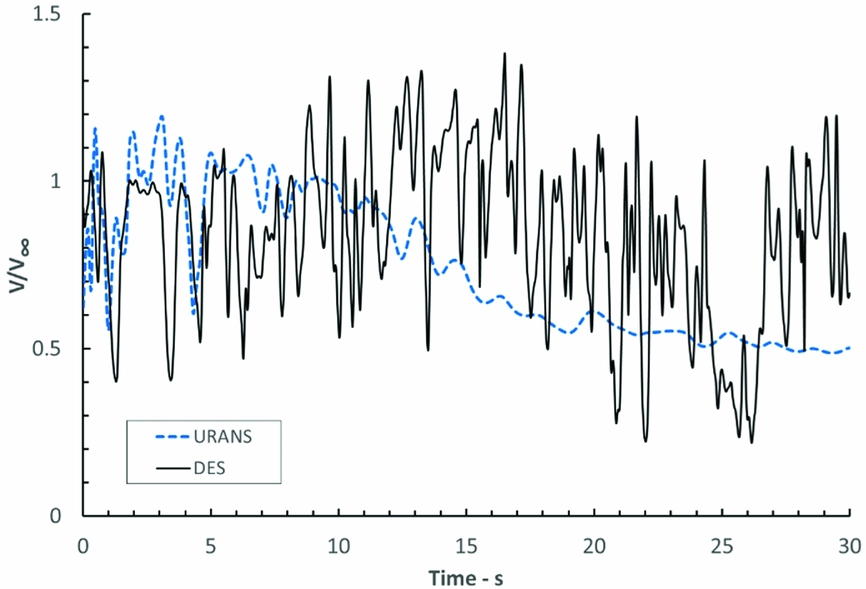
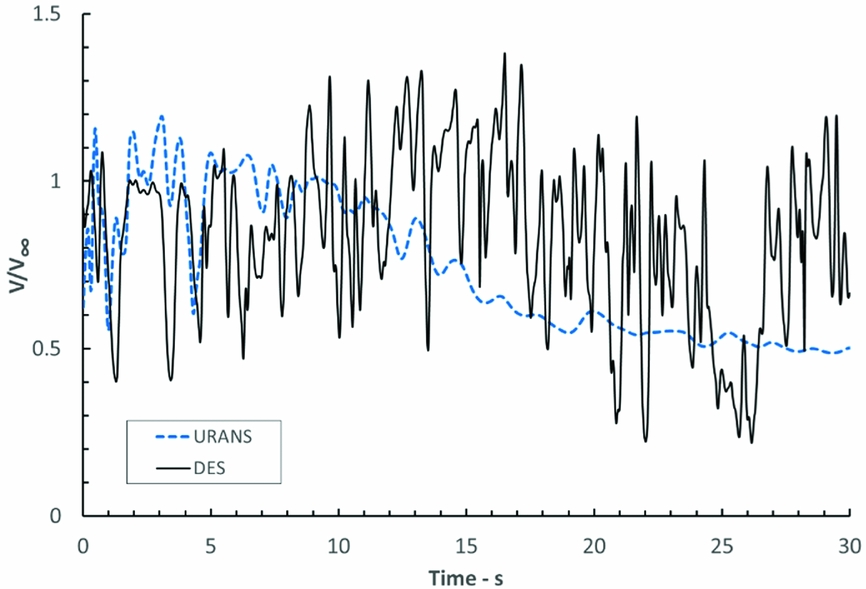
Early development at Liverpool used steady-state CFD airwakes, and the challenge was to integrate the velocity field with the helicopter flight mechanics model so that the aerodynamic loadings could be applied correctly. This work was reported by Roper et al(Reference Roper, Owen, Padfield and Hodge2), but while it was a success, and the pilots reported a more realistic flying experience than without the airwake included, they also reported that the fidelity was compromised by not having the ‘bumping’ associated with unsteady aerodynamic loads. As more powerful computing resources become available, unsteady CFD was used to create the ship airwakes, and more realistic and complex ship geometries were employed. A challenge for the CFD is not just to create the unsteady velocity field as the air flows over the ship superstructure, but also to maintain the unsteadiness in the ship airwake as it passes over the ship. The turbulence modelling technique that has been adopted for the airwake simulation is Detached Eddy Simulation (DES)(Reference Forrest and Owen3). DES is a hybrid approach to turbulence modelling where Large Eddy Simulation (LES) is used away from the surfaces of the ship to directly compute the larger scale turbulent structures, while closer to the surface Unsteady Reynolds-Averaged Navier-Stokes (URANS) is used. LES is computationally expensive, especially so if applied close to the walls where the computational grid has to be very fine to capture the small-scale turbulent structures, so a URANS solution is applied near to the wall. DES, therefore, combines the two methods and has been found to be particularly effective for bluff bodies with sharp edges, such as a ship's superstructure, where the edges where the flow separates from the surface are well-defined. Figure 6, extracted from Hodge et al(Reference Hodge, Forrest, Padfield and Owen4), shows how the velocity in the flow at a particular point over the landing deck changes with time for URANS and DES. As can be seen, the DES solution is able to maintain the unsteadiness in the flow, while the velocity produced by the URANS solution is damped out and converges onto a steady-state solution.
Time history of velocity at a point in the flow above the flight deck using URANS and DES(Reference Hodge, Forrest, Padfield and Owen4).
As reported by Forrest & Owen(Reference Forrest and Owen3), CFD airwakes of realistic ship geometries have been produced and validated against wind-tunnel and at-sea data. The wind-tunnel data was provided by the National Research Council of Canada who used hot wire anemometry over a model of a generic simplified ship, known as the Simple Frigate Ship. The at-sea data was provided by the UK Defence Science and Technology Laboratory and was obtained using ultrasonic flowmeters placed around the flight deck of a Type 23 frigate. More detail of the CFD methodology and validation can be found in Ref. Reference Forrest13.
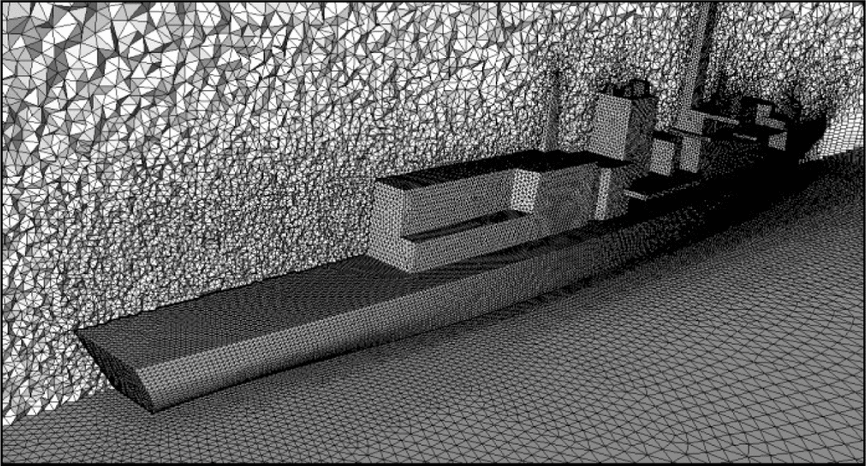
The complex unsteady airwakes have been created using Ansys Fluent, a commercial CFD code. A ship model, such as those shown in Fig. 4, is imported into the Ansys ICEM mesh generation software, so that it can be ‘cleaned’ to repair any erroneous surfaces and to remove small features to create geometry suitable for meshing. Features such as small antennae, railings and other small deck clutter have little effect on the airwake but if not removed will increase the complexity and hence the runtime of the CFD. Generally, objects that are less than 0.3 m in diameter are removed. A surface mesh is then applied to the ship geometry and this is ‘grown’ away from the ship into the computational domain which surrounds the ship. The surface and volume mesh for a Type 23 frigate can be seen in Fig. 7.
Unstructured CFD mesh for Type 23 frigate.

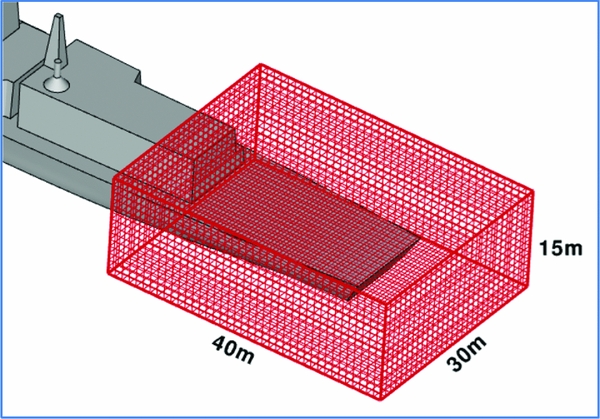
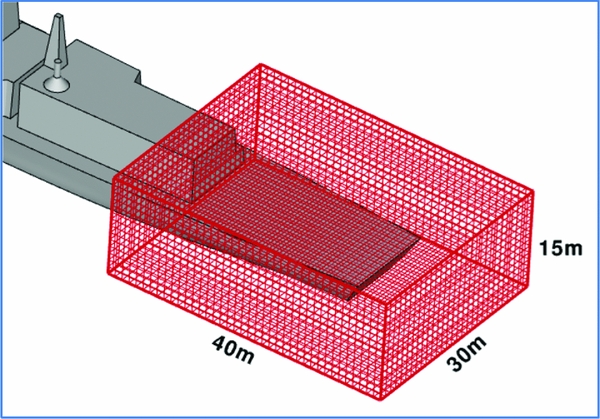
The DES solution is created at 100 Hz, i.e. (u,v,w) velocity components are calculated every 0.01 s, but for implementation within FLIGHTLAB, the solution is down-sampled to 0.04 s. The (u,v,w,t) data of the airwake is then stored in a look-up table that coincides with the volume within which the helicopter will fly; Figure 8 shows the domain around the flight deck of a Type 23 frigate in which a helicopter will fly when executing the port-side landing manoeuvre illustrated earlier in Fig. 2. For simulated SHOLs, where winds of different directions and strengths are required, it is possible to scale the velocities from one wind speed to another using Reynolds and Strouhal scaling, as demonstrated by Scott et al(Reference Scott, White and Owen14), but a separate airwake has to be computed for each wind direction.
Structured grid for airwake look-up table.
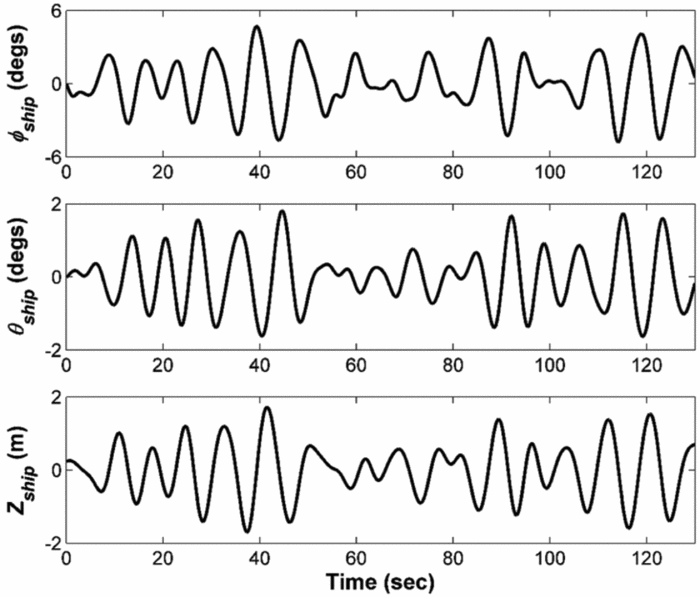
Ship motion is also required for the simulation, so the pilot has to contend not just with the unsteady forces and moments on the helicopter, but also the moving landing spot. Ship motion is determined by the ship design, the sea surface waves and the relative motion of the two. A ship does not, therefore, have a particular defined motion, so what is required for the simulation is a motion that is representative of a particular ship and sea state and is realistic when viewed by the pilot. While ship motion can be calculated by bespoke software models, the approach used most often at Liverpool has been a more pragmatic one, to take a recorded motion for a ship and to scale it according to the ship size and sea state so it has representative displacements and frequency and, importantly, has the naturally occurring quiescent periods when the motion subsides somewhat(Reference Hodge, Forrest, Padfield and Owen4). An example of ship motion data in the roll, pitch and heave axes measured at the ship's centre of gravity is shown in Fig. 9. The motion can be seen to have the naturally occurring quiescent period and it is this that the pilot waits for to execute the final landing phase. In a recent study by Scott et al(Reference Scott, Kelly, White and Owen15) into pilot workload when landing to ships of different sizes taking account of both the different airwakes and ship motion, the motion was computed for each ship using ShipMo3D, a ship motion code developed by the Canadian Department of National Defence(Reference McTaggart16), and made available to the University of Liverpool.
Example of simulated ship motion in sea state 6 conditions measured at the ship's centre of gravity(Reference Hodge, Forrest, Padfield and Owen4).

4.0 SIMULATED SHIP-HELICOPTER OPERATIONAL LIMITS
Having created a simulation environment, a programme of research was conducted at Liverpool to establish a simulated SHOL, initially for simplified ship and airwake models(Reference Roper, Owen, Padfield and Hodge2), and then with a Type 23 frigate and a detailed time-accurate unsteady airwake(Reference Hodge, Forrest, Padfield and Owen4). For each ship, airwakes were computed for a 40 kn wind coming from different angles relative to the ship around the 360° azimuth; the wind strength was then scaled up and down to create a set of airwakes for wind speeds from 20 to 50 kn.
The simulated flight test programme typically consisted of a series of approach and deck landing tasks for different winds-over-deck, usually in increments of 15° and 5 kn. During each experiment, an experienced (former) Royal Navy (RN) test pilot was instructed to fly the deck landing task using the standard RN technique shown in Fig. 2. This involves flying the helicopter to a stabilised hover on the port side of the ship, then manoeuvring sideways across the deck to a position above the landing spot and waiting there for a quiescent period in the ship's motion before executing a vertical landing. Three Mission Task Elements (MTEs) were identified from this description of the deck landing mission: (i) Sidestep manoeuvre; (ii) Station keeping (precision hover) above the flight deck; and (iii) Vertical landing.
Conducting the deck landings in a controlled simulation environment allows test points to be well defined and to be repeated. As well as recording the difficulty of the landing task, either on the Deck Interface Pilot Effort Scale (DIPES)(Reference Finlay17) or the Bedford Workload rating scale(Reference Roscoe and Ellis18), it is also possible to record pilot comments, as well as pilot control inputs, helicopter flight dynamics and motion platform dynamics. It is also possible to interrogate the CFD flow field when airwake disturbances are of interest. More detail of simulated SHOL testing can be found in Refs Reference Hodge, Forrest, Padfield and Owen4 and Reference Tai and Carico7. While simulated SHOLs are as yet insufficiently validated and cannot, therefore, currently replace at-sea FOCFT data, they can be used to explore the flight envelope and to recommend the wind-over-deck conditions where at-sea testing should be concentrated. A recent NATO report(19) describes the current state of the art with respect to the use of modelling and simulation applied to ship-helicopter operations. The lack of validation between the at-sea experience and the simulation is acknowledged as being the main challenge.
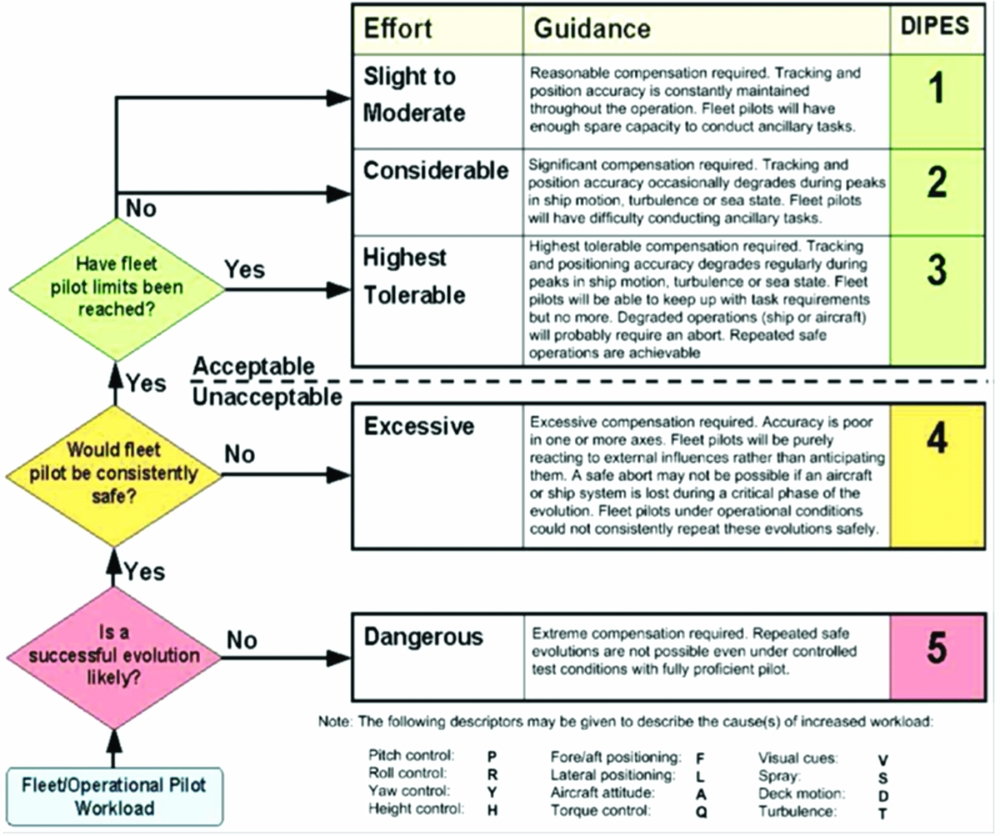
The previous paragraph refers to two rating scales that are used to quantify pilot workload. The Bedford scale is a 10-point scale(Reference Roscoe and Ellis18); 1 indicating insignificant workload and 10 indicating that the pilot had to abandon the task. In the Bedford scale, the pilot is asked to consider how much spare capacity they have while performing the assigned task, spare capacity being connected to the pilot's ability to perform secondary tasks, such as maintaining mission awareness, monitoring aircraft systems or listening to radio communications; the primary task being to fly the aircraft through a particular manoeuvre or mission. The higher the workload generated by the primary task, the less spare capacity there is for attention to these secondary tasks. The Bedford scale is applicable to any task, but the DIPES, as its name suggests, was designed specifically for deck landings. The DIPES, Fig. 10, requires the test pilot to rate each landing based on workload, performance, accuracy and consistency. A DIPES rating of 3 or less indicates that deck landings can be repeatedly achieved with precision and safety, under the conditions being tested. A rating of 4 or 5 indicates the contrary and places that condition outside of the SHOL, thus prohibiting deck landings under those conditions. In addition to the detailed comments given by the pilot, a number of letter suffixes can also be assigned to each rating, to describe the cause of increased workload (e.g. ‘T’ for turbulence or ‘D’ for deck motion).
Deck Interface Pilot Effort Scale (DIPES).

The DIPES is used by many navies to construct SHOLs; an example of a simulated SHOL based on DIPES will be discussed in the next section. The Bedford scale is used to assess how difficult a particular MTE is, e.g. hovering over the port edge of the ship, and can be used to quantify the difficulty caused by the airwake at a particular location. This process has been useful in assessing the effect a particular feature on the ship's superstructure may have on the helicopter, as will be discussed later.
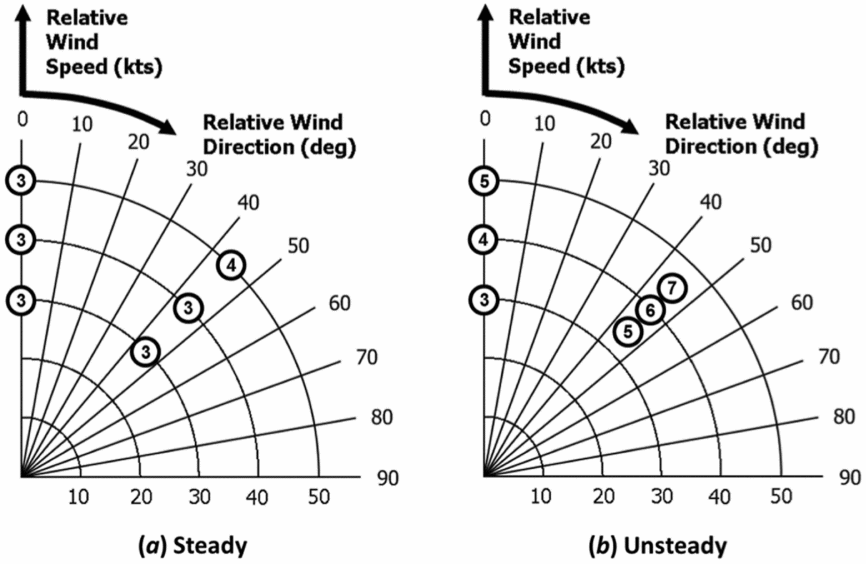
Earlier in the paper, the importance of being able to compute airwakes with unsteady velocities was emphasised. Figure 11, from Hodge et al(Reference Hodge, Forrest, Padfield and Owen4), shows the workload ratings awarded by a pilot using the Bedford 10-point scale referred to previously for a task of holding the aircraft in a hover position over the landing spot of a Type 23 frigate. The data is for headwinds, and for winds coming from 45° off the starboard bow (Green 45) for a steady-state CFD airwake, and an unsteady one. As can be seen, the pilot had to work much harder to maintain the aircraft's position in the unsteady airwake, especially for the 45° wind, so confirming the importance of having an unsteady airwake for the flight simulation.
Bedford workload ratings for a station-keeping task in steady and unsteady airwakes(Reference Hodge, Forrest, Padfield and Owen4).

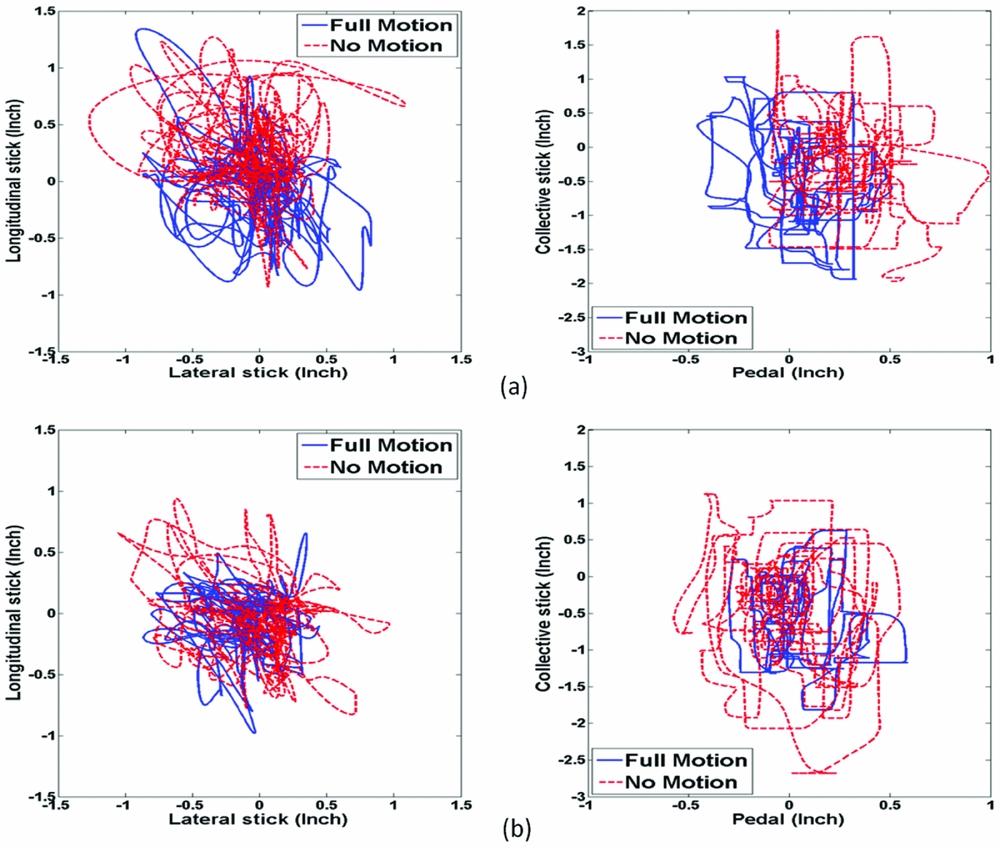
In terms of presenting to the simulator pilot an experience that is realistic and immersive, a fundamental requirement is the feedback, or cueing, that the pilot receives from the dynamics of the motion base and the visual scenery. While the need to have a motion base is not universally accepted, the importance of vestibular motion cues when a pilot is operating at high workload and the aircraft is at the limits of its control capacity can be demonstrated, especially when the visual cues are reduced in a degraded visual environment. Wang et al(Reference Wang, White, Owen, Hodge and Barakos20) conducted a series of ship landings and hover manoeuvres, using the Liverpool HELIFLIGHT-R simulator, where the outside scene was adjusted to be representative of daylight, twilight, fog and night. The importance of both the motion and visual cues was confirmed, and so, too, was the interdependence of the two. Figure 12 shows the pilot's activity in the cyclic, collective and pedal controls while holding the helicopter in a hover position over the landing spot of a Type 23 frigate. In the daylight, the pilot can use the visual references to hold position, but as the visual cues are degraded, the pilot's control movements display larger excursions without the vestibular motion cues.
Pilot control activity in (a) daylight and (b) fog, with and without motion(Reference Wang, White, Owen, Hodge and Barakos20).

5.0 USING FLIGHT SIMULATION TO ASSESS THE EFFECT OF SHIP SUPERSTRUCTURE DESIGN ON HELICOPTER FLYING QUALITIES
To illustrate how flight simulation has been used to quantify the effect that a ship's design can have on a helicopter's operational envelope, we present two cases: one for ship size and the other for particular features of the ship superstructure.
5.1 Ship size
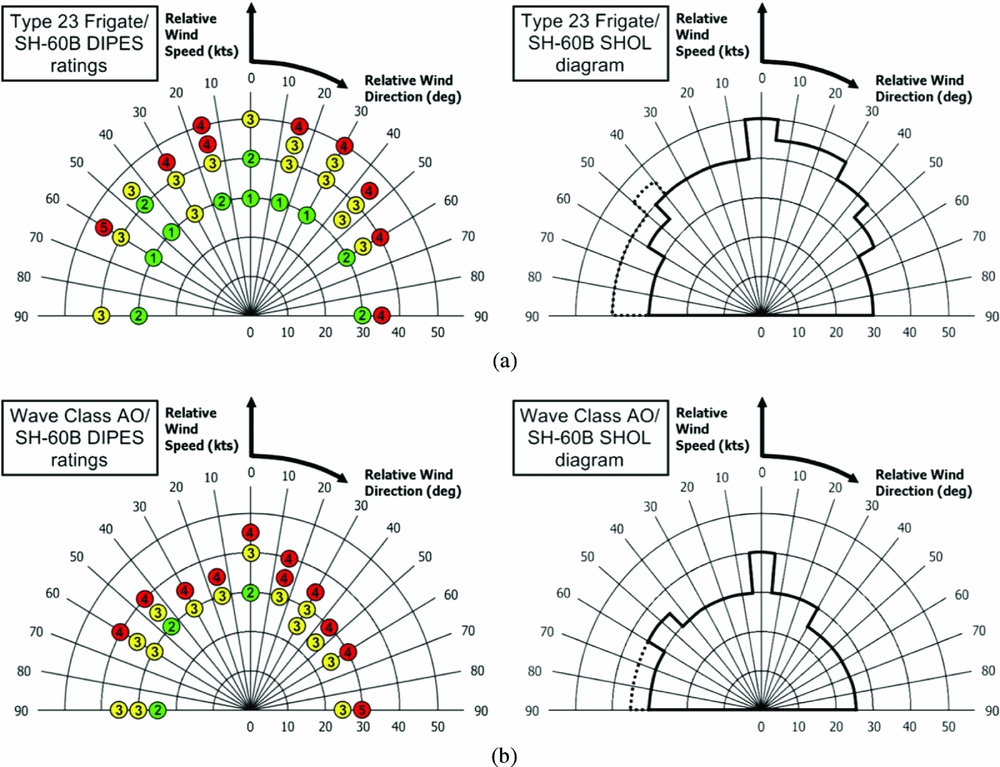
Figure 13 shows the simulated SHOL diagrams for ±90° winds for a SH-60B Seahawk conducting a RN port-side landing on (a) a Type 23 frigate and (b) a Wave Class Tanker, which were illustrated earlier in Fig. 4; the data was reported by Forrest et al in Ref. Reference Forrest, Owen, Padfield and Hodge5. The left hand diagrams show the pilot's DIPES ratings translated onto a polar diagram of wind speed and direction, while the right hand diagrams show the safe boundary drawn through the points. The solid line represents the limits defined by the DIPES ratings, while the dotted lines represent a boundary due to the limits of the tail rotor authority in a side wind.
DIPES ratings and SHOL diagrams for a Type 23 frigate and Wave Class tanker(Reference Forrest, Owen, Padfield and Hodge5).
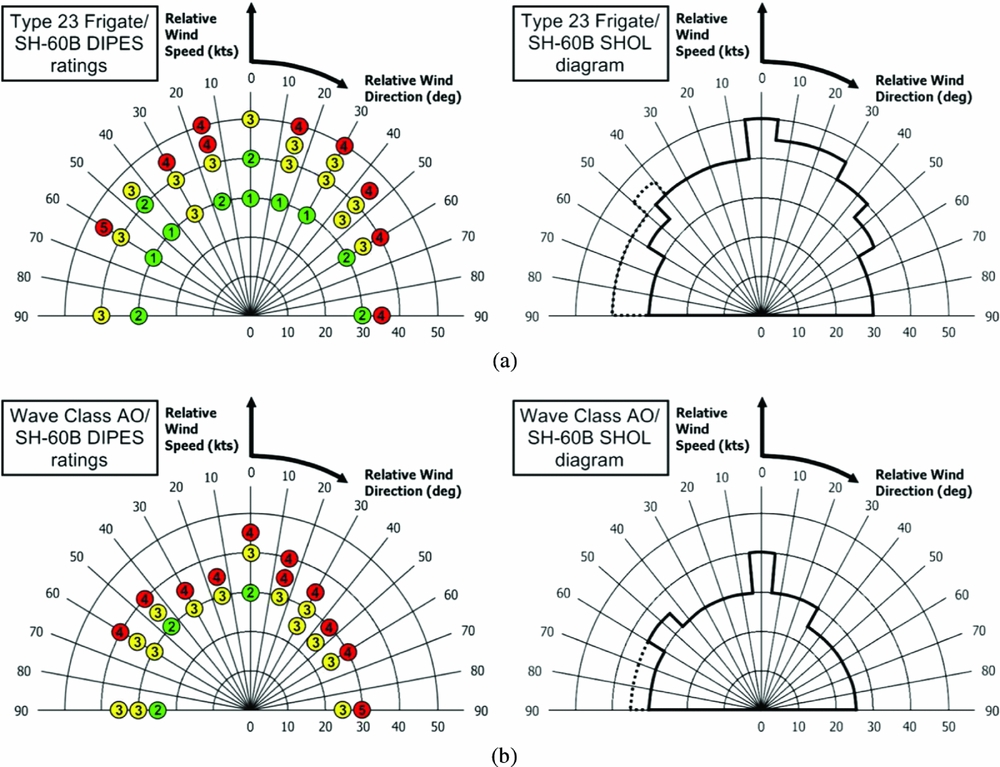
There is a lot of detail that can be drawn out of these diagrams, and this is supplemented by the recorded pilot control activity and commentary, as reported in Ref. Reference Forrest, Owen, Padfield and Hodge5. The main observation from Fig. 13 is that the SHOL for the larger Wave Class ship is significantly more restricted than the smaller frigate, despite it having a larger flight deck. The reason for this is that the air flow over the ships creates unsteady vortical structures that are shed from the sharp edges of the superstructure, and the bigger the ship, the bigger and slower the vortices. The vortices are of a similar size to the helicopter main rotor, thereby creating unsteady moments on the helicopter, and of a frequency that can lead to pilot induced oscillations as the pilot tries to hold position by counteracting the unsteady loads on the aircraft.
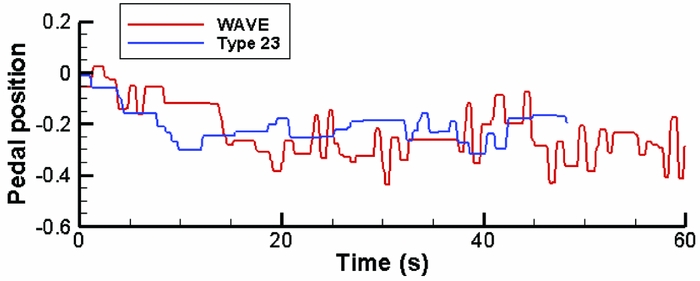
The data in Fig. 14, which was obtained during the same trials as those reported in Ref. Reference Forrest, Owen, Padfield and Hodge5, are an example of how the pilot's control activity yields further information about the effect of ship size on the helicopter; the graph shows a time-history of the pilot's inputs to the pedal control while trying to hold a hover position over the landing spot (plot shows deviations from the control trim position). The wind direction is 45° off the starboard (Green 45) and so the pilot is applying a biased input to the tail rotor to maintain heading. In the larger ship's airwake, it can be seen that there is more activity, shown by a higher number of pedal reversals being applied, and this represents greater pilot workload.
Pilot pedal activity (+1 to –1) in the simulator while station-keeping above the landing spot of a Wave Class tanker and a Type 23 frigate in a Green 45 wind(Reference Forrest13).

5.2 Superstructure features
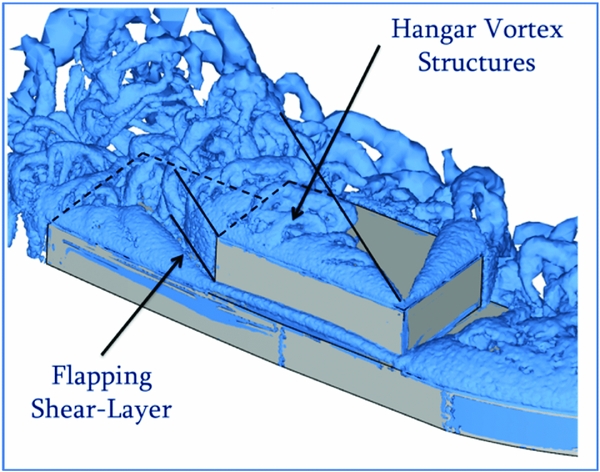
As mentioned earlier, oblique winds produce airwakes that are more challenging for the pilot, and Green winds in particular are problematic during a port-side landing approach. Figure 15 shows the air flow, as surfaces of iso-vorticity, over a simplified ship geometry in an oblique 45° wind.
Visualisation of air flow over a simplified ship in oblique 45° winds by surfaces of iso-vorticity.

A fluctuating shear layer caused by the flow separating from the hangar vertical edge can be clearly seen. The other dominant features in the figure are the numerous vortical structures caused by the flow ‘rolling up’ and shedding from the sharp edges, for example, at the horizontal leading edge of the hangar. More importantly for the helicopter, particularly while off the port side and translating across the deck, are the large vortex structures being shed from the upper horizontal edges on the starboard side of the hangar; the significance of these is that they pass above the path taken by the helicopter and get drawn into the helicopter's main rotor, causing significant unsteady moments. These flow features contribute significantly to the high pilot workload in Green winds.
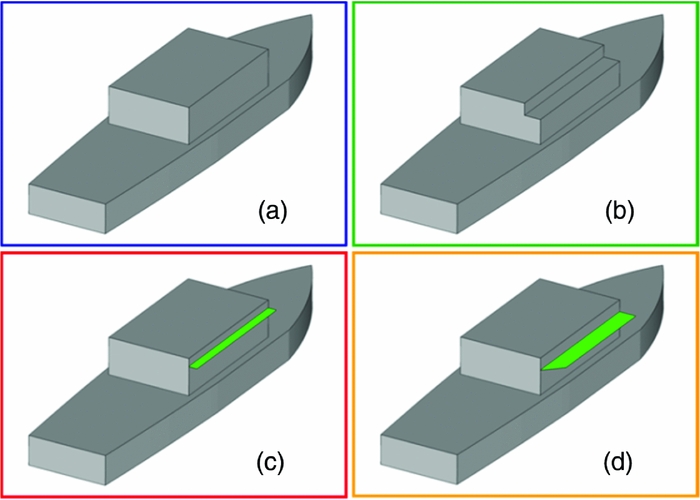
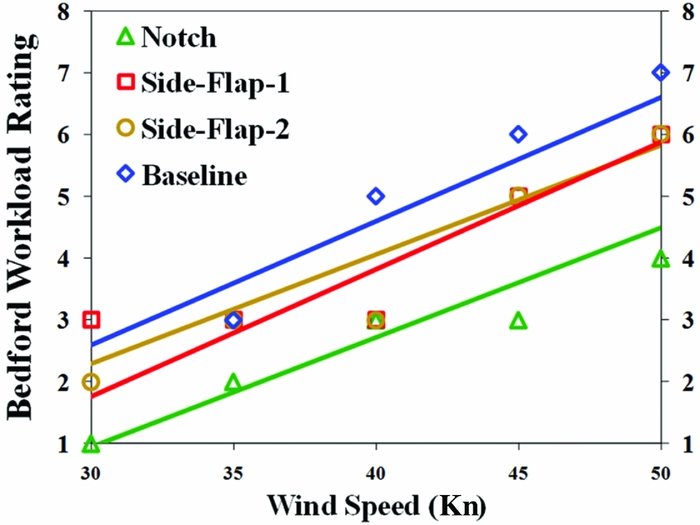
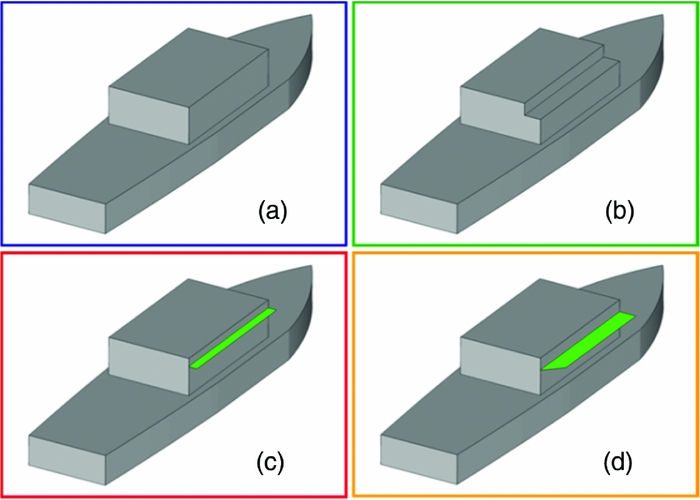
Kääriä et al(Reference Kääriä, Forrest and Owen21) modified the horizontal hangar edge to interfere with the vortex shedding and then used piloted flight simulation to determine how this would affect helicopter loading and pilot workload. Figure 16 shows three different modifications: a cut-out or notch, and two different side flaps. Figure 17 shows pilot workload ratings for the original geometry and the three modifications; these were recorded in the simulator while the pilot maintained the helicopter in a stable hover above the landing spot for 30 s in Green winds. The first thing to note in Fig. 17 is that the pilot has to work harder to maintain the helicopter over the landing spot as the wind speed increases, as might be expected. More importantly, the three modifications have significantly reduced pilot workload, particularly the Notch modification with a reduction of up to three workload ratings, while the side flaps typically show a reduction of one workload rating. Further understanding of the mechanisms responsible for the improvements is provided by examining the CFD and the various inputs to the pilot's controls. It is understood that ship geometry modifications may also affect other important characteristics such as radar cross section, but the significance of the work is that ship superstructure geometry can improve the flying environment for the helicopter and the pilot.
Simplified ship; (a) baseline; (b) notch; (c) side-flap-1; (d) side-flap-2(Reference Kääriä, Forrest and Owen21).
Pilot workload ratings for 30 s hover over landing spot in Green 45° winds(Reference Kääriä, Forrest and Owen21).

6.0 NON-PILOTED FLIGHT ASSESSMENT OF SHIP SUPERSTRUCTURE DESIGN ON HELICOPTER LOADING
At the core of the piloted motion-base flight simulation described above is the flight model, which is created using FLIGHTLAB, and the CFD-generated unsteady airwake; these two elements have been used together, without the motion simulator, to create a computer-based simulation tool that can also be used to assess the impact of ship superstructure designs on a helicopter. The Virtual Airwake Dynamometer, or Virtual AirDyn (VAD), as it is known, is a software analysis tool developed at the University of Liverpool(Reference Kääriä, Forrest and Owen22). During piloted real-time simulations, unsteady forces are generated on the aircraft causing it to move away from the trim condition and requiring the pilot to counteract the movement through the aircraft's controls. In the VAD, the helicopter is trimmed in the prevailing freestream conditions and is then placed at a selected point in the airwake and is fixed in that position. Because the helicopter is no longer trimmed for the conditions within the airwake, it experiences non-zero forces and moments imposed by the unsteady air flow, and it is these values that are recorded by the VAD. Therefore, using the VAD technique, the helicopter model becomes an instrument that measures the unsteady forces and moments imparted by the unsteady CFD airwake, providing a quantitative measure of the relative impact on the helicopter of the airwakes created by the different ship geometries. The helicopter model used in the VAD is again FLIGHTLAB's Generic Rotorcraft configured to represent a Sikorsky SH-60B Seahawk.
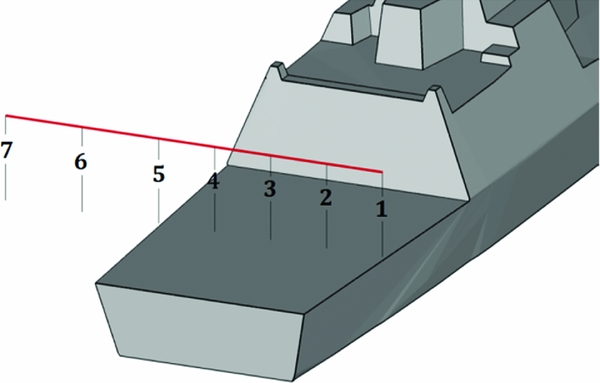
Typically, as for the piloted simulation described earlier, the unsteady airwake is computed for 30 s and is interpolated onto a structured rectangular grid, as shown in Fig. 8. The airwakes are calculated for a single wind speed, and for a range of wind angles. The method by which the VAD has been employed to compare ship airwakes is to carry out a translational approach beginning with the helicopter's rotor hub located at the ship's hangar height, one beam width from the landing spot, off the port edge of the ship. The helicopter is then held stationary with the rotor hub at several positions over the flight deck, as shown in Fig. 18.
Rotor hub fixed positions used to investigate ship airwakes with the Virtual AirDyn.
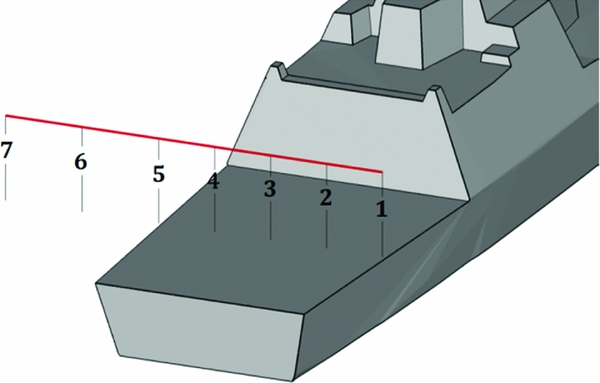
As with the application of FLIGHTLAB within the HELIFLIGHT-R flight simulator, the unsteady CFD airwake velocities are imposed onto the helicopter model at the ACPs shown in Fig. 5. At each of the sampling locations over the ship, Fig. 18, the helicopter is held stationary and the time histories of the unsteady forces and moments at the helicopter's centre of gravity are recorded over the full 30 s of airwake data. The unsteady loads are then time-averaged to provide the mean forces and moments acting on the helicopter at each of the test points.
A measure of the unsteady forces and moments is produced using a method in which Power Spectral Density (PSD) plots are generated from the time histories given by the VAD, and the square root of the integral between the limits 0.2 to 2 Hz is used to represent the Root Mean Square (RMS) loadings on the helicopter(Reference Kääriä, Forrest and Owen22). This analysis technique takes account of the fact that although the unsteady loads are imposed over a very wide frequency range, the high-frequency loads (>2 Hz) are less important because the inertia of the aircraft means it does not respond significantly, while the lower frequency loads (<0.2 Hz) can be counteracted by the pilot through the helicopter's controls. Loads in the frequency range 0.2 to 2 Hz are said to be in the closed-loop pilot response frequency range and have the greatest influence on pilot workload. In general terms, the RMS loading is responsible for the pilot workload while the mean loads will influence the control margins.
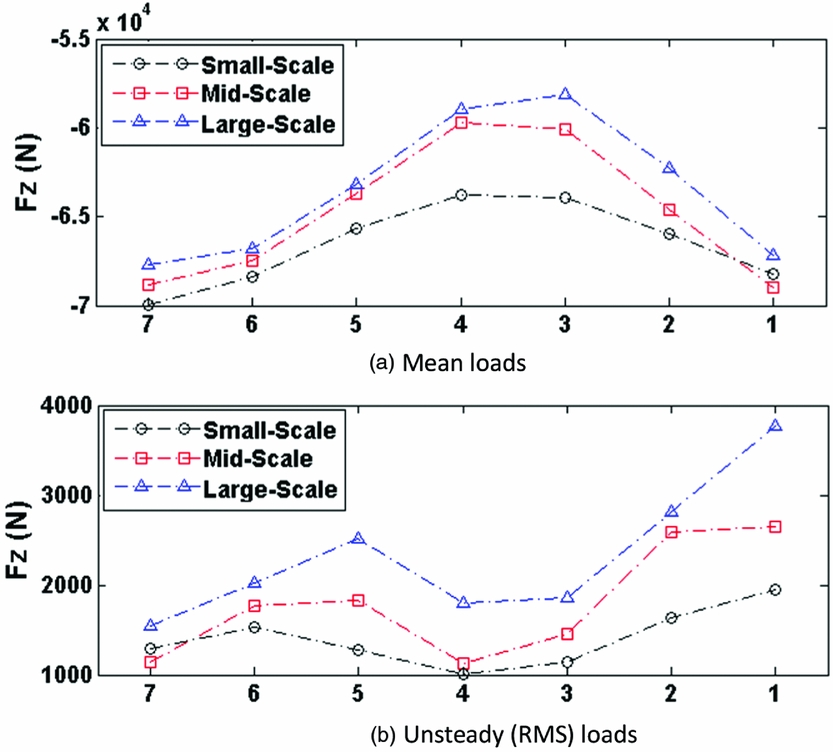
As an illustration of the VAD technique, Fig. 19, extracted from(Reference Mateer, Scott, White and Owen23), shows the mean and unsteady (RMS) thrust force on the helicopter as it is placed in positions 7 to 1 on Fig. 18. This particular set of data is using the VAD to quantify the effect of ship size on a helicopter's loading. Looking first at the mean loads, off the ship and out of the airwake, the rotor thrust equals the weight of the helicopter, 70 kn. As the helicopter moves through the airwake, the thrust generated by the main rotor reduces as the air velocities at various points on the rotor change in magnitude and direction; in practice, the pilot would counteract this by increasing the power to the rotor to compensate for the thrust deficit. The mean loads are therefore a measure of the amount of control the pilot has to apply or, more importantly, how much control margin is remaining. The pilot is expected to have a minimum of 10% control margin in all inceptors, and if one falls below this, the task may have to be aborted.
Mean and RMS helicopter loads in ship airwakes measured by the Virtual AirDyn(Reference Mateer, Scott, White and Owen23).
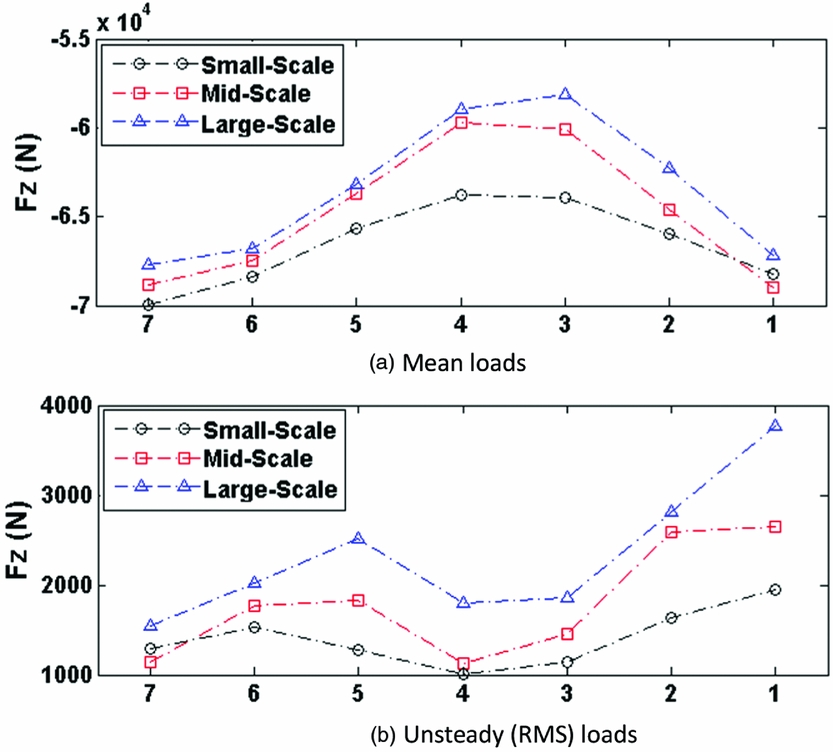
The RMS loads in Fig. 19 are a measure of the unsteady forces in the 0.2–2.0 Hz frequency range that contributes to pilot workload, again in the vertical direction. The greater the RMS value, the greater the unsteadiness that the pilot has to counteract through the controls, and hence, the greater the workload. In the figure, it can be seen how the unsteady loads increase as the helicopter moves into the airwake, and also how the bigger ship causes the higher RMS, consistent with comments previously stated in Section 5.1. The higher unsteady loads at point 5 are when the helicopter is over the port-side deck edge and is experiencing the unsteady shear layer being shed from the vertical side of the hangar. When the helicopter moves over the landing spot, it is sheltered somewhat; but the steady loads increase again as the helicopter moves over to the starboard edge. The asymmetry in the unsteady loads as the helicopter translates across the deck is because of the direction of rotation of the main rotor. The helicopter main rotor rotates in a counter-clockwise direction when viewed from above so a rotor blade will have a very different forward velocity and interaction with the airwake depending on whether it is sweeping forward (on the right side) or sweeping back (on the left side).
Figure 19 shows mean and unsteady data for only the vertical axis; mean and unsteady data are also acquired for the forward and side forces, and for the pitch, roll and yaw moments.
7.0 SHIP DESIGN GUIDANCE FOR HELICOPTER OPERATIONS
The simulation and modelling tools described in this paper are being applied during the design stages of naval vessels; examples of such applications are given below.
7.1 Superstructure aerodynamics
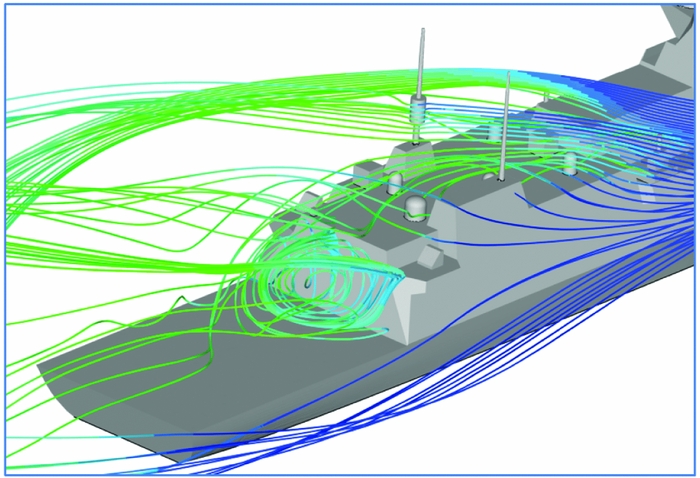
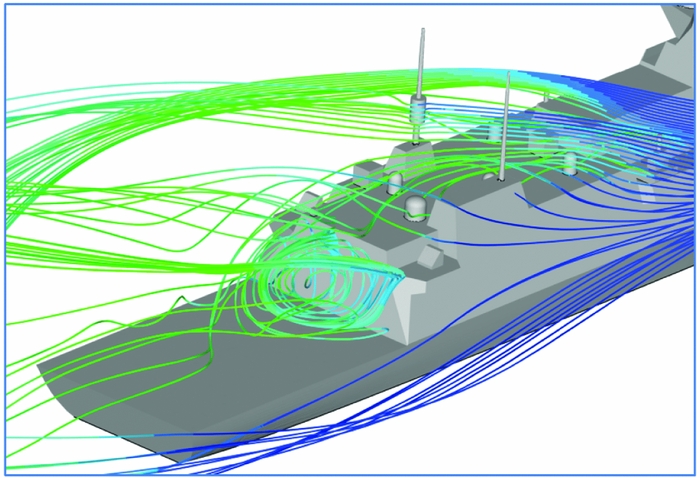
An example of how the VAD technique has been used in practice is the assessment of superstructure design features on a future British frigate that is currently in the design phase. Figure 20 shows the air flow over a superstructure that has a number of features above the hangar and close to the landing deck. The VAD technique was used to evaluate different design configurations to assess their likely impact on the ship airwake and on the aerodynamic loading of the helicopter.
Virtual AirDyn assessment of future frigate superstructure aerodynamics.
As well as evaluating the effect of ship superstructure designs on the flight dynamics and handling qualities of a maritime helicopter, modelling and simulation can be used to assess other aspects of the ship's design that will affect helicopter operations. For example, the air flow over the ship also affects the ship's anemometers and the dispersion of the ship's engine exhausts, both of which have consequences for the ship's helicopter, and both of which can be investigated as part of the ship's design.
7.2 Anemometer placement
The accuracy of the ship's anemometers is important because they both define the SHOL at the outset of the ship's service, and the wind-over-deck conditions for every sortie thereafter; unreliable anemometers lead directly to unnecessarily restricted SHOLs.
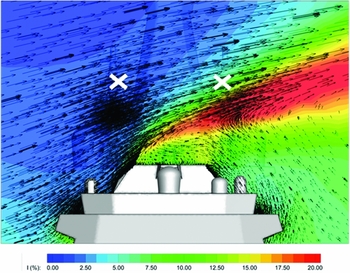
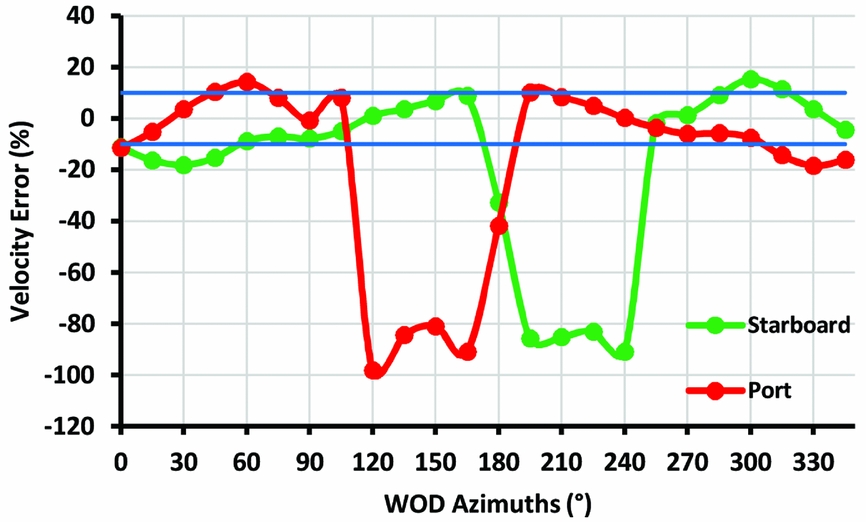
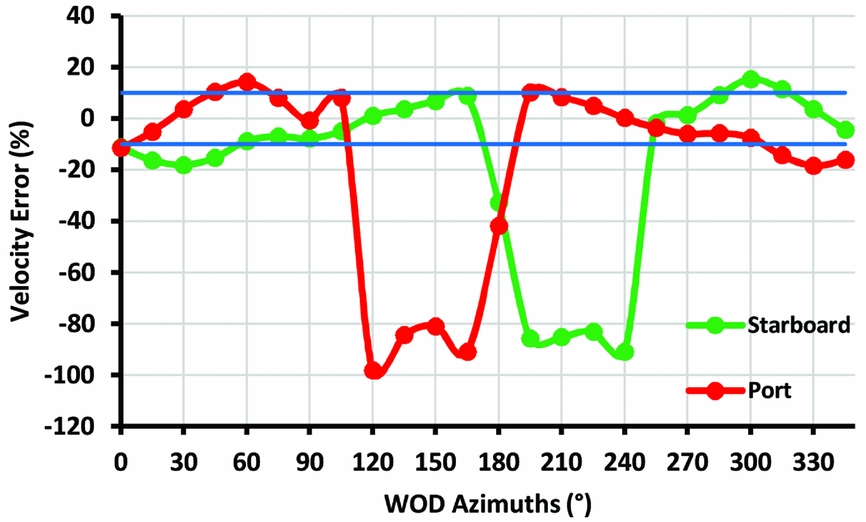
In a study of how a bulky foremast, typical of those appearing on modern warships, affects the flow around the traditional anemometer locations, Mateer et al(Reference Scott, Owen and White24) used CFD to demonstrate the flow distortion. Figure 21 shows the mean velocity vectors and contours of turbulence intensity for the flow in the vicinity of the main mast of a conceptual future frigate. The crosses indicate typical anemometer positions that have been selected because they are above the shear layer that forms as the air flow (in this case, a starboard beam wind) rises above the superstructure and separates to create a strong shear layer (the red shading) and a slow recirculating wake in the port side lee of the superstructure. Using unsteady CFD, the local three-dimensional velocity components at the proposed anemometer positions can be evaluated, thereby predicting the unsteady wind speeds and directions that the anemometers would record. Figure 22 shows the deviation of the mean velocities in the horizontal plane from the undisturbed incoming wind velocity (i.e. as for a ship's anemometer, not including the vertical components). Ships’ anemometers are expected to record wind speeds that are within ±10% of the true relative wind speed and so in-situ calibration tests will be required if the anemometers are placed in these positions.
Contours of turbulence intensity with velocity magnitude vectors in a 40 Kn 90° beam wind(Reference Scott, Owen and White24).

Predicted percentage deviation of wind speed at anemometer locations(Reference Scott, Owen and White24).
7.3 Ship engine exhaust gas dispersion
The issue for ship engine exhaust gas dispersion, which can either be gas turbine or diesel exhaust, is partly due to concern over crew comfort and surface heating; but in the context of this paper, the main concern is that if the helicopter is immersed in the exhaust plume, the heated ambient air will have a lower density and this will reduce the lift generated by the main rotor. Elevated and unsteady air temperatures can also have an effect on the helicopter's engine power. While there are no formal requirements for limiting air temperature rises over a naval ship's helicopter deck, there is guidance for offshore oil/gas platforms where industrial gas turbines are used for power generation. The UK Civil Aviation Authority has published advice in document CAP 437 “Standards for Offshore Helicopter Landing Areas”(25); the statement of the temperature criterion in CAP 437 includes: “when the results of wind-tunnel or CFD modelling indicate a temperature rise of more than 2°C, averaged over a 3-second period, the helicopter operator should be consulted at the earliest opportunity so that appropriate operational restrictions may be applied.” This statement recognises that there will be occasions when the criterion cannot be met, so pilots may be required to take measures such as avoiding the exhaust plume when close to the rig, adjusting the payload accordingly, and generally exercising care.
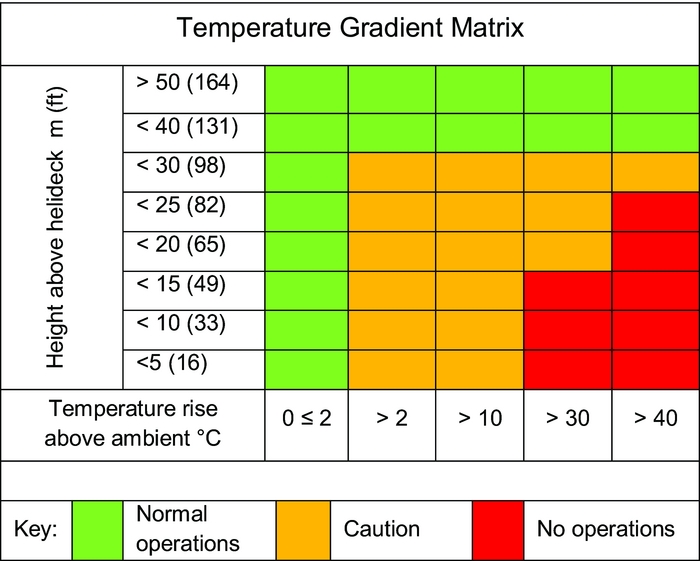
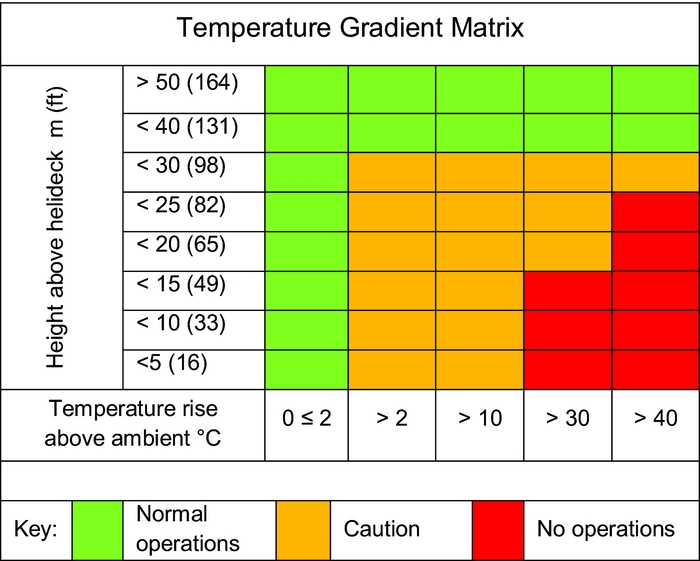
There is similar but more flexible advice given to offshore platform operators working in Norwegian waters, where the NORSOK Standard C-004(26) discusses air temperatures in terms of mean values and does not mention the 3-second time interval. The Standard recommends that CFD modelling be used to predict air temperature rises above the landing deck from gas turbine exhaust and that these be referred to the Temperature Gradient matrix shown in Fig. 23. Depending on where the temperature/height data point falls, the Matrix then recommends normal operations, caution, or no operation, corresponding to the green, amber and red sections of the Matrix. It can be seen that caution is triggered by a 2°C temperature rise, and no operation by a 30°C rise. The cautionary measures will be similar to those in CAP 437, i.e. avoid the exhaust plume when close to the rig, adjust payload accordingly, and exercise care; advice that may not always be acceptable during naval operations.
NORSOK chart(26) showing levels of temperature rise over the flight deck and associated guidance to helicopter operators.
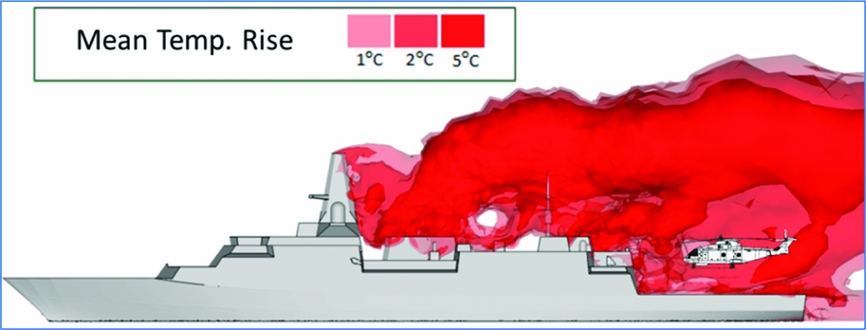
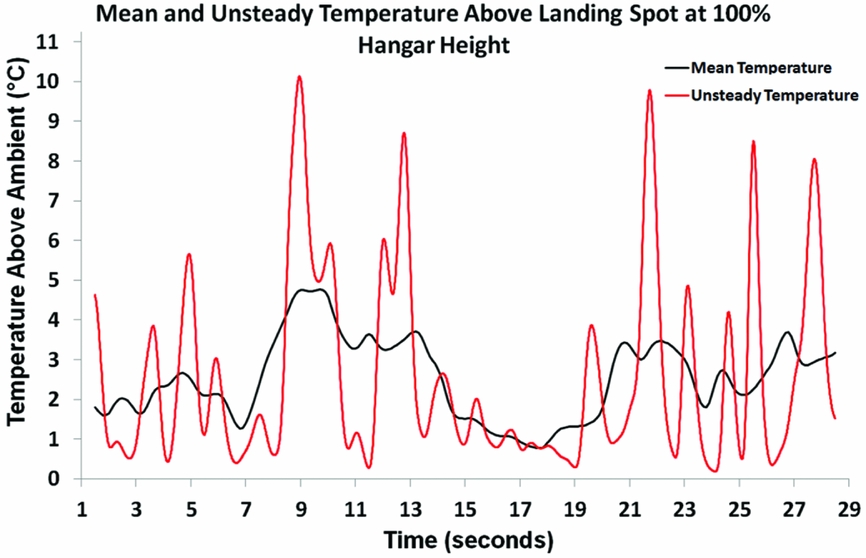
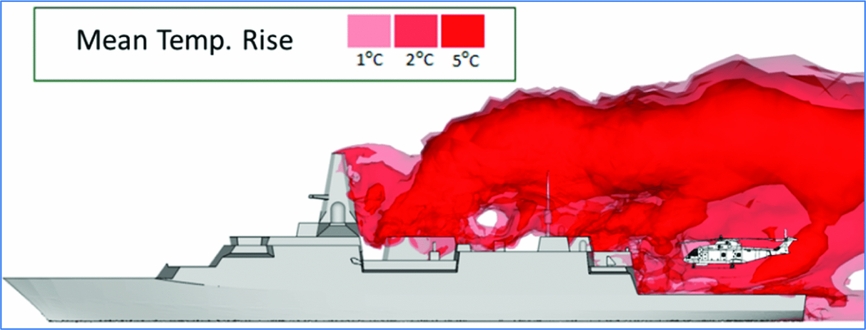
Scott et al(Reference Scott, White and Owen27) considered the temperature criteria adopted by the offshore oil and gas industry in the context of the engine exhaust from a modern warship powered by a combination of diesel and gas turbine engines. Figure 24 shows an instantaneous image of iso-surfaces of temperature within an unsteady airwake with entrained exhaust gas over a ship, along with a superimposed image of a helicopter over the deck; the ship is in a headwind. As can be seen, the unsteady airwake causes ‘dollops’ of hot gas to be convected over the landing deck and, as can be seen in Fig. 25, the temperatures are predicted to peak at 10°C above ambient; the 3-second average referred to in CAP 437 also show that the 2°C limit is exceeded, and for these conditions the NORSOK matrix in Fig. 23 advises ‘caution’. It is noticeable that the exhaust gas temperatures of about 500°C from the ship's gas turbine engines have significantly reduced due to mixing with the highly unsteady airwake. It can also be seen that the hot gases from the gas turbine exhaust are entrained into the recirculation zone in the wake of the ship's mast, another design consideration from the perspective of surface heating and the ship's thermal signature.
Instantaneous iso-surfaces of unsteady ship exhaust plume temperatures(Reference Scott, White and Owen27).
CFD-predicted air temperatures above landing deck – instantaneous and 3-second average(Reference Scott, White and Owen27).

8.0 CONCLUDING COMMENTS
This paper has given a brief overview of the research into helicopter-ship flight simulation that has been conducted at the University of Liverpool over the past decade or more. The research has made considerable progress, and has often been undertaken in collaboration with international research groups as well as with the UK's ship designers and builders and naval helicopter community. Simulated SHOL testing to replace at-sea trials is still some way off, but it is now possible to explore the limits of the helicopter's operational envelope so that when SHOL trials are conducted, priority can be given to properly determining the limits for the more restrictive wind conditions.
Both piloted and non-piloted simulation are being used to inform the design stage of real ships, and the research into simplified ship geometries has given very useful insight into the kinds of superstructure features that create adverse flying conditions. The creation of the CFD airwakes is still expensive and time-consuming, even with modern computing resources, so while the techniques can be deployed during a ship's design, they should be used carefully at key stages in the design cycle.
Modern developments in ship design, such as radar cross-section reduction, large integrated masts and gas turbine engines are significantly affecting the ship's aerodynamics and will have consequences for the helicopter's operational envelope, so their development should be taken forward with the helicopter in mind.
ACKNOWLEDGEMENTS
The authors are grateful to Ansys Inc for their continued support, and to BAE Systems.