Healthcare-associated infection (HAI) surveillance data are essential for hospital infection prevention and quality improvement programs, especially now that HAI data are used for state and federal quality measurement and public reporting. 1 , 2 Variation in HAI measures is intended to reflect differences in healthcare quality. However, this variation may also reflect differences in non-modifiable patient risk factors (eg, age, comorbidity, severity of illness) in the populations served. Several measures used in the Centers for Medicare and Medicaid Hospital Inpatient Quality Reporting Program, for example, the 30-day readmission and mortality measures, 3 are risk adjusted at the patient-level using claims-based data to account for differences among patient populations and to facilitate accurate comparisons of performance between hospitals. To optimize interpretation and use of HAI data, it is ideal to include risk adjustment for known differences in relevant patient characteristics.Reference Sax and Pittet 4 – Reference McGregor and Harros 10
The Centers for Disease Control and Prevention (CDC) National Healthcare Safety Network (NHSN) uses surveillance data to generate a variety of HAI measures, several of which are used for quality reporting purposes. 2 The measures generated are routinely calculated and risk-adjusted using various facility, unit, or patient-level characteristics, which are reported directly into to the NHSN by trained staff from participating facilities.Reference Mu, Edwards, Horan, Berrios and Fridkin 8 , Reference Dudeck, Weiner, Allen-Bridson, Malpiedi and Peterson 11 Inclusion of pertinent patient-level characteristics, as for NHSN surgical site infection surveillance,Reference Mu, Edwards, Horan, Berrios and Fridkin 8 is desirable to facilitate meaningful interfacility comparisons.Reference Sax and Pittet 4 – Reference McGregor and Harros 10 , Reference Iezzoni 12 , Reference Tenrani, Phelan, Cao, Billilek and Datta 13 However, identification of the relevant set of characteristics is challenging, and routine collection of data for all individual patients within a hospital can be impractical and burdensome.
Case mix index (CMI) based on the Medicare Severity diagnosis-related group (DRG) coding system, the most widely used inpatient billing and reimbursement standard in the United States, has been used as an indicator of facility-level disease severity when patient-level data are unavailable.Reference Mendez, Harrington, Christenson and Spellberg 14 – Reference Kuster, Ruef and Bollinger 16 After discharge, patients are assigned to a DRG based on diagnosis and procedure codes, the presence of complications or comorbidity, age (infant or adult), gender, and discharge status. Each DRG has a relative weight assigned (and updated annually), and CMS payments are made proportional to this weight; higher DRG weights receive higher reimbursement. CMI represents the average DRG weight for a hospital and is the sum of the weights of a facility’s DRGs divided by the number of admissions during the time frame of interest (eg, a month, quarter, or year). Importantly, CMI is intended to reflect the clinical complexity and resource consumption of the population of patients within a hospitalReference Mendez, Harrington, Christenson and Spellberg 14 ; it is not a specific indicator of severity of illness. Derived from administrative data, CMI is affected by variations in documentation and coding practices between institutions and over time.Reference Iezzoni 12 , Reference Rosenbaum, Lorenz, Luter, Knowles-Ward, Kelly and Weil 15 , Reference Steinwald and Dummit 17 Despite these limitations, given the absence of individual patient-level data, we sought to evaluate the potential for CMI to be used as a facility-level disease severity proxy for risk adjustment of HAI data. We used NHSN facility-wide Laboratory identified (LabID) Clostridium difficile infection (CDI) event data as an initial example.
METHODS
NHSN Laboratory-Identified Clostridium difficile Infection Event Definitions and Variables
Standard NHSN LabID event definitions 18 were applied to categorize reported events as healthcare facility-onset (HO), community-onset (CO), or community-onset healthcare facility-associated (CO-HFCA). Hospital CDI incidence (HO events) rate per 10,000 patient days was used as the outcome (dependent variable) to evaluate the following independent variables for risk adjustment: hospital size (number of beds), hospital teaching status, CDI test type used, and the CDI prevalence (CO events) rate per 100 patient admissions (a measure of the volume of the community-onset CDI presenting to a hospital). As is routine for the NHSN, 18 CO-HFCA events, which represent the CO events attributed to the reporting hospital, were removed from the calculation of the CDI prevalence rate, leaving only the CO events presenting from other facilities in the CDI prevalence rate. The existing model used for risk adjustment of facility-wide LabID CDI events data is described in detail elsewhere. 19
Data Sources and Study Population
Two data sources were used for this analysis: LabID CDI event data for 2012 from the NHSN, and the CMS Acute Inpatient Prospective Payment System (IPPS) Impact file for the fiscal year 2012 20 to obtain CMI by facility CMS certification number (CCN). CCN was included in both datasets and used as the primary variable to merge the NHSN data with an associated CMI value. Additional information common in both datasets such as state, city, and zip code were used as secondary variables to verify the matches on CCN were successful. Notably, many-to-one relationships between NHSN data and the CMI value were identified. NHSN data are reported for an individual hospital using a unique NHSN identifier, but CMI values in the CMS Impact file are reported by CCN. To illustrate, a healthcare system consisting of multiple hospitals has multiple unique NHSN identifiers (1 for each individual hospital) but could share a single CCN and, thus, have a common CMI value. All hospitals in the NHSN reporting a CCN, regardless of whether the CCN was associated with multiple hospitals within a system, were included in the analysis.
To be eligible hospitals were required to report facility-wide LabID CDI data to NHSN during 2012 and classified as an acute care hospital; long-term acute care hospitals and critical access hospitals were excluded. Facilities with incomplete or missing denominator data, or with outlier values for CDI incidence or CDI prevalence (n=4), defined as 5 times the interquartile range above the 75th percentile (IQR5), were also excluded. Additionally, hospitals that did not report a CCN to NHSN were excluded (n=32). A total of 36 acute care hospitals (2.4%) were excluded from the analysis; the final number of facilities eligible for further analysis was 1,468.
Statistical Approach
Negative binomial regression, a generalization of Poisson regression suitable for the analysis of count data with overdispersed outcome variables,Reference Hilbe 21 was used to analyze the data. Each independent variable was evaluated to identify the best parameterization for inclusion in the model and to determine whether there was a significant association with CDI incidence. All variables with P<.20 in univariate analyses were included in the final model. A multivariate model was built using stage-wise selection, with the sequential addition of variables to identify the best final model. Variables were retained in the final model if P<.05. The fit of various models was compared using the Akaike information criterion (AIC), with smaller values indicating better fit, and by calculating pseudo-R2 based on model dispersion parameter suitable for use with negative binomial regression.Reference Hilbe 21 – 23 While the interpretation is not the same as for the R2 measure in linear regression (ie, the proportion of variability explained by the model), pseudo-R2 measures are valid and useful in evaluating multiple models predicting the same outcome from the same dataset, as in this analysis. Their values range from 0 to 1 and take on higher values for better-fitting models. All statistical analyses were performed using SAS version 9.3 software (SAS Institute Inc, Cary, North Carolina). All reported P values are 2-sided, and P<0.05 was considered statistically significant.
RESULTS
Participants
Of the 1,468 inpatient acute care hospitals reporting data to the NHSN that met the inclusion criteria, 1,429 (97.3%) had matching records in the CMS IPPS Impact file. Most often (for 92% of 1,429 hospitals), there was a single CCN for each hospital in the NHSN. For the remaining 8%, between 2 and 5 unique hospitals in the NHSN were associated with a single CCN and consequently had a common CMI value with those hospitals sharing a CCN.
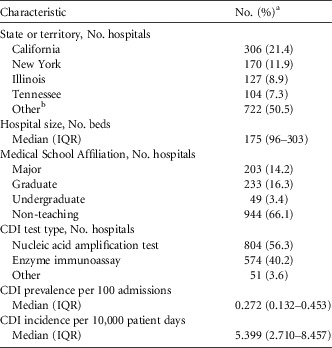
Among the 1,429 hospitals, a total of 39,725 HO CDI events and 54,472,047 patient days were reported, with a pooled mean incidence of 7.293 per 10,000 patient days. The variability in NHSN facility characteristics is summarized in Table 1.
Characteristics of Acute Care Hospitals Reporting Laboratory-identified Clostridium difficile Infection (CDI) Events to the National Healthcare Safety Network, 2012

NOTE. IQR, interquartile range.
a Unless otherwise noted.
b 47 states or territories, range, 1–63 hospitals.
Case Mix Index
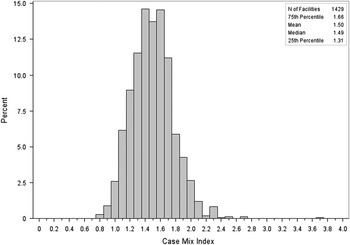
Among the 1,429 hospitals, the median hospital CMI was 1.49 (interquartile range, 1.307–1.664), and ranged from 0.8 to 3.8 (Figure 1); most hospitals (94.1%) had a CMI value between 1.0 and 2.0.
Distribution of case mix index (CMI) for acute care hospitals reporting facility-wide laboratory-identified Clostridium difficile infection events to the National Healthcare Safety Network, 2012.

Univariate Analysis
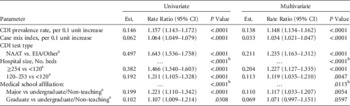
A list of the variables available for analysis is summarized in Table 2. Each of the variables had P<.05 and were thus included in multivariate modeling. The variable CMI was significantly associated with CDI incidence; a 0.1 unit increase in CMI was associated with a 6.4% increase in CDI incidence.
Predictors of Healthcare Facility-Onset Clostridium difficile Infection (CDI) Events by Univariate and Multivariate Analyses among Inpatient Acute Care Hospitals Reporting Laboratory-Identified Events to the National Healthcare Safety Network, 2012

NOTE. NAAT, nucleic acid amplification test; EIA, enzyme immunoassay.
a Referent group.
b Main effect P value.
Multivariate Analysis
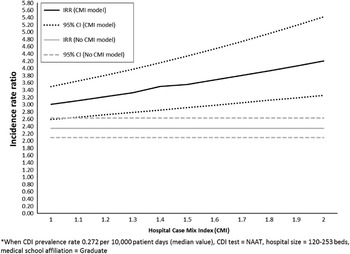
In multivariate modeling, all of the variables remained significant, independent predictors of CDI incidence (Table 2). The predictor of CDI incidence with the best fit (lowest AIC) and the highest rate ratio was CDI prevalence. When controlling for the other variables in the model, with every 0.1 unit increase in CDI prevalence (increase of 0.1 per 100 admissions), there was a 14.8% increase in the CDI incidence rate. The second best fitting predictor with the next highest rate ratio was CMI; every 0.1 unit increase in CMI (on a scale of 0.000 to 4.000) resulted in a 3.4% increase in the CDI incidence rate, after controlling for CDI prevalence, CDI test type use, hospital size, and medical school affiliation (Figure 2).
Modelled change in National Healthcare Safety Network healthcare facility-onset. *Clostridium difficile infection incidence rate ratio per 0.1 unit increase in hospital case mix index (CMI).

Model Fit
The multivariate model including only the 4 NHSN variables (ie, CDI prevalence per 100 admissions, CDI test type use, hospital size, and medical school affiliation) had an AIC of 9,195.46 and pseudo-R2=0.4980. The model with the 4 NHSN variables and CMI had a lower AIC of 9,172.59 and a marginally higher pseudo-R2 of 0.5142, indicating that the model fit with CMI was improved over the fit of the model without CMI.
DISCUSSION
Our findings suggest that hospital CMI is a significant independent predictor of NHSN HO CDI incidence. After controlling for CDI prevalence rate (the amount of CDI presenting to a hospital), CDI test type, hospital size, and medical school affiliation, hospitals with a higher CMI had a higher CDI incidence rate. To illustrate, given equivalent values of CDI prevalence, CDI test type, hospital size, and medical school affiliation, a hospital with a CMI of 1.66 (the 75th percentile of CMI for hospitals included in this analysis), would be predicted to have a 12% higher incidence rate of HO CDI compared with a hospital with a CMI of 1.31 (the 25th percentile). This finding is important because use of CMI for CDI risk adjustment represents the use of a factor beyond those routinely collected in NHSN, and one that represents the patient population served by a hospital.Reference Anderson, Chen, Sexton and Kaye 6 , Reference McGregor and Harros 10 Additionally, CMI is attractive for risk adjustment of HAI data because it is a hospital-level metric already known to administrators and clinicians, is a single value obtained easily from administrative data, and its use requires no additional patient-level data collection by infection preventionists.
CMI was designed for hospital payment purposes, and as such, CMI is higher when patients use more resources and care is more expensive, but it is not necessarily higher for patients with the most severe disease.Reference Mendez, Harrington, Christenson and Spellberg 14 Nevertheless, CMI has often been used as an indicator to represent facility-level severity of illness or acuity,Reference Tenrani, Phelan, Cao, Billilek and Datta 13 – Reference Kuster, Ruef and Bollinger 16 , Reference Yang and Reinke 24 – 27 even though its role in the risk adjustment of HAI data is not yet clear. In a study of bloodstream infection (BSI) in a single long-term acute care hospital, no change in CMI was noted over a 24-month intervention period,Reference Munoz-Price, Hota, Stemer and Weinstein 25 perhaps suggesting that CMI is more useful for interfacility rather than intrafacility comparisons. In a group of Swiss hospitals, antibiotic use (defined as daily doses per 100 bed days) had a significant, positive correlation with CMI at both the department level and the hospital level.Reference Kuster, Ruef and Bollinger 16 In a study of 70 US academic medical centers,Reference Polk, Hohmann, Medvedev and Ibrahim 26 hospital-wide adult antibacterial drug use (defined as days of therapy and length of therapy per 1,000 patient days) was not significantly correlated with CMI. In a report of hospital methicillin-resistant Staphylococcus aureus (MRSA) and vancomycin-resistant Enterococcus (VRE) BSI data from the California Department of Public Health, 27 hospital CMI values were included alongside their BSI incidence rates in an attempt to “... indicate whether a hospital serves patients with higher or lower severity of illness.” While risk adjustment was not performed, the report indicates an association between CMI and VRE BSIs, but not MRSA BSI. Differences in the settings, outcomes under study, variables evaluated, and methods used have generated inconsistent findings with respect to the use of CMI. Given its appeal as a simple proxy measure of hospital-level severity of illness, the use of CMI for risk adjustment of HAI data warrants further evaluation.
There are several limitations to report. First, some NHSN facility types were excluded from this analysis due to a difference in the distribution of CDI incidence rates (Long-term Acute Care and Critical Access Hospitals) or because a CMI value was not available in the CMS IPPS Impact files (Indian Health Service, Military, or Veterans Affairs hospitals). It is, therefore, unknown whether our findings are applicable outside of acute care hospitals. Second, 8% of hospitals included shared a CMI value with 1 or more other hospitals under a single CNN. This overlap most likely limits the ability of CMI to predict CDI incidence, and, therefore, the impact of CMI on risk adjustment should be considered somewhat conservative. Third, it is possible that patients with healthcare-facility onset CDI were assigned to a DRG with a higher weight, potentially increasing hospital CMI value; however, we anticipate that any increase in CMI was negligible. Fourth, the CMI obtained from the CMS IPPS Impact file were calculated using DRGs only from Medicare discharges; these values may not be equivalent to a CMI based on all patients within a hospital. While other measures of CMI exist, such as the All-Patient Refined DRG system,Reference Rosenbaum, Lorenz, Luter, Knowles-Ward, Kelly and Weil 15 , Reference Lagman, Walsh, Davis and Young 28 , 29 they were not available for our analysis.
Exploring the use of CMI represents the initiation of work at the CDC to identify additional factors outside of the NHSN that may be suitable candidates for risk adjustment of HAI data. The use of CMI for risk adjustment of other NHSN measures, such as LabID MRSA bacteremia and antibiotic use measures, is underway. Additional work is necessary to determine the feasibility of routinely obtaining and incorporating hospital CMI into NHSN risk adjustment approaches. Though much debate continues around which set of patient-level factors is appropriate for risk adjustment of various healthcare quality measures,Reference Sax and Pittet 4 – Reference McGregor and Harros 10 , Reference Tenrani, Phelan, Cao, Billilek and Datta 13 , Reference Lipstein and Dunagan 30 , Reference Fiscella, Burstin and Nerenz 31 ultimately, it is the intent of the NHSN to move toward the use of more patient-level data for risk adjustment to improve the accuracy of the HAI measures generated.Reference McKibben, Horan, Tokars, Fowler and Cardo 5 , Reference McGregor and Harros 10 To minimize the burden of such additional data collection, NHSN has developed infrastructure for hospitals and electronic health record (EHR) vendors 32 to enable automated collection and collation of data for NHSN reporting. However, until such patient-level data are available, facility-level proxies of clinical complexity like CMI will continue to be attractive for risk adjustment purposes.
CMI is a single measure that reflects the clinical complexity and resource consumption of patients within a hospital. Its use for risk adjustment is intended to represent differences in the patient populations served. We found CMI to be significant predictor of NHSN HO onset CDI for acute care hospitals, even after adjustment for other NHSN variables (CDI prevalence rate, CDI test type, hospital size, and medical school affiliation). Further exploration of methods to improve risk adjustment of NHSN data, including but not limited to CMI, will continue.
ACKNOWLEDGMENTS
Financial support. No financial support was provided relevant to this article.
Potential conflicts of interest. All authors report no conflicts of interest relevant to this article.
DISCLAIMER. The findings and conclusions in this report are those of the author(s) and do not necessarily represent the official position of the Centers for Disease Control and Prevention.