Introduction
Patients with asthma typically complain of wheeze, cough and breathlessness as a consequence of lower airways inflammation and airflow obstruction. In addition to lower airways inflammation, nasal disease can cause symptoms which overlap with or aggravate those of asthma. Epidemiological data for the prevalence of allergic rhinitis estimate that it coexists with asthma in 30–80% of patients.Reference Simons1 The impact of allergic rhinitis on asthma has been comprehensively documented.Reference Bousquet, van Cauwenberge and Khaltaev2 The prevalence of nasal polyps in asthmatic patients has been found to be between 7 and 15 per cent,Reference Larsen3 with a higher frequency in those over 50 years and those intolerant of aspirin (36 per cent).Reference Settipane4 Nasal symptoms are protean and occur commonly in asthmatic patients.Reference Pedersen and Weeke5, Reference Blair6 It is not clear how such symptoms relate to specific nasal pathology; therefore, in clinical respiratory practice it is difficult to know which patients will benefit from consulting an ENT surgeon.
The purpose of our study was to characterise the spectrum of nasal symptomatology and nasendoscopic abnormalities in patients attending an asthma clinic. We sought to examine the predictive value of key symptoms for objective nasal abnormalities. This evaluation was conducted in parallel with assessment of airway physiology and laryngeal disease, the results of which are reported separately.Reference Stanton, Sellars, Dunnet, MacKenzie, Carter and Bucknall7–Reference Stanton, MacKenzie, Carter and Bucknall9
Methods
All patients attending the problem asthma clinic at Glasgow Royal Infirmary were eligible for inclusion. Patients attending this clinic broadly fell into two groups: those who had recently been admitted to hospital with an exacerbation of asthma, who usually required a brief period of treatment optimisation; and a larger group of patients with asthma that was difficult to control, who often had frequent exacerbations and ongoing symptoms. Initially, 121 letters of invitation to take part in the study were sent to patients attending the clinic. If no response was obtained, attempts to reiterate the invitation were made by telephone or in person during clinic consultations. Additional patients from the clinic, who had not received a letter, were also invited to participate. Sixty patients agreed to take part in the study (17 of whom subsequently withdrew) and 27 declined outright. Further attempts to contact the remaining patients for recruitment were unsuccessful. Forty-three patients were ultimately included in the protocol, which involved attendance on a single afternoon.
This study was approved by the North Glasgow University Hospitals National Health Service Trust local research and ethics committee (reference number 03RE002). All patients gave a written statement of informed consent for their participation in the study.
The following measurements were made.
Asthma morbidity and treatment
Baseline data on current asthma treatment and symptoms of asthma morbidityReference Pearson and Bucknall10 were recorded, using the Royal College of Physicians three-symptom score, i.e. days and nights affected by asthma symptoms, and days of limited activity due to asthma, over the previous seven days (this score therefore ranged from zero to 21, with a higher score indicating more severe symptoms).
Pulmonary function testing
Standard spirometry and flow volume loops were measured using a body plethysmograph. Measured variables included forced expiratory volume in one second (FEV1) and forced vital capacity. All pulmonary function tests were performed according to the guidelines of the British Thoracic Society and the Association of Respiratory Technicians and Physiologists.11 Predicted normal values were determined using the European Community for Steel and Coal equations for all variables.Reference Quanjer, Tammeling, Cotes, Pedersen, Peslin and Yernault12
ENT assessment
Patients were independently reviewed by a consultant otolaryngologist (GWMcG) who was blinded to their asthma severity and their results for the above physiological evaluations. Nasal symptoms were recorded, i.e. obstruction, congestion, hyposmia, rhinorrhoea, sneezing, epistaxis and other identified symptoms, graded as none (zero), mild (one), moderate (two) or severe (three), giving a maximum nasal symptom score of 21. Nasendoscopy was performed using a standard 4 mm, 30º rod lens endoscope, following topical decongestion and anaesthesia with co-phenylcaine.
Statistical analysis
The Mann–Whitney U test was used to compare unpaired sets of nominal data. These calculations, along with the confidence interval, statistical significance level and Pearson correlation, were calculated using Minitab (version 14) statistical software. Sensitivity, specificity, positive predictive value and negative predictive value were calculated using conventional methods.Reference Altman13
Results
Baseline characteristics
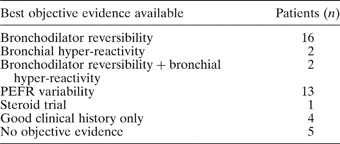
Of the 43 patients recruited, 14 were male and 29 female. Patients' ages ranged from 23 to 78 years, with a median of 43 years. Case notes were reviewed for each patient to determine how securely the diagnosis of asthma had previously been made, as shown in Table I. Nine patients did not have clear, objective evidence of asthma. These patients were still included, as this was an observational survey designed to test the predictive value of nasal symptoms in a difficult asthma population.
Basis of asthma diagnosis in study population

PEFR = peak expiratory flow rate
The majority of patients (27/43, 63 per cent) were receiving British Thoracic Society step four or five treatment (i.e. any treatment combination including more than low dose inhaled corticosteroids and a long-acting beta agonist,14 and including oral corticosteroids at step five); see Figure 1.
Level of asthma treatment in the study group, by British Thoracic Society (BTS) steps: 0 = no asthma treatment; 1 = short-acting β agonists (SABA) only; 2 = SABA + low to moderate dose inhaled corticosteroid (ICS); 3 = low to moderate dose ICS + long-acting β agonist; 4 = as for step 3 + high dose ICS or additional oral anti-asthma therapy (e.g. theophylline or leukotriene antagonist); 5 = as for step 4 + long term oral corticosteroid. Numbers above bars represent totals.

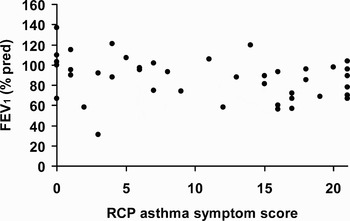
Patients reported the full range of Royal College of Physicians asthma morbidity scores, with a mean score of 10.6 (standard deviation 7.7). Symptom scores bore no relation to degree of airflow obstruction as determined by FEV1 (expressed as a percentage of predicted FEV1); see Figure 2.
Relationship between Royal College of Physicians asthma symptom score and lung function, measured as forced expiratory volume over one second (expressed as a percentage of the predicted value). r = −0.28; p = 0.073

Nasal symptoms
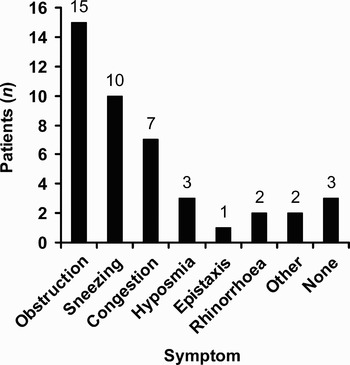
Obstruction was the most common cardinal nasal symptom (15 patients; see Figure 3). All but three patients reported some sort of nasal symptom.
Cardinal nasal symptom reported by study group. Numbers above bars represent totals.

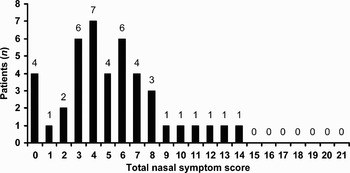
Patients' distribution of nasal symptom scores is shown in Figure 4.
Distribution of total nasal symptom scores in study group. Numbers above bars represent totals.

Patients' overall median nasal symptom score was 5.3 (range zero to 14). The nasal symptom score of the 12 patients taking nasal medication at the time of the study (10 were taking topical nasal steroids and two antihistamines) was marginally higher than that of those not taking nasal medication (nasal symptom score medians of six and four, respectively; p = 0.046 by Mann–Whitney U test; 95 per cent confidence interval for difference −0.001 to −5). There was no correlation between nasal symptom score and severity of asthma symptoms (measured by the Royal College of Physicians score, r = −0.05) or FEV1 (r = 0.01).
Nasendoscopy findings
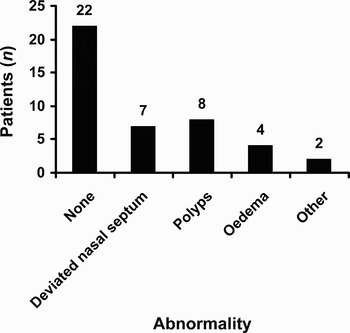
At nasendoscopy, the number of patients with visible structural abnormalities was much less than that of patients with nasal symptoms; 22/43 (51 per cent) patients had a normal endoscopic appearance. Abnormal findings at nasendoscopy are shown in Figure 5. The ‘other’ findings category comprised vestibulitis (n = 1) and accessory sinus ostia (n = 1, not thought to be pathological).
Nasendoscopy findings. Numbers above bars represent totals.

The nasal symptom scores of patients with oedema and polyps were higher (medians of seven and five, respectively) than those of patients with a normal nasendoscopy and those with a deviated nasal septum (both had medians of four); however, none of these differences reached statistical significance.
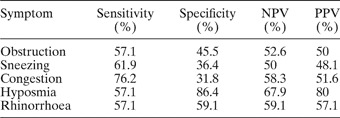
Initial analysis of the predictive value of individual nasal symptoms for structural abnormality showed a generally poor predictive value (apart from hyposmia; see Table II). Appendix 1 expands these results for individual nasal pathologies.
Prediction of any nasal pathology by individual nasal symptom

NPV = negative predictive value; PPV = positive predictive value
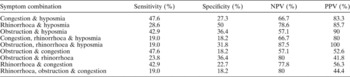
Further analysis of combinations of symptoms was then undertaken (Table III). This revealed that combinations of nasal symptoms were more strongly associated with nasendoscopic abnormality. Analysis showed that symptom complexes which included rhinorrhoea (commonly reported by patients) were very insensitive or had a poor predictive value; however, symptom complexes that included hyposmia had a better predictive value for abnormality.
Prediction of any nasal pathology by groups of nasal symptoms

Seven patients with structural abnormalities underwent a change in clinical management on the basis of their nasendoscopy findings. Five patients were started on topical nasal steroids, one was given topical antibiotic ointment and one was listed for surgery to correct a grossly deviated nasal septum.
Discussion
This study assessed nasal symptoms and endoscopic findings in a broad range of patients with asthma, defined in terms of FEV1, Royal College of Physicians symptom scores and British Thoracic Society treatment steps (Figures 1 and 2). The study had no strict inclusion or exclusion criteria, as the principal aim was to characterise, in an observational fashion, the spectrum of nasal symptomatology and nasendoscopic abnormalities in patients attending a problem asthma clinic. As previously discussed, we felt this would produce results that would be more generalisable to routine practice.
We found that nasal symptoms were common in our asthmatic patients, in keeping with previously published work.Reference Pedersen and Weeke5, Reference Blair6 A postal survey of 4300 patients in Finland found a significantly higher incidence of allergic rhinitis in asthmatics than in non-asthmatics (73 vs 40 per cent);Reference Hedman, Kaprio, Poussa and Nieminen15 in comparison, in a survey of 8469 subjects drawn from the general population, the incidence of recurrent nasal symptoms was 26 per cent.Reference Montnemery, Svensson, Adelroth, Lofdahl, Andersson and Greiff16 In the group with self-reported asthma16, there was a higher incidence of recurrent or permanent nasal symptoms (46 per cent). Nasal symptoms were very frequently reported on direct questioning in our small group (40/43; 93 per cent), with rhinorrhoea being reported by 18/43 (42 per cent) patients. A selection bias may have contributed to this result, although patients were also invited to take part in an assessment of lung function and voice, as well as the nose.
• Nasal symptoms are common in patients with asthma
• Prediction of likely benefit from ENT review is difficult in this patient group
• While individual nasal symptoms were poor predictors of individual nasal pathology, hyposmia was the best individual predictor of any abnormality
• Concurrent hyposmia, obstruction and rhinorrhoea were highly predictive of nasendoscopic abnormality and should be seen as an indication for ENT referral
The frequency of structural abnormalities observed at nasendoscopy were less than the reported frequency of nasal symptoms. Hyposmia was the best predictor of nasal abnormalities. Seven patients' management was changed on the basis of their nasal examination; these patients' nasal symptom scores ranged from four to 14 (median six). Although this was higher than the median nasal symptom score for the remaining 36 patients (median four), this difference did not reach statistical significance in this study.
To our knowledge, no previous study has assessed the predictive value of nasal symptoms for the presence of nasendoscopic abnormalities. We did not use a previously proven and well validated questionnaire but rather a simple scoring system (i.e. ‘none’, ‘mild’, ‘moderate’ or ‘severe’) in order to grade a range of common nasal symptoms; this scoring system was easily applicable to an out-patient clinic setting. Our results showed that individual nasal symptoms were poor predictors of nasal pathology, with hyposmia having the best individual predictive value for abnormality (positive predictive value 80 per cent). Combining symptoms increased their predictive value; every patient complaining of obstruction, rhinorrhoea and hyposmia had a nasendoscopic abnormality. The choice of specific symptom combinations was based on their individual predictive values and their frequency as cardinal symptoms.
These pilot data suggest that the threshold for ENT referral should be lower when an asthmatic patient complains of a symptom complex including hyposmia, as the likelihood of finding an abnormality is much higher. Specifically, concurrent hyposmia, obstruction and rhinorrhoea should be seen as an indication for ENT referral.
Validation of this observation, and of the possible impact of adequate treatment of nasal and sinus disease on lower airway hyper-reactivity, is worthy of further study.
Acknowledgements
This work was supported by the Ritchie Trust Research Fellowship from the Royal College of Physicians and Surgeons of Glasgow. The authors are most grateful to Dr Alex McConnachie, Robertson Centre for Biostatistics, University of Glasgow, for advice on statistical analysis.
APPENDIX 1
Prediction of nasal pathology by individual nasal symptoms

NPV = negative predictive value; PPV = positive predictive value; DNS = deviated nasal septum