High rates of inattentive classroom behaviors have severe consequences for children's academic achievement and attainment; at school entry, they predict an academic future characterized by low grades, poor test scores, and a reduced likelihood of high school graduation (Breslau et al., Reference Breslau, Miller, Breslau, Bohnert, Lucia and Schweitzer2009; Duncan et al., Reference Duncan, Dowsett, Claessens, Magnuson, Huston and Klebanov2007; Hinshaw, Reference Hinshaw1992; Pingault et al., Reference Pingault, Tremblay, Vitaro, Carbonneau, Genolini and Falissard2011). Classroom inattention shows moderately high stability during the elementary school years, supporting the hypothesis that inattention represents a fairly stable individual characteristic (Willcutt et al., Reference Willcutt, Nigg, Pennington, Solanto, Rohde and Tannock2012). Nevertheless, some researchers have argued that population-based, variable-oriented analyses mask discontinuities that characterize the classroom inattention of some children, including subgroups who show reductions or increases in inattention over the course of the early elementary grades (Pingault et al., Reference Pingault, Tremblay, Vitaro, Carbonneau, Genolini and Falissard2011; Rabiner, Coie, & Conduct Problems Prevention Research Group, Reference Rabiner and Coie2000).
This study adds to the very limited research on this topic by examining continuities and discontinuities in the developmental course of inattention during the early elementary years. The first aim of this study was to estimate developmental trajectories of classroom inattention from kindergarten through third grade in a sample of children from low-income families. The second aim was to examine the fifth-grade academic outcomes of children exhibiting different trajectories of classroom inattention. The third aim was to explore child executive function skills and oppositional–aggressive behaviors in prekindergarten and context variables (family socioeconomic status [SES], single-parent family status, and elementary school quality) that might account for discontinuities in classroom inattention, including those that might enable children to overcome initial inattention and those that might predict increasing inattention over time.
Inattention and School Attainment
A substantial body of research suggests that classroom inattention impairs academic attainment (Breslau et al., Reference Breslau, Miller, Breslau, Bohnert, Lucia and Schweitzer2009; Pingault et al., Reference Pingault, Tremblay, Vitaro, Carbonneau, Genolini and Falissard2011). Classroom inattention, usually assessed using teacher ratings, reflects behaviors such as distractibility, difficulty following directions and sustaining concentration, and trouble finishing assigned tasks (DuPaul, Reference DuPaul1991; Hinshaw, Reference Hinshaw1992). Being able to attend effectively in the classroom is considered a proximal gateway to academic learning, because it increases a child's exposure to classroom instruction and supports active participation in learning activities (Stipek, Newton, & Chudgar, Reference Stipek, Newton and Chudgar2010). When children are unable to attend to instruction or sustain attention during learning activities, it impairs academic skill development and impedes their progress through school (Breslau et al., Reference Breslau, Miller, Breslau, Bohnert, Lucia and Schweitzer2009). For example, using data from six longitudinal data sets, Duncan et al. (Reference Duncan, Dowsett, Claessens, Magnuson, Huston and Klebanov2007) documented robust associations between inattention at school entry and reduced academic achievement in later school years, controlling for prior academic and social–emotional skills.
Classroom inattention is multiply determined, affected both by the child's neurodevelopment and cognitive capacity to control attention (see Ruff & Rothbart, Reference Ruff and Rothbart1996) and by situational and motivational factors that affect on-task behavior (Rabiner et al., Reference Rabiner, Murray, Rosen, Hardy, Skinner and Underwood2010). At high levels, inattentive behavior is a defining feature of attention-deficit/hyperactivity disorder (ADHD; American Psychological Association [APA], 2000; Willcutt, Reference Willcutt2012). However, inattention also appears to be continuously distributed, and a substantial body of research suggests that even subclinical levels of classroom inattention impair academic attainment (Breslau et al., Reference Breslau, Miller, Breslau, Bohnert, Lucia and Schweitzer2009; Pingault et al., Reference Pingault, Tremblay, Vitaro, Carbonneau, Genolini and Falissard2011).
Inattention is often considered an individual trait, supported by longitudinal studies of teacher-rated inattention that show stability for periods range = 1 to 5 years (Willcutt et al., Reference Willcutt, Nigg, Pennington, Solanto, Rohde and Tannock2012) and by evidence of substantial heritability (Ebejer et al., Reference Ebejer, Coventry, Byrne, Willcutt, Olson and Corley2010; Gjone, Stevenson, & Sundet, Reference Gjone, Stevenson and Sundet1996). Consistent with this perspective, a person-oriented analysis of parent-rated inattention assessed annually from 17 months through age 8 showed three stable groups, reflecting high, medium, and low levels of inattention (Galéra et al., Reference Galéra, Bouvard, Lagarde, Michel, Touchette and Fombonne2012).
In contrast, a few studies suggest that developmental discontinuity characterizes the inattention of some subgroups of children. For example, using three samples of elementary-aged children, Rabiner et al. (Reference Rabiner, Murray, Rosen, Hardy, Skinner and Underwood2010) examined the cross-grade stability of elevated teacher-rated inattention. In each of the samples, even one in which children met full diagnostic criteria for ADHD, elevated inattention persisted across grades for only 33%–46% of children. In a recent person-oriented analysis of classroom inattention, Pingault et al. (Reference Pingault, Tremblay, Vitaro, Carbonneau, Genolini and Falissard2011) estimated developmental trajectories for a representative sample of 2,000 Canadian youth followed longitudinally from ages 6 to 12 years. In this study, four trajectories of inattention were observed: stable low (46.3%), declining (19.3%), rising (17.6%), and stable high (16.8%). Following children in the same age range (6–12) in a Norwegian sample, Robbers et al. (Reference Robbers, van Oort, Polderman, Bartels, Boomsma and Verhulst2011) examined trajectories of parent-rated attention problems, and also found stable low (62%–71%), declining (14%–21%), and rising (15%–18%) trajectories, but no stable high trajectory. Additional research is needed to determine whether the declining and rising trajectory profiles of inattention found in these studies emerge reliably in a US sample at-risk for elevated rates of inattention and academic difficulties in elementary school.
A related and important issue is the degree to which academic attainment is affected by discontinuities in classroom inattention. For example, Breslau et al. (Reference Breslau, Breslau, Peterson, Miller, Lucia and Bohnert2010) found that changes in classroom inattention between the ages of 6 and 11 significantly predicted changes in math and reading achievement between the ages of 11 and 17. Specifically, decreased inattention during the early school years predicted subsequent academic gains, and vice versa, suggesting that changes in classroom inattention may be meaningful for children's adjustment outcomes. At the same time, some research suggests that rates of classroom inattention at school entry may contribute uniquely to later academic attainment, even when inattention increases or decreases in subsequent school years. For example, Pingault et al. (Reference Pingault, Tremblay, Vitaro, Carbonneau, Genolini and Falissard2011) found that, relative to children in the stable low inattention group from ages 6 to 12, the odds of failing to graduate from high school were significantly higher for youth who showed a trajectory of decreasing inattention (odds ratio = 2.76), increasing inattention (3.87), or stable high inattention (7.66), controlling for demographics and concurrent hyperactivity and behavior problems. Rabiner, Carrig, and Dodge (Reference Rabiner, Carrig and Dodge2013) found that children who showed significant inattention (1.5 SD above the sample mean) in first grade had more academic problems than children whose significant attention problems did not emerge until second grade, whether or not the first graders showed persistent or declining inattention in second grade. Classroom inattention in the early school years may reduce children's exposure to instruction in foundational academic skills, including preliteracy and numeracy skills, delaying or impeding subsequent academic skill development (Breslau et al., Reference Breslau, Miller, Breslau, Bohnert, Lucia and Schweitzer2009; Lonigan et al., Reference Lonigan, Bloomfield, Anthony, Bacon, Phillips and Samwel1999), which may account for the sustained impairments in achievement among inattentive kindergarten children, even when their attention improves in the later elementary years.
Factors Associated With Discontinuity in Elementary Inattention
Little is known about the risk and protective factors that might be associated with developmental discontinuities (increases or decreases) in classroom inattention over the course of the early elementary grades. Recent research suggests that developmental delays in self-regulatory skills during preschool may set the stage for classroom inattention in elementary school (Brock, Rimm-Kaufman, Nathanson, & Grim, Reference Brock, Rimm-Kaufman, Nathanson and Grim2009; Raver, McCoy, Lowenstein, & Pess, Reference Raver, McCoy, Lowenstein and Pess2013). In addition, the development of inattention can be affected by characteristics of the family and school context (Miech, Caspi, Moffitt, Wright, & Silva, Reference Miech, Caspi, Moffitt, Wright and Silva1999).
Preschool self-regulatory skills
When children enter kindergarten, demands for self-regulation increase substantially; children must follow rules, comply with teacher directions, manage themselves in a large group, and engage in and persist at goal-oriented learning (Rimm-Kaufman, Pianta, & Cox, Reference Rimm-Kaufman, Pianta and Cox2000). Children growing up in poverty are particularly likely to have difficulties adjusting to school: as many as 40% demonstrate delays in learning behaviors and emergent academic skills, and over 20% exhibit high rates of disruptive behavior in the early school years that undermine school adjustment (Macmillan, McMorris, & Kruttschnitt, Reference Macmillan, McMorris and Kruttschnitt2004).
Recent research has focused increasingly on the role that the preschool development of cognitive self-regulation, particularly executive function (EF), plays in providing a foundation for school success, and in accounting for the negative impact of poverty on school readiness (Blair & Raver, Reference Blair and Raver2012). EF refers to a set of higher order cognitive skills, including working memory, inhibition, and attention shifting that facilitate problem solving and support goal-directed behavior (Zelazo, Carlson, & Kesek, Reference Zelazo, Carlson, Kesek, Nelson and Luciana2008). EF skills are typically measured using standardized tasks designed to challenge children's cognitive self-regulatory capacities under conditions of novel problem solving (Carlson, Reference Carlson2005). Research suggests that EF skills progress rapidly during the preschool years and make important contributions to concurrent improvements in children's classroom attention (Blair & Raver, Reference Blair and Raver2012; Brock et al., Reference Brock, Rimm-Kaufman, Nathanson and Grim2009). Conceptually, prekindergarten children who experience delays in EF development may not be cognitively equipped to navigate the complex demands of the classroom environment after they transition into kindergarten, resulting in elevated levels of inattentive behavior in the classroom. Longitudinal research has linked delays in preschool EF development with later attention problems in elementary school (Berlin, Bohlin, & Rydell, Reference Berlin, Bohlin and Rydell2003; Brocki, Eninger, Thorell, & Bohlin, Reference Brocki, Eninger, Thorell and Bohlin2010; Wåhlstedt, Thorell, & Bohlin, Reference Wåhlstedt, Thorell and Bohlin2008). In addition, EF delays may also account for inattentive behavior that rises over the course of elementary school. That is, as task demands increase over the early elementary grades, children's EF skills may become increasingly taxed; when EF skills are delayed or deficient, inattentive behavior that was not apparent at school entry may emerge (e.g., Lahey, Pelham, Loney, Lee, & Willcutt, Reference Lahey, Pelham, Loney, Lee and Willcutt2005).
Evidence suggests that early deficits in emotion and behavior regulation, as reflected in elevated oppositional–aggressive behaviors during preschool, may also contribute to classroom inattention in elementary school. Oppositional–aggressive behaviors include a failure to comply with adult requests or abide by classroom rules, as well as elevated rates of interpersonal conflict and emotional outbursts. These problems disrupt engagement in the learning process and reduce time “on task” (Stipek & Miles, Reference Stipek and Miles2008), thereby potentially increasing rates of inattentive behavior at kindergarten entry. In addition, to the extent that defiant and noncompliant behaviors allow oppositional–aggressive children to avoid work demands (i.e., negative reinforcement), classroom inattention may increase over time, particularly as academic skill delays increase and children's motivation wanes. Todd et al. (Reference Todd, Huang, Todorov, Neuman, Reiersen and Henderson2008) found that rates of baseline oppositional behavior predicted the longitudinal stability of ADHD-inattentive type diagnoses, perhaps because they undermined student motivation and effortful learning persistence. Rates of preschool oppositional–aggressive behavior are often elevated in low-income samples (Rimm-Kaufman et al., Reference Rimm-Kaufman, Pianta and Cox2000) and may contribute to stable high or rising levels of teacher-rated inattention across the early elementary years.
Family and school contextual risks associated with low SES
Family SES and child attention problems are significantly correlated (Miech et al., Reference Miech, Caspi, Moffitt, Wright and Silva1999), and researchers have suggested that this association stems, in part, from the elevated rates of contextual adversities often experienced by children in low-SES families that are linked with inattention (Blair & Raver, Reference Blair and Raver2012). For example, in two prior longitudinal studies, young children growing up in single-parent (or nonintact) families were more likely than children in two-parent families to exhibit stable high profiles of inattention–hyperactivity rather than profiles involving decreasing or stable low inattention–hyperactivity, even when proximal indicators of parental functioning (e.g., maternal depression, teenage mother, coercive parenting, and mother–child interaction) were accounted for (Galéra et al., Reference Galéra, Bouvard, Lagarde, Michel, Touchette and Fombonne2012; Willoughby et al., 2012).
It is also possible that children's developmental trajectories of inattention may be affected by the quality of the school context experienced during the early elementary years. Children from low-income families are more likely than their peers to experience low-quality school environments, as indexed by student poverty, lower teacher quality, and lower student achievement levels (Jones, Brown, & Lawrence, Reference Jones, Brown and Lawrence2011). Schools serving many disadvantaged and low-achieving students have greater difficulty attracting and retaining high-quality teachers, and have fewer educational resources in general. Research suggests that student achievement levels (an indicator of overall school quality) mediate the effect of poverty on children's need for services (Croll, Reference Croll2002). It may be that high-quality schools provide children with greater predictability, positive emotional support, and greater cognitive stimulation, which may foster the cognitive, emotional, and motivational factors that improve learning engagement and thereby decrease classroom inattention (Pingault et al., Reference Pingault, Tremblay, Vitaro, Carbonneau, Genolini and Falissard2011; Rabiner et al., Reference Rabiner, Murray, Rosen, Hardy, Skinner and Underwood2010).
The Present Study
The current study addressed three key research questions regarding trajectories of inattention across the early school years. First, we examined inattention trajectories from kindergarten through third grade. Consistent with prior studies, it was anticipated that profiles reflecting continuity (stable low and stable high) and discontinuity (rising and declining) would emerge. Second, the fifth-grade academic outcomes of children exhibiting different trajectories of inattention were evaluated. It was expected that elevated inattention, whether stable high, rising, or declining, would increase risk for poor academic outcomes. Based on the findings of Pingault et al. (Reference Pingault, Tremblay, Vitaro, Carbonneau, Genolini and Falissard2011) and Rabiner et al. (Reference Rabiner, Carrig and Dodge2013), it was anticipated that children with stable high inattention would experience the greatest level of academic difficulty, but that children with early inattention would also show significant academic difficulties even if their attention behavior improved in the later school years. Third, we sought to explore preschool self-regulatory functioning (EF and oppositional–aggressive behavior) and aspects of the family and school contexts that might predict discontinuities in inattention. It was predicted that low family SES, single-parent family status, and lower elementary school quality (indexed here by school achievement levels) would increase risk for stable high or rising inattention in elementary school, whereas higher SES, two-parent family status, and high elementary school quality were expected to promote stable low or declining inattention over time. Given that rates of inattention and concurrent oppositional–aggressive behaviors are generally higher among boys, sex was also examined (APA, 2000; Gaub & Carlson, Reference Gaub and Carlson1997; Gershon, Reference Gershon2002).
Method
Participants
Participants were 356 children, recruited from Head Start (17% Hispanic, 25% African American, and 58% European American; 54% girls) and followed longitudinally through fifth grade. At the start of the prekindergarten year, children were, on average 4.59 years old (SD = 0.32, range = 3.87–5.82). Reflecting their participation in Head Start, families were low income, with an average income/needs ratio of .88. Most parents had graduated from high school or attained high-school equivalency certificates (65%), although many had not finished high school (33%). Very few (2%) had finished college. Based on Hollingshead's (Reference Hollingshead1975) Four Factor Index of Social Status, most of the employed parents were working in unskilled or semiskilled labor categories.
During the prekindergarten year, 192 children in this sample received a preventive intervention (Head Start REDI; see Bierman et al., Reference Bierman, Domitrovich, Nix, Gest, Welsh and Greenberg2008), and the other 164 children were in the “usual practice” Head Start control group. This study begins at the end of the intervention, with the posttest assessment as the first wave of data used, and includes five additional waves of data. Four waves of annual elementary school teacher ratings (kindergarten through third grade) were used to assess trajectories of inattention. Predictors of these trajectories were collected at the end of prekindergarten (Wave 1, after the intervention, before the transition into kindergarten). Academic outcomes were assessed in fifth grade (Wave 6).
When assessments were collected at end of the prekindergarten year (Wave 1), children attended 44 classrooms in 25 Head Start centers. As they transitioned to kindergarten through fifth grade (Waves 2–6), children were dispersed across numerous classrooms (range = 195–218), schools range = 82–94), and districts (range = 31–37).
Retention rates across the 6 waves of data were high, with some data collected for 94% of children in kindergarten, 93% in first grade, 88% in second grade, 84% in third grade, and 81% in fifth grade. Most of the children in the original sample (74%) had complete data for the annual teacher ratings (kindergarten through third grade) that were used to estimate developmental trajectories of inattention. Others were missing one (12%), two (5%), or three (3%) ratings. Twenty children (6% of the original sample) had no teacher ratings of inattention and were dropped from analyses. Developmental trajectories of inattention were estimated for the 336 children who had teacher ratings of inattention from at least one assessment from kindergarten through third grade. During estimation of latent profiles, missing data was handled using the full information maximum likelihood technique in Mplus (Muthén & Muthén, Reference Muthén and Muthén2001). There were no statistically significant differences on any baseline study variable between children who were included in the analysis and those who lacked inattention ratings from kindergarten through third grade.
Procedures
Information regarding family background was collected during prekindergarten parent interviews, when informed consent for study participation was obtained. Parents were compensated financially for this interview. At the end of the prekindergarten year, trained examiners assessed the EF skills of children during individual test sessions held at school, and Head Start teachers provided ratings of child oppositional–aggressive behavior. Each year, from kindergarten through third grade, research assistants visited schools to deliver and explain the teacher rating forms; teachers completed ratings of child inattention on their own time and returned them to the project. When children were in fifth grade, trained examiners assessed their academic outcomes during individual testing sessions held at school, and teachers provided ratings of their academic performance and academic motivation. All teachers were compensated financially for completing student ratings. APA ethical standards for the conduct of research were followed in this study, and all procedures were approved by the university institutional review board.
Measures
Inattention
Classroom teachers rated children using the nine-item inattention subscale of the ADHD Rating Scale (DuPaul, Reference DuPaul1991; e.g., “Is easily distracted,” “Has trouble following directions,” “Has trouble staying focused,” and “Doesn't seem to listen”), which is based on the inattention symptoms of ADHD included in the DSM-III-R. Items were rated on a 4-point Likert scale (0 = not at all, 3 = very much), and were averaged such that higher scores reflected greater inattention (α = 0.93–0.94). Consistent with prior research, these teacher ratings were moderately correlated across sequential years (rs = .45–.60).
Executive functions
At the end of the prekindergarten year, EF was assessed by administering three tasks. On the backward word span task, which assessed working memory, children were asked to repeat a list of words in backward order (Davis & Pratt, Reference Davis and Pratt1996). The practice list and the first list each contained two words, and subsequent lists increased to a total of five words. A child's score represented the highest number of words repeated correctly in backward order. For the peg tapping task (Diamond & Taylor, Reference Diamond and Taylor1996), which assessed working memory and inhibitory control, children were required to tap a pencil twice when the interviewer tapped once and to tap once when the interviewer tapped twice. After practice trials, children were administered a series of 16 mixed one-tap and two-tap trials. Children's scores reflect the total number of correct trials (out of 16; α = .084). The dimensional change card sort task (Frye, Zelazo, & Palfai, Reference Frye, Zelazo and Palfai1995) involved target cards that varied along the dimensions of color and shape (e.g., red and blue, rabbits and boats). After learning to sort the cards according to one dimension (shape or color), the children were asked to sort the cards according to the other dimension. Children's scores reflect the total number of trials (out of 6) in which the child correctly shifted sets after the sorting criteria changed (α = 0.92). For preschool children, performance on this task reflected their inhibitory control and attention-shifting abilities (Zelazo et al., Reference Zelazo, Carlson, Kesek, Nelson and Luciana2008). Children's scores on the backward word span, peg tapping, and dimensional change card sort tasks were intercorrelated (r = .28–.35, p < .01). These are commonly used measures of preschool EF, and prior research suggests that a one-factor model best describes the EF of preschool children (e.g., Hughes & Ensor, Reference Hughes and Ensor2007; Wiebe, Espy, & Charak, Reference Wiebe, Espy and Charak2008). A maximum likelihood factor analysis conducted on these three measures produced a single factor, and the factor score was retained for use in subsequent analyses.
Oppositional–aggressive behavior
At the end of prekindergarten, Head Start teachers completed seven items from the authority acceptance scale of the Teacher Observation of Child Adaptation—Revised (Werthamer-Larsson, Kellam, & Wheeler, Reference Werthamer-Larsson, Kellam and Wheeler1991) reflecting oppositional and overtly aggressive behavior (e.g., stubborn, ignores or refuses to obey adults, yells, and fights with other children; α = 0.91). Items were rated on a 6-point Likert-type scale (almost never = 1, almost always = 6), with higher scores reflecting more oppositional–aggressive behaviors. Ratings provided by lead and assistant teachers were averaged (r = .69, p < .01).
Family SES and single-parent status
At the prekindergarten home interview, family SES was assessed by asking parents to report on their education level and occupation, which were categorized into the Hollingshead (Reference Hollingshead1975) levels. At that time, primary caregivers were also asked to report whether they were married, single, or living with someone for more than 1 year. If they were married or living with someone for longer than 1 year, the single-parenthood variable was coded as 0 (57% of the sample); others were coded as 1 (43% of the sample).
Elementary school quality
School-level student achievement scores were retrieved from state records. The percentage of children in each school in the “below basic” category for reading and math proficiency (averaged) in third grade (the lowest grade level available) was used to index the proportion of students failing academically in each school. The distribution of this averaged score was bimodal and nonoverlapping in this sample; relatively few children (0%–15%) were failing in most of the schools in this sample (70%), but many children were failing in the other 30% of the schools in the study (up to 38% of the student body). A dichotomous indicator was created to accurately reflect the two kinds of schools in the sample (0 = school with low student achievement, 1 = school with average student achievement). These two groups of schools differed significantly on other risk indices as well; relative to schools serving few low-achieving students, those serving many low-achieving students also had more students who qualified for free or reduced-price lunch (63% vs. 48%), more African American and Latino students (61% vs. 12%), and more English language learners (11% vs. 1%).
Fifth-grade academic outcomes
Two subtests of the Test of Word Reading Efficiency (TOWRE; Torgesen, Wagner, & Rashotte, Reference Torgesen, Wagner and Rashotte1999) were directly administered to children to assess basic reading fluency at the end of fifth grade. The sight word efficiency scale assessed the number of printed words that children identified accurately within 45 s (α > 0.80). The phonemic decoding efficiency scale assessed the number of nonwords that children sounded out accurately within 45 s (α > 0.80). The TOWRE assesses speed as well as accuracy of responding, and the test developers have demonstrated the reliability and validity of this measure in a sample of fourth- and fifth-grade children (Torgesen et al., Reference Torgesen, Wagner and Rashotte1999). The TOWRE scores were log-transformed to correct for skewness and kurtosis.
Overall academic functioning was assessed with two teacher-rated measures at the end of 5th grade. Teachers rated children's academic skills in the domains of reading/language arts (e.g., reading comprehension and spelling) and math (e.g., computation and measurement) using the Academic Competence Evaluation Scales (ACES; DiPerna & Elliot, Reference DiPerna and Elliott2000). Items were rated on a 5-point Likert scale, comparing the child's skills with grade-level expectations (1 = far below, 5 = far above), with higher scores reflecting greater skills (α = 0.98). The ACES was standardized on a large, national sample (N = 1,000) of children range = kindergarten through 12th grade, with strong reliability and validity demonstrated for a subsample of children range = 3rd to 5th grade (DiPerna & Elliot, Reference DiPerna and Elliott2000). Teachers also rated children's academic motivation using the competence motivation scale of the Learning Behaviors Scale (LBS; Schaeffer & McDermott, Reference Schaefer and McDermott1999). In the current study, seven items were rated, describing children's curiosity, self-efficacy, and motivation to learn in the classroom (e.g., “Is reluctant to tackle a new task” [reverse scored], “Shows little determination to complete a task” [reverse scored], and “Accepts new tasks without fear or reluctance”) using a 3-point scale (0 = does not apply, 1 = sometimes applies, and 2 = most often applies). One item (“Maintains concentration”) was omitted to avoid overlap with teacher ratings of inattention. Item scores were averaged and composited (α = 0.86), with higher scores reflecting greater academic motivation. The LBS was standardized on a large, national sample, and has been shown to have adequate reliability and validity for children within the age range of the current study (Schaeffer & McDermott, Reference Schaefer and McDermott1999).
Analyses of covariance (ANCOVAs) examining inattention trajectory profile differences on fifth-grade academic outcomes included sex, family SES, intervention status, and baseline level of the outcome as covariates. Because neither TOWRE subtest was administered in prekindergarten, baseline literacy skills were assessed with a composite of the phonological awareness and print awareness subtests from the Test of Preschool Literacy (Lonigan, Wagner, Torgesen, & Rashotte, Reference Lonigan, Wagner, Torgesen and Rashotte2007). In addition, neither teacher-rated measure (ACES or LBS) was administered in prekindergarten; thus prekindergarten teacher ratings of children's language skills were used as the baseline covariate in analyses.
Results
Analysis plan
Analyses proceeded in three steps. First, inattention trajectories were estimated by submitting teacher ratings of inattention from kindergarten through third grade to latent profile analysis. Second, the fifth-grade academic outcomes of children exhibiting the different inattention trajectory profiles were compared using an ANCOVA framework. Third, child self-regulation in preschool (EF and oppositional–aggressive behaviors) and family and school context factors (SES, single-parent status, and school achievement levels) were examined as predictors of discontinuities in inattention trajectory profiles using ANCOVA or chi-square analyses, as well as multinomial logistic regression.
Profile estimation
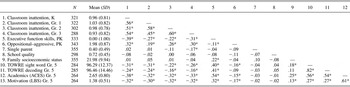
The means, standard deviations, and correlations among the measures used in this study are provided in Table 1. Preliminary analyses were undertaken to make sure that initial child inattention levels in prekindergarten were not confounded with differential placement in elementary schools of varying quality; these analyses showed no association between child inattention at baseline and elementary school placement.
Measure descriptions and correlations

Note: K, Kindergarten; Gr. 1–5, Grades 1–5; PK, prekindergarten; TOWRE, Test of Word Reading Efficiency; ACES, Academic Competence Evaluation Scales; LBS, Learning Behaviors Scale.
*p < .05.
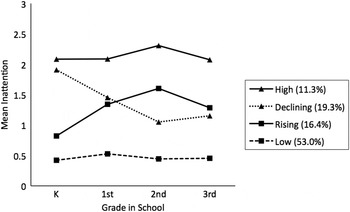
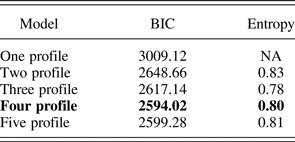
The first step in the analysis was to submit teacher ratings of inattention measured in kindergarten, first, second, and third grades to a latent profile analysis using Mplus version 5.1 (Muthén & Muthén, Reference Muthén and Muthén2001). A one-profile solution was estimated first, and each subsequent model added an additional profile to the solution until the model fit indices worsened. The Bayesian information criterion (Schwarz, Reference Schwarz1978) and model entropy were used to evaluate fit. With smaller values indicating a better fit, the Bayesian information criterion places a high value on parsimony and has been shown to accurately indicate the best fitting solution in simulation studies (Yang, Reference Yang2006). Model entropy values approaching 1 indicate greater confidence in children's assignment to the appropriate profile (Celeux & Soromenho, Reference Celeux and Soromenho1996). All entropy values were greater than .80, suggesting adequately accurate classification. A four-profile solution best fit the data (see Table 2) and was most amenable to interpretation (see Figure 1). Profiles included a stable low inattention trajectory profile (53.0% of the sample); a stable high trajectory (11.3%); a low-rising trajectory (16.4%) and a high-declining trajectory (19.3%), very similar to the inattention trajectories found by Pingault et al. (Reference Pingault, Tremblay, Vitaro, Carbonneau, Genolini and Falissard2011).
Inattention trajectory profiles from kindergarten through third grade.

Summary of fit statistics for latent profile models of inattention

Note: BIC, Bayesian information criterion.
Analyses of variance were conducted to evaluate significant profile differences in inattention levels and revealed significant differences at each time point: kindergarten, F (3, 317) = 292.43, p < .001, first grade, F (3, 318) = 103.76, p < .001, second grade, F (3, 298) = 278.54, p < .001, and third grade, F (3, 284) = 77.30, p < .001. Tukey post hoc comparisons indicated that, in kindergarten, children in the stable low profile group had the lowest inattention levels (M = 0.42), children in the rising group had significantly higher levels (M = 0.80), and children in the declining and stable high groups had significantly higher levels, and did not differ from each other (M = 1.93 and M = 2.10, respectively). By first grade, these relative positions had shifted, with the stable low group still the lowest (M = 0.52), the rising and declining groups intermediate, significantly higher than the low group, but not different from each other (M = 1.37 and M = 1.46, respectively) and the stable high group highest and significantly different from all other groups (M = 2.11). These relative positions were maintained in second and third grades, with third-grade inattention scores lowest for the stable low group (M = 0.47), intermediate for the low-rising and high-declining groups (M = 1.29 and M = 1.14, respectively), and highest for the stable high group (M = 2.10; see Figure 1).
Groups did not vary significantly on family SES or Head Start treatment status, but they did vary significantly on child sex. Boys were significantly more likely to be in the stable high group (79%), less likely to be in the stable low group (31%), and equally likely to be in the rising (56%) or declining groups (54%). Family SES, Head Start treatment status, and child sex were included as control variables in subsequent analyses.
Prediction of fifth-grade academic outcomes
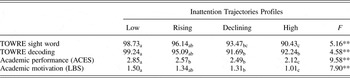
ANCOVAs examined profile differences in the four academic outcomes collected in fifth grade, controlling for sex, family SES, intervention status, and baseline level of the outcome, and they revealed significant differences on each measure, including direct assessments of children's reading skills, the TOWRE sight word efficiency, F (3, 279) = 5.16, p < .01, and phonemic decoding efficiency scales, F (3, 280) = 4.58, p < .01, as well as teacher ratings of academic competence, F (3, 260) = 9.58, p < .01, and academic motivation, F (3, 260) = 7.90, p < .01. Children with stable-low profiles of inattention showed the best academic performance on all measures. Tukey post hoc comparisons revealed that children with rising trajectories of inattention did not differ significantly from the stable low group on the TOWRE subtests or teacher-rated academic motivation, but they were rated as less academically competent by fifth-grade teachers (see Table 3). Children with declining profiles of inattention and those with stable high profiles of inattention each scored significantly less well on all four academic outcomes than did the stable low group, and they did not differ from each other on the two TOWRE subtests. However, the declining group was rated more positively by teachers on the academic competence and academic motivation scales than was the stable high group. The means of the rising and declining groups did not differ significantly from each other on any of the four academic outcomes.
Fifth grade academic outcomes for children with different inattention trajectories

Note: Child sex, family socioeconomic status, intervention status, and baseline level of the outcome variable were included as covariates. Means with different subscripts are significantly different at p < .05. TOWRE, Test of Word Reading Efficiency; ACES, Academic Competence Evaluation Scales; LBS, Learning Behaviors Scale.
**p < .01.
Risk and protective factors associated with inattention trajectories
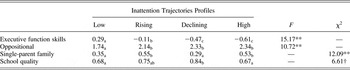
The next set of analyses explored child self-regulation (EF skills and oppositional–aggression) in preschool and family and school context variables that might increase the likelihood of escalating classroom inattention in elementary school (e.g., being in the rising trajectory vs. the stable low trajectory) or that might predict recovery from early inattention (e.g., being in the declining trajectory vs. the stable high trajectory). ANCOVAS (for continuous predictors) and chi-square tests (for dichotomous predictors) were used to explore group differences on each risk or protective factor separately. These ANCOVAs, controlling for family SES, Head Start treatment status, and child sex, indicated significant group differences on preschool EF skills, F (3, 320) = 15.17, p < .01, and oppositional–aggressive behaviors, F (3, 325) = 10.72, p < .01. Post hoc comparisons revealed that children in the stable low inattention trajectory had better preschool EF skills and fewer preschool oppositional–aggressive behaviors than children in any other inattention trajectory, and that children in the rising inattention trajectory had better EF skills than children in the other two trajectories, who did not differ on either self-regulation index (see Table 4). Chi-square analyses revealed significant group differences on single-parent status, χ2 (3, 333) = 12.09, p < .01, and marginally significant group differences in school quality, χ2 (3, 294) = 6.61, p = .08. Post hoc comparisons indicated that the proportion of children from single-parent families was significantly higher for the rising (55%) and stable high (53%) inattention trajectory profiles than for the stable low (35%) and declining (29%) inattention trajectories. In addition, children in the declining trajectory were significantly more likely to attend higher quality schools (84%) relative to children in the stable high (67%) or stable low (68%) trajectories (see Table 4).
Child, family, and school factors differentiating inattention trajectories

Note: School quality was coded as 0 = school with low student achievement, 1 = school with high student achievement. Child sex, family socioeconomic status, and intervention status were included as covariates. Means with different subscripts are significantly different at p < .05.
†p < .10. **p < .01.
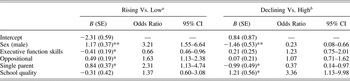
Next, the set of risk and protective factors were considered together in a multinomial logistic regression, predicting the four trajectories, χ2 (21) = 117.89, p < .01, R 2 = .33. Specific contrasts comparing the likelihood of membership in the rising trajectory relative to the stable low trajectory revealed significant unique contributions for preschool EF, β = –0.41 (SE = 0.19), p < .05, preschool oppositional–aggression, β = 0.49 (SE = 0.19), p < .05, single parent status, β = 0.84 (SE = 0.37), p < .05, and child sex, β = 1.17, (SE = 0.37), p < .01. Compared with children who remained low in inattention, children whose inattention increased over time were more likely to have low preschool EF (odds ratio = 0.66), elevated preschool oppositional–aggressive behavior (odds ratio = 1.63), be in a single-parent family (odds ratio = 2.31), and be male (odds ratio = 3.21; see Table 5). Specific contrasts comparing the likelihood of being in the stable high versus the declining trajectory revealed significant unique contributions for single-parent status, β = –0.99 (SE = 0.48), p < .05, elementary school-level student achievement, β = 1.21 (SE = 0.56), p < .05, and child sex, β = 1.46, (SE = 0.53), p < .01. Compared with children who stayed high in inattention, children who declined over time were less likely to be in single-parent families (odds ratio = 0.37), more likely to enter an elementary school characterized by higher levels of student achievement (odds ratio = 3.36), and less likely to be male (odds ratio = 0.23).
Multinomial logistic regressions comparing inattention trajectory groups

aThe stable low inattention trajectory was used as the reference group in this contrast.
bThe stable high inattention trajectory was used as the reference group in this contrast. Family socioeconomic status and intervention status were included as covariates.
*p < .05. **p < .01.
Discussion
Although inattention is often considered to be a fairly stable individual trait, with strong heritability (Gjone et al., Reference Gjone, Stevenson and Sundet1996) and substantial continuity over time (Willcutt et al., Reference Willcutt, Nigg, Pennington, Solanto, Rohde and Tannock2012), recent research suggests that trajectories of inattention are discontinuous for some subgroups of children (Pingault et al., Reference Pingault, Tremblay, Vitaro, Carbonneau, Genolini and Falissard2011; Robbers et al., Reference Robbers, van Oort, Polderman, Bartels, Boomsma and Verhulst2011). In this study of a low-income US sample, a set of classroom inattention trajectories emerged across the early elementary years (kindergarten through third grade) that were very similar to those reported by Pingault et al. (Reference Pingault, Tremblay, Vitaro, Carbonneau, Genolini and Falissard2011). Slightly over half of the sample showed a stable low trajectory of inattention, and another 11% showed a stable high trajectory of inattention. However, about one third of the children in the sample showed discontinuous trajectories of inattention over time, with 16% starting low but rising over time, and 19% starting high but declining over time.
The children who exhibited stable high classroom inattention received an average item rating of >2 on the ADHD inattention symptom checklist, indicating that teachers observed most of the inattentive behaviors “pretty much” to “very much” of the time. It was no surprise that these children showed notable academic impairments at fifth grade, even after accounting for baseline levels, scoring significantly below children in the stable low trajectory on direct assessments of reading efficiency, teacher ratings of overall academic competence, and teacher ratings of academic motivation. Children in the declining group appeared just as inattentive as those in the stable high group when they entered kindergarten, with an average item rating very close to 2 on the symptom checklist. However, the declining trajectory diverged from the stable high trajectory after kindergarten, with their average item inattention rating dropping to 1.5 in first grade, and then nearly down to 1 in second and third grades. This group became significantly less inattentive than the stable high group, but remained significantly more inattentive than the stable low group. However, children in the declining inattention trajectory, whose inattention was high in kindergarten and then declined, still performed more poorly than children in the stable low inattention trajectory on all of the fifth-grade academic outcomes. Their fifth-grade scores were as poor as those received by children in the stable high inattention trajectory on direct assessments of reading. These findings highlight the importance of the early school years, such that despite improvements in teacher-rated inattention across the early school years, children who experience inattention at school entry are likely to experience ongoing academic difficulties (Pingault et al., Reference Pingault, Tremblay, Vitaro, Carbonneau, Genolini and Falissard2011; Rabiner et al., Reference Rabiner, Carrig and Dodge2013). It has been suggested that early inattention impairs the initial acquisition of foundational academic skills and thereby delays progress and undermines achievement in later years, even as learning behaviors improve (Breslau et al., Reference Breslau, Miller, Breslau, Bohnert, Lucia and Schweitzer2009; Lonigan et al., Reference Lonigan, Bloomfield, Anthony, Bacon, Phillips and Samwel1999). For children exhibiting declining inattention, it is also possible that the improvements noted in teacher-rated inattention reflected improvements in emotional or behavioral regulation, such that children engaged greater effort in learning, persisted longer, and spent more time on task, but that the cognitive underpinnings of their academic difficulties (such as low EF skills) remained.
The other discontinuous trajectory included children who scored relatively low on inattention in kindergarten (average item rating of <1), but then increased in inattention in later years, rising to an average item rating of 1.29 in first grade, and staying above 1 through third grade. Although the inattention of children in this group worsened across the early school years, they performed as well as children in the stable low trajectory on direct assessments of reading efficiency and teacher-rated academic motivation in fifth grade, and they performed significantly better than the stable high inattention trajectory on three of four academic outcomes. This pattern suggests that later-emerging inattention does not impair academic functioning to the same degree as early-emerging inattention (Rabiner et al., Reference Rabiner, Carrig and Dodge2013). These findings also raise the intriguing possibility that children with similar moderate levels of inattention in the middle elementary grades may represent two quite different developmental groups, who are the same on teacher-rated inattention in first through third grades but who are distinguished by their history of early inattention and by their academic outcomes. Although this was not a clinical sample, the findings also raise a question regarding possible heterogeneity in children diagnosed with ADHD at older versus younger ages.
Predictors of discontinuous trajectories of inattention
A particularly important aim of this study was to explore initial factors that might predict discontinuities in teacher-rated inattention. Based on prior developmental research, this study included measures of child self-regulatory functioning in prekindergarten (EF skills and oppositional–aggressive behavior) and facets of the family (family SES and single parenthood) and school contexts (elementary school student achievement levels). Of particular interest were factors that differentiated trajectories of stable low inattention from trajectories that were low in kindergarten but rose over time, and conversely, factors that differentiated trajectories of stable high inattention from trajectories that were high in kindergarten but declined over time.
Relative to children in the stable low trajectory, children in the rising inattention trajectory had lower EF skills in preschool, higher rates of oppositional–aggressive behavior, and were more likely to be from a single-parent family. Prior research has identified EF deficits and oppositional–aggressive behaviors as risk factors that often accompany inattention and provide an index of the severity of maladjustment (Berlin et al., Reference Berlin, Bohlin and Rydell2003; Todd et al., Reference Todd, Huang, Todorov, Neuman, Reiersen and Henderson2008; Wåhlstedt et al. Reference Wåhlstedt, Thorell and Bohlin2008). Relative to children with stable low inattention, children showing each of the other trajectories of inattention (rising, declining, or stable high) had significant deficits in levels of preschool EF and elevations in preschool oppositional–aggressive behavior. In the case of the rising trajectory, one might question why these children appeared more focused and attentive in kindergarten than children in the other risk trajectories, but then became more inattentive in the later school years. There are several possibilities. First, it is possible that these children were able to meet the learning demands of the kindergarten classroom despite their underlying EF deficits and tendencies toward oppositional–aggressive behavior because the relatively lower demands of the kindergarten classroom were still manageable for them. However, increasing academic and behavioral demands in later grades may have overwhelmed their EF skill deficits, amplifying their attentional difficulties. Second, another possibility is that the inattentive behavior of these children increased over time due to diminishing motivation and effort, suggesting problems with emotional and behavioral regulation rather than cognitive regulation per se (Zhou et al., Reference Zhou, Hofer, Eisenberg, Reiser, Spinrad and Fabes2007). The teacher ratings used to assess inattention in this study tap both the underlying cognitive self-regulatory capacities and also the motivational and behavioral aspects of task persistence and compliance. For this reason, noncompliant children often show elevated classroom inattention, as they fail to listen, have trouble following directions, and fail to complete tasks (Stipek & Miles, Reference Stipek and Miles2008; Todd et al., Reference Todd, Huang, Todorov, Neuman, Reiersen and Henderson2008; Zhou et al., Reference Zhou, Hofer, Eisenberg, Reiser, Spinrad and Fabes2007). In this study, it is not possible to identify the specific mechanism accounting for the rising trajectory of inattention, but the findings suggest important possibilities that should be explored in future studies.
Children in the declining inattention trajectory also displayed deficits in EF skills and elevated oppositional–aggressive behavior in preschool relative to children with stable low inattention trajectories, but these factors did not differentiate them from children in the stable high trajectory. In other words, the EF deficits and oppositional–aggressive behavior likely contributed to their inattention difficulties at school entry, but did not likely play a role in promoting the decline in inattention symptoms across the later grades. The factors that distinguished children in the declining trajectory from those in the stable high trajectory were aspects of the school and home context. Specifically, a greater proportion of children in the declining inattention trajectory profile (84%) attended schools characterized by higher levels of student achievement than did children in the stable high trajectory (67%). School achievement levels are likely a proxy for a number of diverse indices of school quality, including economic resources, teacher credentials, educational resources, and expectations for student achievement, as well as neighborhood resources and safety (Raver et al., Reference Raver, McCoy, Lowenstein and Pess2013). In this study, schools characterized by low student achievement (where over 15% of the students had “below basic” achievement scores) were also more likely than the other schools to be located in inner-city areas characterized by higher rates of community poverty and crime. Raver et al. (Reference Raver, McCoy, Lowenstein and Pess2013) recently suggested that unsafe school conditions, specifically, evoke stress that impedes EF skill development and fails to provide students with the predictable and supportive climate needed to foster their self-regulatory skills. More generally, children from low-SES families appear to benefit when they are placed in elementary classrooms that contain a higher density of competent peers (Neidell & Waldfogel, Reference Neidell and Waldfogel2010). For example, prior research suggests that children's language skills are enhanced when they are placed in classrooms containing peers with better language skills (Mashburn, Justice, Downer, & Pianta, Reference Mashburn, Justice, Downer and Pianta2009), and Foorman, York, Santi, and Francis (Reference Foorman, York, Santi and Francis2008) similarly found that poor readers made greater gains when placed in first-grade classrooms containing more peers with high reading scores. These studies suggest that academically competent peers may model and support positive academic behaviors and skills, thereby enhancing the progress of children with skill delays. Another explanation is that it may be easier for teachers to provide strong instructional and emotional support to enhance attention and learning engagement in a classroom containing many good students and fewer disruptive or disengaged peers (Neidell & Waldfogel, Reference Neidell and Waldfogel2010). This study did not examine the specific mechanisms of action linking higher quality schools with declining trajectories of inattention, and this is an important topic for future research.
Children in single-parent families were more likely to exhibit stable high or rising inattention trajectories, whereas children in two-parent families were more likely to show declining inattention trajectories in early elementary school, replicating the findings of Galéra et al. (2011) and Willoughby et al. (2012). Single parenthood and the processes associated with separation and divorce may affect inattention directly, by increasing levels of child stress and feelings of anxiety in ways that distract or overburden their attention processing (Blair & Raver, Reference Blair and Raver2012). Research also suggests that single parenthood tends to be characterized by higher levels of daily hassles, stress, social isolation, and depression, and lower levels of emotional and parenting support (Brown & Moran, Reference Brown and Moran1997; Cairney, Boyle, Offord, & Racine, Reference Cairney, Boyle, Offord and Racine2003). Hence, single-parent or disrupted family systems may also reduce the level of organization and routine at home, reducing the amount of parental attention, supportive monitoring, and effective management of child behavior and homework support, and thereby increase child vulnerability to inattention and distractibility.
Consistent with prior findings that more males than females exhibit inattention (APA, 2000, Gaub & Carlson, Reference Gaub and Carlson1997; Gershon, Reference Gershon2002), males were more likely to be in the stable high and rising inattention trajectories than in the stable low or declining trajectories. There are several possible reasons for this pattern of findings. First, several studies have documented sex differences in important biological and neurocognitive processes that are closely linked with inattention, suggesting the possibility of a greater vulnerability to inattention in males than in females (Gaub & Carlson, Reference Gaub and Carlson1997; Gershon, Reference Gershon2002). Second, it has been suggested that socialization experiences may differentially affect the type and course of psychopathology exhibited by males and females (Crick & Zahn-Waxler, Reference Crick and Zahn-Waxler2003). For instance, females tend to show fewer externalizing yet more internalizing problems than males. There may also be a referral bias whereby teachers express fewer concerns about inattention in females because it is less often accompanied by hyperactivity or oppositional–aggressive behavior than it is for boys (Gershon, Reference Gershon2002). Untangling these influences has proven difficult and will be an important area for further study.
Limitations and conclusions
Some limitations should be considered when interpreting these study findings. First, a concern for studies estimating trajectory groups is that the groups may be “mere figments of the analysis and unstable from one study to the next” (Bauer, Reference Bauer2007, p. 776). Although this concern is as relevant for the current study as any other employing this methodology, the trajectories of inattention that emerged (stable low, stable high, rising, and declining) were very similar to those found by Pingualt et al. (Reference Pingault, Tremblay, Vitaro, Carbonneau, Genolini and Falissard2011) in a large representative sample of school-aged Canadian youths, as well as other studies conducted with early childhood samples (Robbers et al., Reference Robbers, van Oort, Polderman, Bartels, Boomsma and Verhulst2011; Willoughby et al., 2012). Second, another limitation is that the sample included only children from low-income families who qualified for participation in Head Start. Although a priority of this study was to estimate trajectories of inattention for low-income children who are at increased risk for inattention and school adjustment problems, the sample represented a very limited range of SES. This likely explains why SES was not associated with inattention trajectory membership in the current study. Third, another issue is that half of the children participating in this longitudinal study received a preschool intervention within the Head Start setting. However, the first wave of data collection used in this developmental study was at the posttest, after the intervention was completed. Hence, intervention effects occurred prior to the start of this follow-up study. To account for any later effects on children's developmental trajectories, intervention status also served as a covariate in all analyses. Fourth, some of the factors that differentiated continuities and discontinuities in the current study may not be specific to inattention trajectories; rather, they may reflect nonspecific risk and protective factors for psychopathology. For instance, it is possible that high levels of school achievement and intact family status would also be associated with low or declining levels of oppositional–aggressive behavior, inasmuch as these factors reflect the availability of environmental supports. Additional research is needed to address the question of specificity, as well as to investigate the mechanisms of action linking environment factors with discontinuities in inattentive behavior. Fifth, although this study utilized a strong longitudinal design to examine predictors of discontinuity, it cannot specify causal relationships, because it is possible that other processes beyond those examined and controlled for in the current analyses contributed to the observed associations. In addition, the associations of inattentive behavior with EF skills and oppositional–aggressive behavior are well established. However, much more research is needed to tease apart the nature of these associations. EF skills and oppositional–aggressive behavior were conceptualized in the current study as possible predictors of discontinuity in inattention trajectories, but other developmental processes may account for the findings. For example, bidirectional influences or, alternatively, a third variable not assessed here, such as common neurobiological underpinnings, may account for the covariation observed in child self-regulation deficits and classroom inattention.
Implications and future directions
Classroom inattention is associated with lower levels of academic skill and attainment (Breslau et al., Reference Breslau, Miller, Breslau, Bohnert, Lucia and Schweitzer2009; Hinshaw, Reference Hinshaw1992; Pingault et al., Reference Pingault, Tremblay, Vitaro, Carbonneau, Genolini and Falissard2011). The current study demonstrated that classroom inattention is characterized by continuities and discontinuities that are meaningfully associated with academic outcomes, as well as with risk and protective factors. Two of the findings may have particularly important implications for practice and for future research. First, it was notable that environmental supports (e.g., schools characterized by high-achieving students and dual-parent families) emerged as the major factors differentiating children who started kindergarten with elevated inattention and improved over time from those who remained highly inattentive. Although causality cannot be inferred from these longitudinal data, they suggest that psychosocial interventions that include behavioral management training for parents and teachers, designed to enhance parents' and teachers' ability to structure the environment and provide appropriate and consistent feedback and support (Chronis, Chacko, Fabiano, Wymbs, & Pelham, Reference Chronis, Chacko, Fabiano, Wymbs and Pelham2004; Pelham & Fabiano, Reference Pelham and Fabiano2008) may be particularly useful in reducing school-based attention problems for children who enter school with high levels and are in contexts with lower levels of available supports. Second, the effects of child inattention at school entry on later academic achievement were notable in this study. That is, children who entered school with high levels of inattention and then showed reduced inattention in later years still showed substantial academic problems in fifth grade (problems on three of the four measured outcomes that were equivalent to those of children with stable-high inattention). Conversely, children in the rising trajectory of increasing inattention over time fared better academically, differing from children with stable-low inattention on only one academic outcome. These findings suggest that a focus on improving attention skills and reducing classroom inattention during early childhood before kindergarten entry may be particularly important for low-income children at risk for later classroom inattention, in order to reduce the negative impact of inattention on achievement at school entry. A number of recent intervention studies have focused on improving EF skills and adaptive learning behaviors during the preschool years, with mixed effectiveness (see review by Bierman & Torres, in press); further research is needed. Further examination of these discontinuous patterns of inattention is warranted, with research focused on identifying the mechanisms underlying the associations found in this study, and including intervention research testing the efficacy of efforts to promote adaptive attention skills.