Implications
The intramuscular fat% (IMF%) of lamb is linked to eating quality. Currently in Australia, IMF% is determined in lamb for experimental purposes only, mainly in the longissimus. The use of technologies such as computed tomography (CT) to predict IMF% in muscle would allow for the rapid and non-destructive determination of IMF% before carcass sorting. There is information regarding the use of CT to determine the IMF% of the M. longissimus but little data to assess the success of this technique in other muscles in the lamb carcass. Additionally, the correlation of IMF% between muscles from different regions of the carcass is currently unknown, with this information required to determine if a single muscle is appropriate to determine the IMF% of other muscles. The potential to utilise CT to estimate the intramuscular fat% of lamb is currently limited by the precision of the technique and the lack of their installation in abattoirs. CT has the potential for non-invasive point measurement in the loin for rapid prediction of intramuscular fat, and therefore eating quality, of multiple muscles in the carcass. If individual lamb and on farm data is concurrently available then the ability to predict intramuscular fat from CT scanning would be improved.
Introduction
Intramuscular fat (IMF) has been identified as an important factor influencing the eating quality of red meat though its influence on juiciness (Shorthose and Harris, Reference Shorthose and Harris1991; Thompson, Reference Thompson2004) and flavour (Thompson, Reference Thompson2004). In beef it accounts for up to 15% of the variation in palatability (Dikeman, Reference Dikeman1987) and in lamb it is thought that a minimum of 4% to 5% IMF is required for consumer satisfaction with regard to palatability (Hopkins et al., Reference Hopkins, Hegarty, Walker and Pethick2006). Loin IMF% is a useful predictor of eating quality and its measurement can help maintain premium eating quality of lamb (Pannier et al. 2014a and 2014b). To improve targeted marketing, value adding to cuts and feedback to suppliers, a rapid, non-destructive tool to determine IMF% of muscle before sale would be advantageous.
There is variation in IMF% between muscles throughout the carcass in lamb (Warner et al., Reference Warner, Jacob, Edwards, McDonagh, Pearce, Geesink, Kearney, Allingham, Hopkins and Pethick2010; Anderson et al., Reference Anderson, Pannier, Pethick and Gardner2014) and beef (Brackebrush et al., Reference Brackebrush, McKeith, Carr and McLaren1991). The study in beef by Brackebush et al. (Reference Brackebrush, McKeith, Carr and McLaren1991) demonstrated a strong linear relationship between IMF% of the muscle longissimus lumborum and other muscle depots. Therefore the potential exists to use the IMF% of the m. longissimus lumborum to predict other muscles. In sheep, loin musculature (m. longissimus lumborum) is considered of premium quality with research focused on the eating quality and intramuscular fat levels of this muscle (Pannier et al., 2014a and 2014b). In lamb, the IMF% of muscles other than the m. longissimus lumborum has not been well described. A companion study in lamb by Anderson et al. (Reference Anderson, Pannier, Pethick and Gardner2014) describes the IMF% of an additional four muscles (m. supraspinatus, m. infraspinatus, m. semimembranosus and m. semitendinosus) in three regions of the carcass. If a high correlation exists between these muscles then one measurement may be used to predict IMF% of other muscle depots, enabling a single site measurement for grading for eating quality purposes and development of an IMF% breeding value. Conversely, poor correlation may indicate a need for IMF% to be measured in multiple muscle depots for these purposes.
X-ray computed tomography (CT) has been used to accurately determine carcass composition of fat, muscle and bone in sheep and pigs (Kolstad et al., Reference Kolstad, Jopson and Vangen1996; Simm et al., Reference Simm, Lewis, Collins and Nieuwhof2001; Gardner et al., Reference Gardner, Williams, Siddell, Ball, Mortimer, Jacob, Pearce, Hocking Edwards, Rowe and Pethick2010). Karamichou et al. (Reference Karamichou, Richardson, Nute, McLean and Bishop2006) and demonstrated muscle CT density was correlated to meat quality traits such as IMF%, lamb juiciness, flavour and overall liking in the loin and m. semimembranosus. The use of in vivo CT to predict eating quality through assessment of IMF% and shear-force of the m. longissimus lumborum has been investigated (Lambe et al., Reference Lambe, Navajas, Fisher, Simm, Roehe and Bünger2009). Clelland et al. (Reference Clelland, Bunger, McLean, Conington, Maltin, Knott and Lambe2014) has investigated the use of in vivo CT scanning of lamb loin to predict IMF%, with predicted carcass fat accounting for much of the variation in IMF%. The prediction of IMF% in dissected loins has also been investigated in lambs (Lambe et al., Reference Lambe, McClean, Macfarlane, Johnston, Jopson, Haresign and Richardson2010), beef (Prieto et al., Reference Prieto, Navajas, Richardson, Ross, Hyslop, Simm and Roehe2010a) and pork (Font-i-Furnols et al., Reference Font-i-Furnols, Brun, Tous and Gispert2013). There are currently no studies in lamb that investigate the use of CT to predict IMF% in muscles other than the loin. The ability of CT to accurately predict IMF% in other muscles would enable better assessment of carcass IMF% and therefore indicate quality before sorting, boning and sale of other cuts of meat.
The Australian Cooperative Research Centre (CRC) for Sheep Industry Innovation established an Information Nucleus Flock (INF) experiment in 2007. In addition to the standard carcass measurements, 400 lamb carcasses underwent CT scanning to determine proportion of fat, lean and bone. The IMF% of 5 muscles (m. longissimus lumborum, m. supraspinatus, m. infraspinatus, m. semimembrinosus and m. semitendinosus) from three sections of the carcass, with the impact of selection for improved lean meat yield on IMF% content is reported in Anderson et al. (Reference Anderson, Pannier, Pethick and Gardner2014). Additional analysis is reported in this paper, where the correlation of IMF% between these muscles and also with the percentage of fat within the carcass has been determined. Additionally, the ability of CT to predict IMF% in dissected muscles from five locations has been investigated. We hypothesise that the IMF% of the m. longissimus lumborum muscle will be correlated with the IMF% of other muscles examined. Additionally, we hypothesise that CT pixel density will adequately predict the IMF% of CT scanned muscles, allowing non-destructive rapid determination of IMF% throughout the lamb carcass.
Material and methods
Experimental design and slaughter details
Details of the design of the Sheep CRC’s INF were presented by Fogarty et al. (Reference Fogarty, Banks, van de Werf, Ball and Gibson2007). The 400 lambs used in this experiment were the progeny of sires representative of a wide range of traits. All lambs were born and raised at Katanning, Western Australia in 2011, with information recorded about the lambs including: sire type (whether the sire was a Maternal, Merino or Terminal sire); birth type and rearing type (combined effect of animals born as single or multiple and reared as single or multiple); sex (wether or ewe); dam breed (Merino or Border Leicester-Merino). Lambs were slaughtered at a target carcass weight of 21 kg and therefore divided into four different kill groups at average ages of 167, 238, 280 and 355 days. The number of lambs in each category for sire type, sex, dam breed, birthing and rearing type and kill group are shown in Table 1. The breeding values used to select for improved lean meat yield were also available for the three sire types with results for the impact of selection for improved carcass lean meat yield presented in Anderson et al. (Reference Anderson, Pannier, Pethick and Gardner2014).
Number of lambs used according to sire type, sex, birthing and rearing type, dam breed and kill group

Kill group=average age of lambs at slaughter followed by location and birth year (2011); K=Katanning.
1 BLM: Border Leicester-Merino.
Lambs were yarded the day before slaughter and transported to a commercial abattoir in Katanning, held in lairage overnight and slaughtered the following day at an average carcass weight of 21 kg. Carcasses were subjected to a medium voltage electrical stimulation (Pearce et al., Reference Pearce, Van de Ven, Mudford, Warner, Hocking-Edwards, Jacob, Pethick and Hopkins2010).
Sample collection and measurements
Hot carcass weight (HCWT) was determined immediately following dressing. Carcasses were stored at 4°C within 1 h of slaughter, with measurements taken at 24 h for: GR tissue depth (total tissue depth above the surface of the 12th rib 110 mm from the midline); c-site fat depth (mm) and eye muscle depth (mm) (subcutaneous fat depth and eye muscle depth (mm), taken at the 12th rib, 45 mm from midline).
Chilled carcasses were transported to Murdoch University to undergo CT scanning within 72 h of slaughter. Before CT scanning each carcass was split into three primal components, the fore, saddle and hind sections. The fore-section was separated from the saddle by a cut between the fourth and fifth rib, the hind-section was separated from the saddle by a cut through the mid-length of the sixth lumbar vertebrae. These sections were then CT scanned as detailed in the section on ‘CT scanning’. Following scanning, individual muscles were dissected from each carcass section, trimmed to remove all external and inter-muscular fat, weighed, CT scanned separately, and then stored at −20°C until processing for IMF determination using a near infrared procedure (NIR). These muscles included: from the fore section, the m. supraspinatus and m. infraspinatus; from the saddle section, the m. longissimus lumborum; and from the hind section, m. semimembranosus and m. semitendinosus. Due to carcass imperfections and muscle trimming (e.g. faecal contamination, abscess or excessive bruising), all five muscles could not always be obtained from each carcass, with numbers of available muscles shown in Table 2.
Table showing for each muscle (m. semimembranosus, m. semitendinosus, m. supraspinatus, m. infraspinatus and m. longissimus lumborum) the number available for analysis, intramuscular fat% as measured by near infrared spectroscopy and average pixel density (Hu)

1 Intramuscular fat% as determined by near infrared spectroscopy.
2 Average CT pixel density=the average of the Hounsfield units from within the muscle.
The IMF% of each muscle was determined using a NIR. Samples were commercially freeze-dried using a Cuddon FD 1015 freeze dryer (Cuddon Freeze Dry, Blenheim, New Zealand). NIR measurements were taken using a Spectro Star 2400 calibrated against chloroform solvent extraction as detailed by (Perry et al., Reference Perry, Shorthose, Ferguson and Thompson2001). Calibration samples (n=160) were taken from all muscles represented in this study from lambs aged between 155 and 355 days of age with intramuscular fat levels ranging between 2.2% and 9.9%. There was an R2 of 0.94 between IMF% from the NIR and soxhlet-derived results. Additionally, samples were cross validated with the laboratory used to analyse IMF in lamb for samples in Pannier et al. (Reference Pannier, Pethick, Geesink and Ball2014a) analysis of intramuscular fat in the longissimus with R 2 of 0.91.
CT scanning
CT scanning was undertaken with a Picker PQ 5000 spiral CT scanner (Cleveland, Ohio, United States). The spiral abdomen protocol was selected with settings: pilot scan length of 512 mm, field of view set at 480, KV 100, Index 20, mA 150, revs 40, pitch 1.5 and standard algorithm. The carcass and individual muscles were scanned in 10 mm slice widths, with each slice taken 10 mm apart. The muscles were analysed by taking multiple images throughout the muscle so that more pixel data was available, rather than relying on one cross sectional image for each muscle. Image J was used to edit the images so that only the pixels obtained from the internal structure of the muscle were recorded, therefore excluding any fat external to the muscle. The average of all the pixels obtained in the scanning of each muscle was used in the analysis of CT density’s ability to predict IMF%.
The method described by Gardner et al. (Reference Gardner, Williams, Siddell, Ball, Mortimer, Jacob, Pearce, Hocking Edwards, Rowe and Pethick2010) was used to determine the% of lean and fat in the carcass. The images produced from the CT scan were edited to remove non-carcass image artefacts and were partitioned into bone, muscle and fat components (Image J version 1.37v, National Institutes of Health, Bethesda, MD, USA, used in conjunction with Microsoft Excel). The discrimination point to identify the Hounsfield barriers for associating pixels with bone, muscle or fat were –235 to 2.3 for fat, 2.4 to 164.3 for lean and >164.3 for bone (Alston et al., Reference Alston, Mengersen, Thompson, Littlefield, Perry and Ball2005). An estimate of volume using Cavalieri’s method (Gundersen and Jensen, Reference Gundersen and Jensen1987; Gundersen et al., Reference Gundersen, Bendtsen, Korbo, Marcussen and Møller1988) was calculated as follows:
 $$\eqalignno{ & _{m} \cr {\rm Volume}_{{{\rm Cav}}}=\,&\,d{\times} \Sigma \,area_{g} \,{\minus}\,t{\times}{\rm area}_{{{\rm max}}} \cr & g=\,{\rm 1} $$
where m is the number of CT scans taken and d is the distance between cross-sectional CT scans, in this case 10 mm. The value of t is the thickness of each slice (g), in this example 10 mm, and area max is the maximum area of any of the m scans.
The average of the Hounsfield units of the pixels of each component was then determined and converted into density (kg/l) using a linear transformation (Mull, Reference Mull1984). This was then used along with the volume of each component to determine the weight of fat, lean and bone, which was then expressed as a percentage of total carcass weight at the time of scanning. Given the density of the marrow tissue, it is classified as either fat or lean using the boundary discrimination method described above. Additional editing within Image J enabled the isolation of the marrow component of bone within all images. Thus the above procedures could be repeated on the ‘marrow only’ images. This enabled back correction for these pixels, reallocating them as bone and removing their associated volumes from the lean and fat components of the first iteration of image analysis. Thus using the CT scans it is possible to determine the percentage of fat, lean and bone within each carcass.
Raw data description
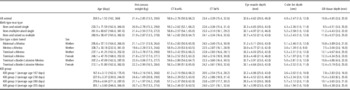
The raw average IMF%±standard deviation, as determined by NIR (NIR-IMF%) for each of the muscles tested was 4.8±1.2, 3.7±0.8, 5.0±1.1, 4.0±0.9 and 4.3±0.8, for the m. semitendinosus, m. semimembranosus, m. supraspinatus, m. infraspinatus, m. longissimus lumborum (Table 2). Likewise, the average pixel density for these muscles was 41±6.4, 55±3.8, 39±6.2, 36±8.3, 61±3.7 (Table 2). The distribution of this data is shown in Figure 1. The raw average (±standard deviation) for HCWT, CT lean%, CT fat%, GR tissue depth (mm), eye muscle depth (mm) and c-site fat depth (mm) for the lambs in this experiment was 21.4±2.85, 58.6±2.76, 23.4±3.39, 10.8±4.65, 32.6±4.62, 4.9±2.47. (Details of the mean and distribution of the above measurements are shown in Table 3.)
Raw data of the intramuscular fat% in lamb of the m. semimembranosus, m. semitendinosus, m. supraspinatus, m. infraspinatus and m. longissimus lumborum as it relates to average computed tomography pixel density (Hu) of the fat and muscle pixels.

Lamb age (days), hot carcass weight (kg), carcass lean and fat percentage as measured by computed tomography, eye muscle depth (mm), C-site fat depth (mm) and GR tissue depth (mm) displaying raw mean±s.d. (min, max)

CT lean%=percentage of lean in the carcass as measured by computed tomography.
CT fat%=percentage of fat in the carcass as measured by computed tomography.
Statistical analyses
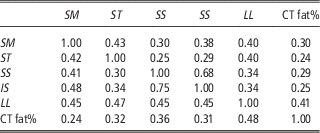
Simple correlations of NIR-IMF% between each of the five muscles (m. longissimus lumborum, m. semimembranosus, m. semitendinosus, m. supraspinatus, m. infraspinatus) was determined using PROC CORR in SAS (Version 9.1, SAS Institute, Cary, NC, USA). Partial correlations of NIR-IMF% between the five muscles were also determined using a multivariate analysis (Version 9.1, SAS Institute) that included the fixed effects: birth type and rearing type; sex within sire type (wether Merino, wether Maternal, female Terminal, wether Terminal); dam breed within sire type (Merino×Merino, Maternal×Merino, Terminal×Merino, Terminal×Border Leicester-Merino) and kill group, plus their first order interactions. Thus the robustness of the simple correlations can be assessed by comparison with the partial correlation coefficients (Table 4). Additionally, the simple and partial correlations of the IMF in each of the five muscles and the percentage of fat in the carcass (CT fat%) was determined using the same method as described above (Table 4).
Partial correlation coefficients (above the diagonal) and simple correlation coefficients (below the diagonal) of the near infrared derived IMF% and computed tomography derived % of fat (CT fat%) in lamb between the m. semimembranosus (SM), m. semitendinosus (ST), m. supraspinatus (SS), m. infraspinatus (IS) and m. longissimus lumborum (LL)

CT fat%=percentage of fat in the carcass as measured by computed tomography.
All correlations are significantly different from zero (P<0.05).
The information obtained from the CT scanning of muscles was used in a general linear model to predict IMF% (SAS Version 9.1, SAS Institute). A number of models were tested to reflect scenarios where varying amounts of information was available for predicting NIR-IMF%. These models were constrained to reflect the availability of information within Australian abattoirs in the present and future context. The standard deviation of the pixel density was included in the models, however was not significant and therefore not retained in the final models described below. The models included varying combinations of the following terms:
-
1. Average CT pixel density and muscle type (see Models 1 to 3; Table 5).
-
2. Average CT pixel density, muscle type and basic carcass measurements (HCWT, GR tissue depth) (see Models 4 and 5; Table 5).
-
3. Average CT pixel density and muscle type plus more detailed carcass measurements including HCWT eye muscle depth (mm) and c-site fat depth (mm). (see Models 6 and 7; Table 5).
-
4. Average CT pixel density and muscle type plus percentage of fat or lean tissue determined using CT scanning. (see Models 8 to 11; Table 5).
-
5. Average CT pixel density, percentage of fat or lean tissue determined using CT scanning, carcass measurements, muscle type plus the inclusion of known production factors including sex, sire type, birth type-rear type, kill group and dam breed. Sex and dam breed were both fitted within sire type, and in this experiment kill group in part described age, given that the average age for kill groups 1 to 4 was 167, 238, 280 and 355 days (see Models 12 to 17; Table 6).
-
6. Prediction of NIR-IMF% for each of the five muscles individually (m. longissimus lumborum, m. semimembranosus, m. semitendinosus, m. supraspinatus, m. infraspinatus) using average CT pixel density, percentage of carcass fat determined using CT scanning and CT density of the m. longissimus lumborum. (Table 7)
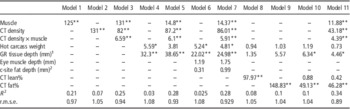
F-values, coefficient of determination (R 2), and r.m.s.e. for models predicting intramuscular fat% in lamb using muscle type, average computed tomography pixel density of fat and muscle (CT density), hot carcass weight, GR tissue depth (mm), eye muscle depth (mm), c-site fat depth (mm) and computed tomography derived % of fat and/or lean tissue (CT lean% or fat%)

1 GR tissue depth: tissue depth at the 12th rib, 110 mm from the midline.
2 c-site fat depth: depth of the fat at the 45 mm from the midline at the 12th rib.
*P<0.05, **P<0.01.
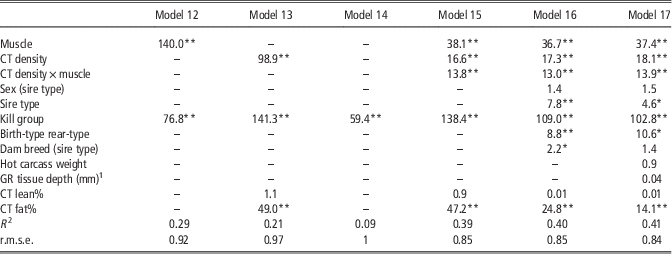
F-values, coefficient of determination (R 2), and r.m.s.e. for models predicting intramuscular fat% in lamb using muscle type, average computed tomography pixel density (CT density) of fat and lean, % computed tomography fat and lean (CT lean% or CT fat%), on-farm information and carcass measurements

1 GR tissue depth: tissue depth at the 12th rib, 110 mm from the midline.
*P<0.05, **P<0.01.
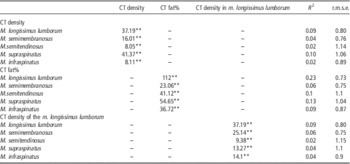
F-values, coefficient of determination (R 2), and r.m.s.e. for models predicting intramuscular fat% in the m. semimembranosus, m. semitendinosus, m. supraspinatus, m. infraspinatus and m. longissimus lumborum in lamb using average computed tomography pixel density (CT density) of fat and lean, computed tomography derived % of fat (CT fat%), and CT density of the m. longissimus lumborum

**P<0.01.
Results
The correlation coefficients of IMF% between the five muscles were variable with the highest correlation coefficients evident between the m. supraspinatus and the m. infraspinatus (Table 4) in the fore section of the carcass. The correlation between the m. longissimus lumborum to the other muscles was fairly consistent with values ranging between 0.34 and 0.40 (partial correlation coefficient), and the weakest correlations were those between the forequarter and hindquarter muscles. Simple correlations demonstrated similar trends to the partial correlation coefficients, and were only mildly inflated above the partial correlation coefficient values.
The correlation of IMF% and carcass fat% (CT fat%) varied between muscles from 0.24 to 0.41 (partial correlation coefficient, Table 4). The strongest correlation of CT fat% was with the IMF of the m. longissimus lumborum (0.41), which was 25% greater than the correlation between CT fat% and the IMF% of the other muscles.
Prediction of IMF% in lamb using average CT pixel density and muscle type
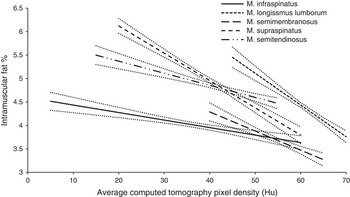
There was a negative linear relationship (P<0.01) between IMF% and average CT pixel density which varied between muscles (Figure 2). This relationship was greatest in the m. longissimus lumborum with a linear regression coefficient of −0.07±0.013, followed by the m. supraspinatus with a linear regression coefficient of −0.06±0.008. This relationship was smallest in the m. infraspinatus with a linear regression coefficient of −0.02±0.006. As such, for the model using a combination of average CT pixel density and muscle, there was adequate precision for predicting IMF%. This model described 25% of the variation (coefficient of determination (R 2)=0.25) in IMF% with 2/3 of the data falling within 0.94 IMF% units (r.m.s.e.=0.93) of the predicted value (see Model 3, Table 5). However most of the variation is explained by muscle alone (see Model 1, Table 5), therefore when the muscle is unknown the precision falls (R 2=0.07, r.m.s.e. 1.05; Model 2, Table 5).
The relationship between intramuscular fat% in lamb and computed tomography pixel density (Hu) (Model 3) for the m. infraspinatus (slope=−0.02±0.006, intercept=4.60), m. longissimus lumborum (slope=−0.07±0.013, intercept=8.50), m. semimembranosus (slope=−0.04±0.013, intercept=5.92), m. supraspinatus (slope=0.06±0.008, intercept=7.29) and m. semitendinosus (slope=−0.03±0.007, intercept=5.89). Lines represent least square means (±s.e. as dotted lines) across the range of average computed tomography pixels (Hu).

Prediction of IMF% in lamb using average CT pixel density, muscle type, and other carcass measures
Including HCWT, and GR tissue depth (mm) with average CT pixel density and muscle, only marginally improved the precision of prediction (Model 5, Table 5) compared to CT pixel density and muscle type alone. Additional carcass tissue depth measures (eye muscle depth (mm), and c-site fat depth (mm) did not deliver any further improvements in precision (Model 7, Table 5). The inclusion of whole body estimates of fat% and lean% derived from CT scans (i.e. CT fat% and CT lean%) in addition to CT density, muscle and carcass measurements (HCWT and GR tissue depth (mm)) provided a further improvement in precision for predicting IMF% (R 2=0.34 and r.m.s.e.=0.89, Model 11, Table 5). However these terms alone only described similar variance as CT density (see Models 8, 9 and 10, Table 5).
Prediction of IMF% in lamb using average CT pixel density, CT fat%, CT lean%, muscle type and on-farm information
The inclusion of on-farm information such as sex, sire type, kill group (age), birth-type rear-type, and dam breed also improved the prediction of IMF% (see Models 12 to 16, Table 6). When all available on farm information was incorporated as well as hot carcass weight and GR tissue depth the prediction of IMF% only slightly exceeded that demonstrated by models 15 and 16 containing CT fat% (R 2=0.41 and r.m.s.e.=0.84, Model 17, Table 6).
Of the production factors tested, kill group (age) described the largest portion of variance (Model 17, Table 6), however used alone was a poor prediction of IMF% (Model 14, Table 6).
Prediction of IMF% within each muscle (m. longissimus lumborum, m. semimembranosus, m. semitendinosus, m. supraspinatus, m. infraspinatus) using CT density, CT fat% and the CT density of the m. longissimus lumborum
When each muscle was treated separately, the precision of prediction (R 2/r.m.s.e.) of IMF using CT density varied and was highest in the m. longissimus lumborum (0.09/0.8), and m. supraspinatus (0.1/1.1) (Table 7). In the remaining muscles the precision of prediction was less than half this (Table 7).
The precision of prediction of IMF% using CT fat% alone varied between muscles (Table 5) and was highest in the m. longissimus lumborum (R 2 0.23/r.m.s.e. 0.73, Table 7). In the other muscles it was approximately half that of the loin (Table 7) and lowest in the m. semimembranosus (R 2=0.06, r.m.s.e.=0.75, Table 7).
When the CT density of the m. longissimus lumborum was used to predict the NIR-IMF% of the other muscles the precision was similar to when the CT density of each individual muscle was used (Table 7). The exception to this was with the m. supraspinatus where the precision was halved.
Discussion
Correlation of IMF% between the muscles
Aligning with our initial hypothesis, IMF% within lamb muscles from the fore and hind sections are consistently correlated with IMF% in the m. longissimus lumborum. Furthermore, the relatively similar values of the partial and simple correlation coefficients suggests that production factors such as sex, sire type, dam breed, birthing and rearing type, and kill group do not bias the simple correlations. From an industry perspective this is important given that industry measurement of IMF% is likely to be focused on the m. longissimus lumborum. This measurement can thus be extrapolated to other muscles without concern over production factors biasing this correlation.
Correlations between the other muscles of the carcass appear more dependent upon co-location rather than an absolute amount of IMF. This is evidenced by the fact that the highest correlations were seen between the muscles of the fore-section (m. supraspinatus and m. infraspinatus) and the hind section (m. semimembranosus and m. semitendinosus). These high correlations are in spite of the fact that these muscles have different functions, for example the m. supraspinatus is considered a stabilising muscle and the m. infraspinatus is used for extension and flexion of the shoulder joint (Suzuki, Reference Suzuki1995). Also aligning with the theme of correlations between co-localised muscles, the poorest correlation of IMF% was between muscles of the fore and hind sections and the m. longissimus lumborum had a moderate and similar correlation for IMF% with all other muscles. In beef, the correlations that exist between muscles is higher, where the R 2 between the m. longissimus lumborum and the m. supraspinatus, infraspinatus, m. semimembranosus and m. semitendinosus are 0.63, 0.69, 0.83 and 0.77 (Brackebrush et al., Reference Brackebrush, McKeith, Carr and McLaren1991). However this may be a reflection of a greater range in IMF% across which these R 2 were estimated. A single measurement of IMF% taken from the m. longissimus lumborum in lamb carcass is still likely to be an adequate predictor of IMF% within the rest of the carcass.
The correlation of whole carcass fat (CT fat%) and the NIR-IMF% varied between the muscles examined, which is a finding unique to this study. The highest correlation was between carcass fat% and the NIR-IMF% of the m. longissimus lumborum (partial correlation 0.41). The correlation of carcass fat% and the NIR-IMF% of the other muscles was 25% lower than with the m. longissimus lumborum. Knowledge of carcass fat% does however offer a useful contribution to prediction of IMF% in all muscles examined, in addition to knowledge of average pixel density (Hu) of the muscle.
Prediction of IMF% based on CT density and muscle
The average CT pixel density based on the Hounsfield units within each image was negatively associated with increasing IMF%. As such and in support of our hypothesis average CT pixel density could be used to predict IMF% within a muscle type albeit with relatively poor precision across muscles. Similar to Clelland et al. (Reference Clelland, Bunger, McLean, Conington, Maltin, Knott and Lambe2014) but in contrast to Lambe et al. (Reference Lambe, McClean, Macfarlane, Johnston, Jopson, Haresign and Richardson2010), the use of standard deviation of CT density did not improve the prediction of IMF%.
The ability to predict IMF% using average CT pixel density alone within this study is less than that of previous studies. Lambe et al. (Reference Lambe, Navajas, Fisher, Simm, Roehe and Bünger2009) showed that using one CT scanner they were able to predict loin IMF% with similar precision in both live animals and dissected loins on the basis of muscle density alone (R 2 0.36 and 0.33). However, their precision of prediction diminished when data was obtained from the CT scanning of loins using other CT scanners, with R 2 similar to those obtained in our study.
The density change correlating with greatest increase in IMF% was in the m. longissimus lumborum and m. supraspinatus. In contrast, the m. infraspinatus demonstrated little change in IMF% but a greater magnitude of density change. This also highlights that the CT is likely to be a more sensitive predictor of IMF within the m. longissimus lumborum. Thus when CT was used to predict IMF in each individual muscle, the R 2 was greatest for the m. longissimus lumborum and m. supraspinatus and lower in the m. infraspinatus, m. semitendinosus and m. semimembranosus, in part reflecting this greater magnitude of change in IMF% per unit change in CT pixel density.
The precision of IMF% prediction in lamb was markedly improved if the muscle is known and used in the prediction model. This indicates there are factors more influential than IMF% that elicit differences in density between muscles. This is further evidenced by the poor association of IMF% and average CT pixel density between muscles, an example being the m. longissimus lumborum which despite having the highest average CT pixel density did not have the lowest IMF%. The reason for these discrepancies is likely attributed to the fact that muscles like the m. longissimus lumborum appear to be quite homogenous on a CT image, with the majority of the pixels classified as being muscle, with fibres predominantly running parallel to each other. In contrast the m. supraspinatus, m. infraspinatus and m. semimembranosus have more multidirectional fibres when examined on cut surface. This is related to differences in structure and function, which may influence how they appear as a CT image. The amount of elastin in the m. semitendinosus for example, may influence the average CT pixel density of the muscle and therefore interfere with the prediction of IMF between muscles. Additionally the size and shape of the intramuscular fat within muscles may impact on the calculated CT density of the muscle. Furthermore, postmortem changes to muscles may impact the CT density of the muscle, with this impact potentially varying between muscle locations.
Given the moderate and similar correlation of NIR-IMF% from the m. longissimus lumborum to other muscles examined, it was thought the knowledge of the CT density of the m. longissimus lumborum may be sufficient to predict IMF% in other locations. Similar precision of prediction was achieved when the CT density of the m. longissimus lumborum was used to predict IMF% of the other muscles as when using the CT density of the muscle itself. The exception to this was the m. supraspinatus where use of CT density in the m. longissimus lumborum to predict NIR-IMF% halved the precision, compared with using the CT density of the muscle itself. The reason for this is difficult to explain given there is similar correlation between the loin and the other muscles examined. It does however emphasise the difficulty in relying solely on correlations of IMF between regions of the carcass to predict IMF using CT scanning of the loin. Furthermore, reliance on these correlation should be used with caution if selection for IMF% in breeding programmes is based solely on the measurements in the loin, as it remains to be determined if correlations between muscles will remain constant with such selection over time.
Incorporating additional information for predicting IMF%
Given that industry routinely measures HCWT and fat score at the GR site we tested the potential for CT to predict IMF% in the presence of these terms. This led to only a marginal improvement in the prediction of IMF%, with the R 2 increasing from 0.25 to 0.28. Nonetheless, this aligns well with the work of Pannier et al. (Reference Pannier, Pethick, Geesink and Ball2014a), who demonstrated an association between IMF% and HCWT with an increase in IMF% of 2.08% across a 28 kg range in HCWT. Additionally an increase in GR tissue depth from 0.5 to 25 mm increased IMF% in the longissimus by 1.57%. Further work is currently underway in Australia to develop methods to rapidly and accurately measure carcass eye muscle depth (mm) and c-site fat depth (mm) to improve the precision of predicting lean meat yield. However, these additional measurements provided no further improvement in prediction precision for IMF% and would therefore not be of specific benefit for inclusion in a prediction equation.
Similar to previous studies (Clelland et al., Reference Clelland, Bunger, McLean, Conington, Maltin, Knott and Lambe2014) inclusion of a measure of carcass fat (CT fat%) did provided improvement in yield prediction. In the study of Clelland et al. (Reference Clelland, Bunger, McLean, Conington, Maltin, Knott and Lambe2014), the inclusion of a predicted carcass fat from a reference CT scan described the majority of the variation in IMF of the m. longissimus lumborum (R 2=0.51). In our study, across all muscles, the inclusion of CT fat% accounted for some of the variation in IMF (R 2=0.1), however this varied between muscles and is a reflection of the differences in correlation between CT fat% and the IMF% of the different muscles. In the current study, the precision of IMF% prediction using CT fat% was highest in the loin (R 2=0.23), reflecting the high correlation between CT fat% and IMF% in this muscle. The reason for the difference in the precision of IMF% prediction in the loin in our study using CT fat% and that of Clelland et al. (Reference Clelland, Bunger, McLean, Conington, Maltin, Knott and Lambe2014) is unclear. However, the lambs in the study of Clelland et al. (Reference Clelland, Bunger, McLean, Conington, Maltin, Knott and Lambe2014) were from one breed type (Texel), were younger (mean slaughter age 149 days) and had lower IMF% (mean 1.48%) than the lambs in this study which may account for some of the differences.
Importantly, if CT measurements were available, then IMF% could be predicted from CT fat%, with relatively little further information provided by CT pixel density. However, Pannier et al. (Reference Pannier, Pethick, Geesink and Ball2014a) has shown that focusing only on genetic selection for reduced carcass fat in the Australian lamb industry has concurrently decreased IMF% in the longissimus. Therefore the concern with predominantly utilising CT fat% to predict IMF% is that it does not enable uncoupling of selection for low carcass fat and maintenance of IMF%.
The Australian industry is moving towards improved individual animal tracking. Therefore information regarding individual animal production factors such as sex, birth type-rear type, etc. may become readily available to abattoirs. As such we also tested the addition of pre-slaughter information into the prediction equation and saw improved accuracy of prediction of IMF%. In particular there was a marked improvement in the prediction of IMF% when kill group was included in the model. Although potentially confounded by specific day effects, kill group is likely to largely reflect the impact of age (Anderson et al., Reference Anderson, Pannier, Pethick and Gardner2014; Pannier et al., Reference Pannier, Pethick, Geesink and Ball2014a) and maturity, both of which have been previously demonstrated to increase IMF% (Pannier et al., Reference Pannier, Pethick, Geesink and Ball2014a). As such knowledge of the animals’ age offers the most potential for improving the prediction of IMF%. This improvement in the prediction of IMF% using pre-slaughter production information is in contrast to work by Prieto et al. (Reference Prieto, Navajas, Richardson, Ross, Hyslop, Simm and Roehe2010a and Reference Prieto, Navajas, Richardson, Ross, Hyslop, Simm and Roehe2010b) who used the CT pixel density only, as additional information did not further improve the precision of IMF% prediction.
In a study in cattle Prieto et al. (Reference Prieto, Navajas, Richardson, Ross, Hyslop, Simm and Roehe2010a) predicted IMF% in two breeds of cattle with R 2 values of 0.76 and 0.71 based on CT pixel density only. One possibility to explain this discrepancy with our study may be associated with larger cell size in the muscle of cattle (~4000 µm2) compared with lamb (~2300 µm2) (Greenwood et al., 2006 and 2009) for the m. longissimus lumborum. Given the pixel resolution of the CT images (1×1 mm), the increased cell size in cattle may result in better tissue/density differentiation between pixels, potentially amplifying the density differences between high and low IMF samples. However in contrast to this, the IMF% of pork (Font-i-Furnols et al., Reference Font-i-Furnols, Brun, Tous and Gispert2013) and lamb (Clelland et al., Reference Clelland, Bunger, McLean, Conington, Maltin, Knott and Lambe2014) has been predicted using CT, indicating cell size alone does not account for the relatively poor prediction of IMF% in our study.
Conclusion
The IMF% of the m. longissimus lumborum correlated with each of the other muscles in this study, with the strength of this correlation similar for all muscles. However, the strongest correlations in IMF% existed between muscles located within the same region of the carcass. The scanning of lamb carcasses using a CT scanner has the ability to predict IMF% within individual muscles of the carcass, however in this experiment the precision was relatively poor. The majority of the variation in IMF% between muscles was described by knowledge of the muscle type alone. However, if used in conjunction with pre-slaughter information and carcass measurements, particularly CT fat%, the prediction of IMF% was greatly improved (R 2=0.41). The precision of CT prediction of IMF% using only CT density of the muscle in the lamb carcass needs to be improved before this will become a viable method of IMF% prediction across the carcass. Knowledge of the correlation between the m. longissimus lumborum and other muscles within the lamb carcass may allow CT measurement of IMF% in this muscle to predict IMF% elsewhere, however if selection for IMF% remains focused only on the loin, then the correlation of IMF% between muscles should be monitored. With inclusion of technologies such as CT in sheep abattoirs there is the potential to better predict IMF% before carcass sorting and boning, allowing better utilisation of carcasses based on estimates of their eating quality.
Acknowledgements
The authors would like to thank the Sheep CRC for Sheep Industry Innovation, Meat and Livestock Australia and the Australian Meat Processor Corporation. The authors gratefully acknowledge the contributions of staff and resources provided at the Katanning INF research site including the Department of Agriculture and Food WA. The Meat programme also benefits from the contribution of staff employed by CSIRO, Murdoch University and associated organisations for funding, and data collection support.