INTRODUCTION
Cassava (Manihot esculenta Crantz) is an economically important crop that is not only used for human consumption, but is also utilized extensively by the starch industry. Cassava is ranked ninth in terms of world crop production (FAO 2010). Generally, farmers propagate cassava by the stem cutting technique to maintain good characteristics from the selected variety, but this has resulted in large monocultures of cassava in many countries, increasing the problems of pathogenic diseases. Cassava anthracnose disease (CAD) caused by the fungus Colletotrichum gloeosporioides f.sp. manihotis, is the most important fungal disease of cassava (Owolade et al. Reference Owolade, Dixon and Adeoti2006; Akinbo et al. Reference Akinbo, Gedil, Ekpo, Oladele and Dixon2007). The disease causes canker on the stem and wilting of the leaves and leads to increased stem breakage under windy conditions, resulting in reductions in yield as well as the loss of healthy stems for propagation. The development of CAD-resistant varieties is one way to protect cassava from the consequences of this disease and Ferguson et al. (Reference Ferguson, Rabbi, Kim, Gedil, Lopez-Lavalle and Okogbenin2012) proposed that breeding programmes can improve cassava crop production with improved yields, root quality and disease resistance. However, due to the natural heterozygosity of cassava, variable flowering time, low seed set and long breeding cycle, cassava is poorly suited to traditional breeding programmes. Molecular breeding and marker-assisted selection could help breeders to solve these problems through more accurate gene-based selection (pyramiding of resistance genes) or enhanced genetic selection of quantitative traits resulting in reduced breeding population sizes and a reduced time to evaluate the phenotype (Ferguson et al. Reference Ferguson, Rabbi, Kim, Gedil, Lopez-Lavalle and Okogbenin2012).
Several genetic maps of cassava have been published based on different types of molecular markers such as restriction fragment length polymorphism (RFLP), random amplified polymorphic DNA (RAPD), isoenzymes, amplified fragment length polymorphism (AFLP), simple sequence repeat (SSR) and expressed sequence tag-SSR (EST-SSR) markers (Mba et al. Reference Mba, Stephenson, Edwards, Melzer, Nkumbira, Gullberg, Apel, Gale, Tohme and Fregene2001; Okogbenin et al. Reference Okogbenin, Marin and Fregene2006; Chen et al. Reference Chen, Xia, Fu, Lu and Wang2010; Kunkeaw et al. Reference Kunkeaw, Tangphatsornruang, Smith and Triwitayakorn2010b , Reference Kunkeaw, Yoocha, Sraphet, Boonchanawiwat, Boonseng, Lightfoot, Triwitayakorn and Tangphatsornruang2011; Sraphet et al. Reference Sraphet, Boonchanawiwat, Thanyasiriwat, Boonseng, Tabata, Sasamoto, Shirasawa, Isobe, Lightfoot, Tangphatsornruang and Triwitayakorn2011). The maps have been applied to the identification of quantitative trait loci (QTL) including those controlling early root growth (Okogbenin & Fregene Reference Okogbenin and Fregene2002), root productivity and plant architecture (Okogbenin & Fregene Reference Okogbenin and Fregene2003), root dry matter and cyanogen content (Balyejusa et al. Reference Balyejusa, Rönnberg-Wästljung, Egwang, Gullberg, Fregene and Westerbergh2007), components of early root yield (Okogbenin et al. Reference Okogbenin, Marin and Fregene2008), plant and first branch height (Boonchanawiwat et al. Reference Boonchanawiwat, Sraphet, Boonseng, Lightfoot and Triwitayakorn2011), fresh weight root yield, root dry matter content, root starch content (Chen et al. Reference Chen, Fu, Xia, Jie, Wang, Lu and Wang2012), starch pasting viscosity (Thanyasiriwat et al. Reference Thanyasiriwat, Sraphet, Whankaew, Boonseng, Bao, Lightfoot, Tangphatsornruang and Triwitayakorn2014) and cyanogen content (Whankaew et al. Reference Whankaew, Poopear, Kanjanawattanawong, Tangphatsornruang, Boonseng, Lightfoot and Triwitayakorn2011). However, there have been no studies identifying QTL linked to CAD, although molecular markers (derived by the RAPD technique) linked to CAD resistance in cassava have been discovered (Akinbo et al. Reference Akinbo, Gedil, Ekpo, Oladele and Dixon2007). However, RAPD markers are generally considered as poorly reproducible (Anderson Reference Anderson2013), and therefore more reliable, reproducible and robust markers are needed. The current study therefore aimed to identify QTL associated with the response to CAD infection based on analysis of reciprocal cross F1 populations using previously developed SSRs (International Centre for Tropical Agriculture, CIAT; Mba et al. Reference Mba, Stephenson, Edwards, Melzer, Nkumbira, Gullberg, Apel, Gale, Tohme and Fregene2001; Kunkeaw et al. Reference Kunkeaw, Yoocha, Sraphet, Boonchanawiwat, Boonseng, Lightfoot, Triwitayakorn and Tangphatsornruang2011; Sraphet et al. Reference Sraphet, Boonchanawiwat, Thanyasiriwat, Boonseng, Tabata, Sasamoto, Shirasawa, Isobe, Lightfoot, Tangphatsornruang and Triwitayakorn2011) and newly developed SSR markers generated by using sequences within the regions of known pathogenesis-related (PR) genes whose sequences are available in the cassava genome database (http://www.phytozome.net/cassava) (Prochnik et al. Reference Prochnik, Marri, Desany, Rabinowicz, Kodira, Mohiuddin, Rodriguez, Fauquet, Tohme, Harkins, Rokhsar and Rounsley2012). Furthermore, candidate CAD resistance genes were identified in the QTLs by gene annotations using the cassava genome database.
MATERIALS AND METHODS
Plant materials
In the current study, two cassava varieties, the Thai landrace Hanatee (HT) and the elite line Huaybong 60 (HB60) were used to generate two reciprocal cross F1 mapping populations, populations A (HT × HB60) and B (HB60 × HT). HB60 is characterized by high yield and starch content as well as resistance to CAD when compared with the HT variety, which displays low yield and starch content and is more susceptible to CAD (Kunkeaw et al. Reference Kunkeaw, Worapong, Smith and Triwitayakorn2010a ). Each population consisted of 100 individuals. In total, 200 samples of the F1 mapping populations were used in the current study. All plants were grown in the field at the Rayong Field Crops Research Centre, Department of Agriculture, Thailand (12°74′N, 101°14′E, 49·815 m a.s.l.). Crop management was performed by growing cassava with distances of 1·5 m between rows and 1 m between plants. Fertilizer (nitrogen (N) : phosphorus (P) : potassium (K); 15 : 15 : 15) was applied at a rate of 312·5 kg/ha in addition to 3100 kg/ha of chicken manure 1 month after planting. Pest management was applied as necessary.
Genetic linkage map construction
Genomic DNA samples were isolated from young leaves of the parental lines and all F1 population samples by a modified CTAB method (Doyle & Doyle Reference Doyle and Doyle1987). Newly developed SSR primers were designed based on the sequences of the 200 kilobase pairs (kbp) covering regions of the PR genes from the cassava genome database using the primer design tool WebSat (http://wsmartins.net/websat/). Genomic DNA was amplified by PCR and products analysed by electrophoresis on 50 g/l polyacrylamide gels as described previously (Boonchanawiwat et al. Reference Boonchanawiwat, Sraphet, Boonseng, Lightfoot and Triwitayakorn2011). Amplification products were visualized by the silver staining method as described by Benbouza et al. (Reference Benbouza, Jacquemin, Baudoin and Mergeai2006). All primers were tested for polymorphism with genomic DNA of both parental lines and informative polymorphic primers were used to genotype the F1 mapping populations. The genotypic data were scored and recorded as cross-pollination (CP) type codes (e.g. <ab × cd>, <ef × eg>, <lm × ll>, <nn × np> and <hk × xhk>). The data were combined with genotypic data published previously by Whankaew et al. (Reference Whankaew, Poopear, Kanjanawattanawong, Tangphatsornruang, Boonseng, Lightfoot and Triwitayakorn2011) and Sraphet et al. (Reference Sraphet, Boonchanawiwat, Thanyasiriwat, Boonseng, Tabata, Sasamoto, Shirasawa, Isobe, Lightfoot, Tangphatsornruang and Triwitayakorn2011) who originally reported the genetic linkage maps of populations A & B, respectively. Moreover, additional EST-SSRs developed by Sraphet et al. (Reference Sraphet, Boonchanawiwat, Thanyasiriwat, Boonseng, Tabata, Sasamoto, Shirasawa, Isobe, Lightfoot, Tangphatsornruang and Triwitayakorn2011) were also included in the linkage map of population A. A genetic linkage map of the combined populations was constructed using JoinMap®/version 3.0 (Van Ooijen & Voorrips Reference Van Ooijen and Voorrips2002). Map construction was performed using the Kosambi mapping function with JoinMap parameter settings as follows: recombination frequency <0·40 and logarithm of odds (LOD) >1·00 as described by Stam (Reference Stam1993). The genetic linkage map was drawn using MAPCHART/version 2.0 software (Voorrips Reference Voorrips2002).
Phenotypic evaluation of cassava anthracnose disease infection
Detached leaves from plants of the cassava F 1 mapping populations were infected with Colletotrichum gloeosporioides f. sp. manihotis in a detached leaf assay as previously described by Kunkeaw et al. (Reference Kunkeaw, Worapong, Smith and Triwitayakorn2010a ). Briefly, the third youngest fully expanded leaf was collected from individual plants of the F 1 mapping populations. Seven leaves per individual plant were used which consisted of one physiological control, one non-infected control and five infection replicates. The edge of a C. gloeosporioides colony cultured on potato dextrose agar (PDA) was cut using an 8 mm diameter cork borer and placed on detached cassava leaves freshly wounded on the middle vein. The inoculated leaves were placed in plastic bags with wet cotton which were then closed and incubated at room temperature with ambient light. Physiological control leaves were not wounded or inoculated, while non-infected controls were wounded by the cork borer before addition of PDA with no fungal growth. At 4 days post infection, the lesion length was recorded and calculated for the lesion size according to Kunkeaw et al. (Reference Kunkeaw, Worapong, Smith and Triwitayakorn2010a ) using the formula:
 $${\rm Lesion \;size} \;\left( {{\rm mm}} \right) = \left( {A + B} \right)/2$$
where A is the longest diameter of lesion area and B is the perpendicular diameter with A.
The phenotypic analysis of all 200 F 1 mapping populations was performed with two replications in order to observe the environmental effect of planting location. Statistical analysis of data normality and correlation tests was performed using the PASW® Statistics Base 18.
Quantitative trait loci mapping
The two replications of CAD infection performed on the F 1 mapping populations and the genetic linkage map of the combined populations were integrated for analysis of QTL underlying resistance to CAD using the computer package MapQTL®/version 4.0 (Van Ooijen et al. Reference Van Ooijen, Boer, Jansen and Maliepaard2000). As described elsewhere (Boonchanawiwat et al. Reference Boonchanawiwat, Sraphet, Boonseng, Lightfoot and Triwitayakorn2011), a two-stage multiple QTL mapping (MQM) analysis was performed. Briefly, map QTL permutation tests were carried out and the LOD values of significance P ⩽ 0·05 and P ⩽ 0·01 were taken as the estimated critical values at which to declare the presence of a QTL. The LOD profiles from the interval mapping were examined and the closest marker to each LOD peak was selected as a cofactor and used in an MQM mapping analysis to search for other peaks in the LOD profiles. Kruskal–Wallis (KW) analysis or a single marker analysis was used to test a marker associated with the segregation of a QTL between individual markers and the trait at significance P ⩽ 0·01. The software MAPCHART/version 2.0 was used to draw QTL mapping on the genetic linkage map.
Gene annotation
The DNA markers that were located close to QTL regions and showed KW significance at P ⩽ 0·001 were selected. Sequences of the selected markers were analysed against the cassava genome database by basic local assignment search tool (BLAST) search to obtain scaffolds where the markers were located. Using phytozome, the whole scaffolds were analysed to identify transcript sequences followed by functional annotations of all transcripts. Candidate resistance (R) genes were chosen based on their predicted similarity to published plant R genes.
RESULTS
Genetic linkage map construction
Genotypic data of F 1 populations which were previously recorded as a CP type code were integrated with data generated by the analysis of 28 newly developed SSR markers. In total, 712 SSR and EST-SSR markers were incorporated to generate genotypic data of the F1 populations, which were combined to construct the genetic linkage map of cassava used in the current study. The expected Mendelian segregation ratio of each marker in the mapping population was tested by the Chi-square test (P < 0·1). The result showed that the genetic linkage map of cassava consisted of 512 SSR and EST-SSR markers distributed on 24 linkage groups. The total map length was 1771·9 centimorgan (cM) with a mean interval of 5·7 cM (Fig. 1).
The genetic linkage map of cassava F1 populations based on simple sequence repeat (SSR) and expressed sequence tag-SSR (EST-SSR) markers. Distances in Kosambi units (cM) were indicated on the left of each linkage group and marker names were indicated on the right side. The map consists of 512 markers distributed on 24 linkage groups.

Phenotypic evaluation of cassava anthracnose disease infection using detached leaf assay
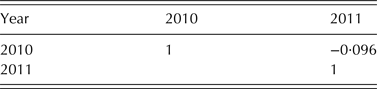
Phenotypic data of CAD susceptibility of all 200 F 1 samples derived from the two mapping populations (A and B), generated by a detached leaf assay test, was collected and recorded for the years 2010 and 2011. The calculations of means, minimum and maximum values, standard deviations, skewness and kurtosis were performed and are summarized in Table 1. Lesion size ranged from 12·5 to 19·6 mm and from 12·9 to 27·0 mm in 2010 and 2011, respectively. In 2010, skewness was <0·28 and peaking (Kurtosis) was within 0·02, while skewness was <0·52 and kurtosis was within 0·02 in 2011. Phenotypes were approximately normal, which inferred the traits were polygenic (or quantitative). Correlations among replications within the 2 years are shown in Table 2. In 2010, the significance of negative correlation between replications 1 and 2 was −0·204 (P < 0·01). The significance of correlation between replications 1 and 2 was positive at 0·4231 (P < 0·01) in 2011. Correlation tests of average lesion sizes from both replications showed a negative correlation (−0·096) between years 2010 and 2011 (Table 3). Broad sense heritability based on plot entry means for CAD resistance was 60% in 2011.
Means, ranges and statistical parameters for lesion areas of cassava anthracnose disease infection

Pearson correlations for lesion areas of cassava anthracnose disease infection among lines of the F1 mapping populations in different replications and years. R1: replication I; R2: replication II

Pearson correlations for average lesion areas of cassava anthracnose disease infection among lines of the F1 mapping populations in different years

Quantitative trait loci mapping
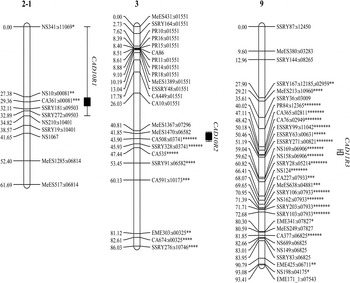
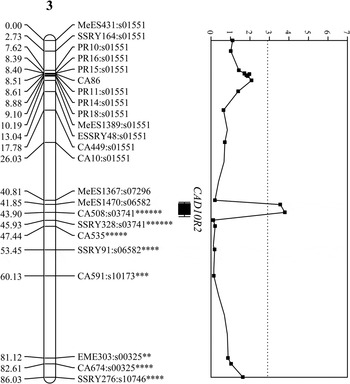
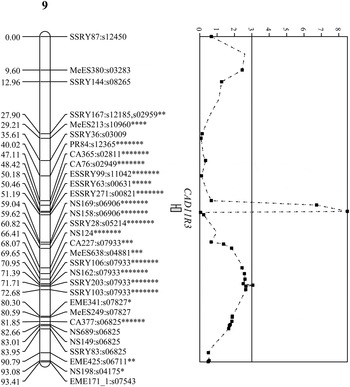
From MQM analysis, a total of three QTL regions associated with CAD infection were detected on three linkage groups. In 2010, two QTL, CAD_10R1 and CAD_10R2 were located on linkage group 2–1 and 3, respectively, while QTL, CAD_11R3 located on linkage group 9 was identified in 2011. CAD_11R3, which is linked to ESSRY99, showed the highest LOD score of 8·5 with the highest phenotypic variance explained (PVE) of 0·182. The summary of the results of the QTL analysis are shown in Table 4 and Figs 2–4.
Quantitative trait loci (QTL) underlying resistance to cassava anthracnose disease (CAD) showed the location of three QTL on linkage groups 2–1, 3 and nine of the cassava F1 population. R = Rayong province; 10 and 11 were years 2010 and 2011, respectively. 1, 2 and 3 were numbers of identified QTL.

Quantitative trait loci (QTL) underlying resistance to cassava anthracnose disease (CAD) showed the location on linkage groups 3 of the cassava F1 population. Marker names plus scaffold locations indicated on the right side. (*) indicates the markers significantly associated with the quantitative trait of resistance to CAD (P ⩽ 0·001). Graph displays the logarithm of odds (LOD) threshold at 2·9 and the QTL peak at 3·6, indicating a significant QTL position.

Quantitative trait loci (QTL) underlying resistance to cassava anthracnose disease (CAD) showed the location on linkage groups 9 of the cassava F1 population. Marker names plus scaffold locations are indicated on the right side. (*) indicates the markers significantly associated with the quantitative trait of resistance to CAD (P ⩽ 0·001). Graph displays the logarithm of odds (LOD) threshold at 3·0 and the QTL peak at 8·5, indicating a significant QTL position.

The results of quantitative trait loci (QTL) analysis for cassava anthracnose disease (CAD) resistance on the genetic linkage map of cassava F1 populations by MapQTL program

αg, genome wide significance threshold; αc, chromosome wide significance threshold; PVE, phenotypic variance explained for the QTL, KW: Kruskal–Wallis analysis of individual markers that linked to the QTL. R was Rayong province; 10 and 11 were years 2010 and 2011, respectively. 1, 2 and 3 were numbers of identified QTL.
LG, linkage group; LOD, logarithm of odds.
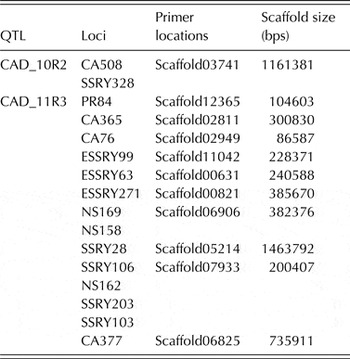
From KW analysis, the test ranked all individuals and classified them by the association between QTL and their marker genotype. The quantitative trait data of lesion sizes from CAD infection evaluations were directly assigned to MapQTL® 4·0 program. The markers in the QTL mapping that were significantly associated with the quantitative trait (P ⩽ 0·001) are shown in Table 5.
List of markers in the quantitative trait loci (QTL) mapping that significantly associated with the quantitative trait of resistance to cassava anthracnose disease (CAD) (P ≤ 0·001)

Gene annotation
From the results of the KW analysis, 16 markers showed a significant association between the trait and their genotype at a significance of P ⩽ 0·001. A BLAST search against the cassava genome database using the marker DNA sequences showed that these 16 markers were found to be located on 11 scaffolds that covered 6026·4 kbp (Table 5). Based on gene annotations, a total of 282 transcripts were found from the 11 scaffolds consisting of 104 transcripts that were classified as defence-related genes. A sub-set of 23 of the 104 defence-related genes were identified as candidate resistance (R) genes by virtue of amino acid sequence homology with published plant R genes (Table 6). These 23 transcripts might be candidate R genes against CAD in cassava.
Example of amino acid sequence homology with published plant R genes

DISCUSSION
The genetic linkage map of cassava constructed in the current study has 24 linkage genes that are comprised of 512 markers. The total length of the map is 1771·9 cM with a mean interval of 5·7 cM, indicating that the map is suitable for QTL analysis. Phenotypic evaluation of CAD infection by a detached leaf assay showed that the average lesion sizes in 2010 and 2011 of cassava variety HB60 were 14·8 and 18·1 mm, respectively, which were smaller than those in HT (20·9 and 22·5 mm, respectively). The current result agrees with the previous study by Kunkeaw et al. (Reference Kunkeaw, Worapong, Smith and Triwitayakorn2010a ) which showed that HB60 is more resistant to CAD than the HT variety. The phenotype in the F 1 populations demonstrated a continuous distribution varying from 12·5 to 19·6 mm and 12·9 to 27·0 mm in 2010 and 2011, respectively, suggesting that resistance to CAD is not controlled by a single resistance gene but by a complex of resistance genes. A test of correlation between the 2 years showed a negative correlation that may arise from environmental effects due to differences in temperature between the 2 years.
A total of three QTL were identified from both years, indicating that at least three possible chromosomal regions are involved in CAD resistance in cassava. However, no common QTL between the 2 years was identified. The phenotypic evaluation of CAD infection of the F1 mapping population between the 2 years might be significantly affected by environment, particularly temperature. Phenotypic evaluation of resistance to anthracnose disease of each year in the current study was undertaken at room temperature, and the results showed different effects on plants between the years, thus affecting QTL detection over the studied years. As reported by Thomas et al. (Reference Thomas, Sweetingham, Yang and Speijers2008) temperature has a high impact on anthracnose infection in lupin cultivars: the study indicated that the mycelial growth rate of C. lupini was temperature-dependent and the resistance mechanism of lupin cultivars was less effective at higher temperatures. Moreover, Than et al. (Reference Than, Prihastuti, Phoulivong, Taylor and Hyde2008) showed that environmental factors such as temperature played a crucial role in the development of disease epidemics of anthracnose infection and resistance in lupins. In addition, Ma et al. (Reference Ma, Bai, Zhang and Lu2006), who studied Chinese spring wheat, found that environment affected most QTL and indicated that the same locus may express different degrees of Fusarium head blight (FHB) resistance in different environments. Therefore, different environmental factors, particularly temperature during phenotypic evaluation, could result in the different QTL detected in the current study.
The highest LOD score QTL was for CAD_11R3, which showed an LOD score of 8·5 and PVE of 0·182. This QTL might therefore harbour a set of R genes that mediate resistance against CAD infection in cassava. The ESSRY99 marker linked to CAD_11R3 showed three allele classes (hh, hk and kk). Based on the KW analysis, the average lesion sizes of these three classes are hh = 17·2 mm (n = 43), hk = 18·0 mm (n = 101) and kk = 20·2 mm (n = 50), indicating that allele class hh is possibly related to the resistance phenotype, while allele class kk is possibly linked to susceptible plants.
The 16 DNA markers that showed significance at P ⩽ 0·001 in the KW analysis and were located near the QTL regions were selected and their sequences searched against the cassava genome database by a BLAST search. Gene annotation of the scaffolds that contained nucleotide sequences of these 16 DNA markers was performed. There were 23 transcripts from a total of 282 transcripts that were selected as candidate R genes based on their amino acid motif organization (Gururani et al. Reference Gururani, Venkatesh, Upadhyaya, Nookaraju, Pandey and Park2012) and having domain homology to some of the published R genes, such as the tetratricopeptide repeat (TPR), serine–threonine protein kinase, protein tyrosine kinase, leucine-rich repeat (LRR), Toll/interleukin-1-receptors (TIR) and the lysine motif (LysM)domain (Romeis Reference Romeis2001; Li et al. Reference Li, Li, Bi, Cheng, Li and Zhang2010; Kishimoto et al. Reference Kishimoto, Kouzai, Kaku, Shibuya, Minami and Nishizawa2011; Gururani et al. Reference Gururani, Venkatesh, Upadhyaya, Nookaraju, Pandey and Park2012). These 23 candidates R genes might be potential resistance genes against CAD in cassava, and further experiments such as gene expression analysis and/or gene silencing analysis should be performed in order to analyse the expression or functions of those genes.
The current research was supported by National Center for Genetic Engineering and Biotechnology (BIOTEC), National Science and Technology Development Agency (NSTDA), Thailand (Grant No. P-12-01382) and Mahidol University. Financial support from the Thailand Research Fund through the Royal Golden Jubilee Ph.D. Program to AB and KT (Grant No. PHD 4LMU/52/W1) is acknowledged.