I. INTRODUCTION
The phenomenon of the “smaller-being-stronger” size effect of materials has attracted a lot of attention since first reported in the 1950s via tensile tests on metallic whiskers. Reference Brenner1,Reference Brenner2 The past decade has seen the unveiling of the defining characteristics of such a phenomenon through compression tests on micropillars of metals fabricated by means including focused ion-beam (FIB) milling. Reference Uchic, Dimiduk, Florando and Nix3–Reference Greer and Nix5 For metals with a monolithic, single crystalline microstructure in the submicron size regime, the condition of “dislocation starvation” generally prevails, in which the deforming specimen is continuously depleted of dislocations due to their ease of zipping out of the specimen volume. Reference Greer and Nix5–Reference Oh, Legros, Kiener and Dehm8 Generation of new dislocations is continuously needed to sustain the deformation, leading to successive emission of strain bursts. Reference Senger, Weygand, Gumbsch and Kraft9–Reference Jennings, Li and Greer11 In this regime, the strength data scatter significantly, precluding clear-cut conclusion on whether strength depends on size to be drawn, although theoretically it has been suggested that a weak stronger-being-smaller size effect should exist, as a smaller specimen should contain fewer nucleation sites for dislocations. Reference Ng and Ngan12,Reference Ng and Ngan13 In the size regime of over a micron, the strength is found to vary with the specimen size according to a power law, Reference Dimiduk, Uchic and Parthasarathy4,Reference Greer and Nix5,Reference Ng and Ngan12,Reference Bei, Shim, George, Miller, Herbert and Pharr14,Reference Dou and Derby15 and plastic flow still occurs in a jerky manner through the continuous emission of strain bursts. Reference Ng and Ngan12,Reference Ng and Ngan13,Reference Zaiser, Schwerdtfeger, Schneider, Frick, Clark, Gruber and Arzt16 In the “source truncation” mechanism, Reference Parthasarathy, Rao, Dimiduk, Uchic and Trinkle17–Reference Ryu, Cai, Nix and Gao19 single-arm dislocation sources truncated by free surfaces determine the strength, and in a smaller sample, the source arms are in general shorter giving higher strength. It has also been demonstrated recently that the power law relation between the strength and size would be a natural consequence if the strength is governed by Taylor hardening in a dislocation network of fractal geometry Reference Gu and Ngan20–Reference Alcalá, Očenášek, Nowag, Ojos, Ghisleni and Michler23 ; in this case, the power exponent in the size effect is inversely related to the fractal dimension of the dislocation network. There is by now a general agreement that the dislocation quantity may significantly affect the plastic deformation of microspecimens, Reference El-Awady24,Reference Lee, Han and Nix25 and several attempts have been made to modulate the dislocation density of microspecimens via prestraining, Reference Lee, Han and Nix25–Reference Bei, Shim, Pharr and George27 surface coating, Reference Ng and Ngan28 or including an internal grain boundary to block dislocations, Reference El-Awady24–Reference Gu and Ngan26 to demonstrate that the size-dependent and jerky plasticity is dependent on the conditions of storing versus losing dislocations in a small volume. Reference El-Awady24,Reference Gu and Ngan26
Despite the large volume of work on size effects of strength carried out so far, the majority of the efforts have been on pure metals with a monolithic single-crystalline microstructure. On the other hand, real-life metallic materials are predominantly alloys with more complicated microstructures such as second-phase precipitates, solutes, and grains, the internal length scales of which would definitely influence strength and deformation. In general, when effects from both the external specimen size and internal microstructure length scale are at play, Reference Ngan, Chen, Leung, Gu and Gan29,Reference Greer and De Hosson30 a good understanding on strength and deformation is lacking. For example, previous bi- or polycrystalline experiments on nano/microspecimens Reference Ng and Ngan31–Reference Lei, Zhang, Niu, Liu, Zhang and Sun34 have demonstrated such interesting coupling effects between the external specimen size and the internal microstructure length scale, and recently, the size dependent strength of nano-twinned materials has also been studied. Reference Choi, De Cooman, Sandlöbes and Raabe35–Reference Imrich, Kirchlechner, Motz and Dehm38
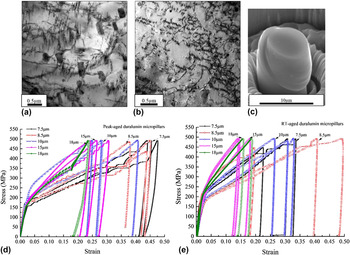
In this article, we report an unusual “weakest size” effect in microspecimens with a precipitation microstructure [Figs. 1(a) and 1(b)]. Precipitated alloys represent a great majority of metallic materials in real use due to their high strength and ductility, Reference Wang, Starink and Gao39–Reference Starink, Gao, Davin, Yan and Cerezo43 and yet their size effects in the nano-, micro-, or even meso-scales are entirely unknown. The available data to date on this aspect for duralumin, a classical precipitated alloy of aluminum, have been inconclusive or even counterintuitive: for duralumin micropillars in the size range of ∼1–6.5 µm, compression tests have shown a high proof strength obeying a similar power law with size as that of pure Al, albeit with weaker size dependence, and creep tests have shown a faster creep rate in larger specimens. Reference Gu and Ngan26,Reference Gu and Ngan44,Reference Galindo-Nava and Rae45 Both types of tests therefore indicate a “bigger-being-weaker” size effect in the microsize range, but it is also well known that duralumin is not weak in bulk forms. Hence, the “bigger-being-weaker” size effect is not expected to continue into the tens-of-microns size range and beyond, but no data have yet indicated this. Microstructurally, the second-phase precipitates in duralumin should provide internal microstructural length scales but how these affect strength and deformation in specimens of different external sizes is also unknown. The purpose of this study is therefore to investigate the plastic deformation of duralumin micropillars over a wide size range to over 18 μm [Fig. 1(c)]. The results unveil a novel weakest size of duralumin, and mechanistic explanation is given.
TEM micrograph showing the typical precipitated microstructure of (a) peak-aged and (b) RT-aged duralumin. (c) SEM image of a typical 7.5 μm diameter RT-aged micropillar deformed at 500 MPa. Nominal stress–strain curves of peak-aged (d) and RT-aged (e) duralumin micropillars milled to different diameters with a long axis parallel to ∼[011] direction.

II. EXPERIMENTAL
A large piece of aluminum 2025 alloy (Al–4 wt% Cu–1.3 wt% Mg–1.3 wt% Ag–0.6 wt% Mn) was cut into smaller pieces which were then subjected to homogenization heat treatment at 500 °C for 24 h. Afterward, the specimens were solution-heated at 520 °C for 3 h, followed by quenching into icy water and then stretching by 2–5%. One batch of the specimens was naturally aged at room temperature (RT ∼25 °C) for several weeks, whilst another batch was artificially aged in an air furnace at 170 °C for 15 h to reach a peak-ageing state [Fig. 1(a)] with hardness similar to that reported previously. Reference Gu and Ngan44 Afterward, the two batches of samples were mechanically ground and finely polished with 1 μm diamond paste to achieve mirror-like surfaces. Specimens were then vibration-polished with a Buehler VibroMet 2 polisher (Buehler Ltd., Lake Bluff, Illinois) using a MasterSet 0.06 μm colloidal silica suspension to achieve a stress-free surface state. The grain size of aged duralumin was measured as over 200 μm using electron backscattered diffraction (EBSD) mapping. Their Vickers hardness was measured as ∼120 and ∼110 Hv for the peak- and naturally aged states, respectively.
Micropillars were fabricated by using FIB milling in an FEI Helios Nanolab 600i DualBeam FIB/SEM system (FEI Company, Hillsboro, Oregon) operating at 30 kV ion beam voltage. A large grain with an orientation of ∼[011] as detected by EBSD mapping and a grain size larger than 200 μm was selected for the micropillar milling. The FIB milling process consisted of a series of concentric annular pattern milling steps using current from 60 nA, for the initial coarse milling step, to 50 pA, for the last fine milling step. As the strength of pillars smaller than ∼6.5 μm for the same alloy states has been measured previously, Reference Gu and Ngan44 in this study, we focused on pillars larger than this size. Specifically, pillars of diameter 7.5, 8.5, 10, 15, and 18 μm were milled, with the ratio of height to diameter fixed at 3.5:1, as in the previous report Reference Gu and Ngan44 for direct comparison purposes. Compression of the fabricated micropillars was performed at room temperature (∼20 °C) by an Agilent G200 NanoIndenter (Agilent Technologies, Santa Clara, California) equipped with a flat-ended diamond punch in a load-controlled method. Before the compression tests, the thermal drift was controlled to below 0.1 nm/s and was remeasured to check for consistency during the unloading stage. Loading and unloading took place at a rate of ∼12 MPa/s, with the resultant strain rate of all micropillars within the order of ∼10−3/s. Room-temperature creep tests were also performed in the same NanoIndenter in a load controlled manner, by first raising the load to different peak values at a rate of ∼12 MPa/s, followed by load holding at the peak value for 200 s, before unloading. Other conditions were kept the same as in a previous study. Reference Gu and Ngan46 The deformed and undeformed micropillars were examined by a Hitachi S4800 FEG scanning electron microscopy (SEM; Hitachi Corp., Tokyo, Japan). Furthermore, longitude (transmission electron microscopy) TEM sections along the height axis of the deformed pillars with a thickness of around ∼1 µm were cut by FIB and were then welded onto an Omniprobe (Oxford Instruments, Abingdon, United Kingdom) by tungsten deposition, followed by removing from the bulk substrate by FIB. Finally the TEM specimens were finely milled to under 100 nm thick after cutting from the Omniprobe and welded onto copper TEM grids again by FIB. TEM examination was carried out in an FEI Tecnai G2 20 Scanning TEM (STEM; FEI Company), as well as a JEOL Model JEM-2100F (JEOL Ltd., Tokyo, Japan), at 200 kV.
III. RESULTS
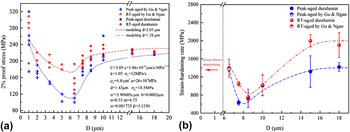
Figures 1(a) and 1(b) show the typical precipitated microstructure of peak-aged and room temperature-(RT)aged duralumin. Rod- and needle-shaped precipitates which are thought to be Al20Cu2Mn3 T-phase and Al2CuMg S-phase, respectively, dominate the matrix of peak-aged duralumin, while fewer large precipitates are seen in the matrix of RT-aged samples. Reference Parel, Wang and Starink42,Reference Gu and Ngan44,Reference Starink, Gao and Yan47 Nanometer-sized Cu–Mg co-clusters and Guinier–Preston–Bagaryatsky (GBP) zones, of size and interspacing much smaller than the T- and S-phases in the peak-aged state, are known to be produced during RT-ageing after water quenching from the solid-solution state and contribute significantly toward hardening, but these are not easily identifiable due to their small sizes. Reference Parel, Wang and Starink42–Reference Gu and Ngan44,Reference Starink, Gao and Yan47–Reference Wang and Starink49 Figures 1(d) and 1(e) show the nominal strain–stress curves of peak-aged and RT-aged duralumin micropillars along the ∼[011] orientation. Compared with pure metallic micropillars of the face-centered-cubic (FCC) crystal structure, Reference Greer and Nix5,Reference Greer, Weinberger and Cai6,Reference Bei, Shim, George, Miller, Herbert and Pharr14,Reference Zhou, Beyerlein and LeSar50 the duralumin here all exhibit smoother and more significant strain hardening. The 2% proof strengths σ0.02 of the duralumin micropillars measured from the stress–strain graphs are plotted in Fig. 2(a), together with the experimental data in the size range of D ≤ 6.5 μm from our previous study. Reference Choi, De Cooman, Sandlöbes and Raabe35 Although the strength data scatter, which is natural for small specimens, it can be seen that as the specimen size D increases, the strength of duralumin in both aged conditions first decreases in the size range from 1 to ∼7 μm, and then increases for sizes larger than ∼7 μm. In the small-size regime of D ≤ 6.5 μm, as reported previously, Reference Gu and Ngan44 a “smaller-being-stronger” size effect approximately describable by the usual power law σ0.02 ∼ D −m occurs, with m roughly equals 0.37 and 0.51 for the RT-aged and peak-aged conditions, respectively. For specimen size in the range 7 < D ≤ 10 μm, the proof strength scatters quite significantly but in general it exhibits a novel “bigger-being stronger” size effect unseen before in micropillar experiments. Finally, for D > 10 μm, the strength of duralumin becomes less dependent on size and is expected to approach the bulk strength. The experimental data in Fig. 2(a) therefore indicate that the two aged states of duralumin become weakest at size ∼7 μm, with compressive proof strengths of ∼130 and ∼100 MPa, respectively, for the RT- and peak-aged conditions, which are significantly smaller than the bulk strengths.
(a) 2% Proof strength versus pillar diameter. Discrete symbols show experimental 2% proof strengths σ0.02, together with experimental data in the size range of ≤6.5 μm from a previous study. Reference Gu and Ngan44 Curves show theoretical σ0.02 for precipitate-spacing d = 2.05 and 1.28 µm for peak-aged and RT-aged conditions, respectively, with other model parameters shown. Figure created based on original research presented in this paper (for size range >6.5 μm) and in Ref. Reference Gu and Ngan44 (for size range ≤6.5 μm), adapted with permission from Ref. Reference Ngan, Chen, Leung, Gu and Gan29 where part of the data was first published. (b) Strain-hardening rate measured from the nominal stress–strain curves. Data of size range less than 6.5 µm are obtained from a previous study. Reference Gu and Ngan44 Due to the significant strain bursts in micropillars smaller than 5 µm, the work-hardening rate in this size range could not be measured accurately.

The strain-hardening rates dσ/dε (σ = stress, ε = strain) of micropillars larger than 6.5 µm were also measured from the stress–strain behavior and these are plotted in Fig. 2(b), while data for smaller micropillars are omitted due to significant strain bursts. The strain-hardening rate of duralumin in both aged conditions also follows a similar falling and rising trend as the proof strength with increasing pillar size. At a size of around 7 μm, both the proof strength and strain-hardening rate reach minimum values.
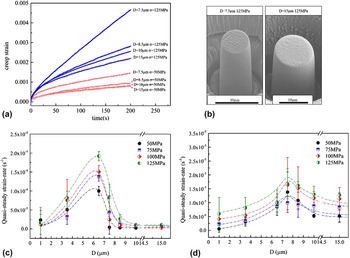
Figure 3(a) shows the creep behavior of peak-aged duralumin micropillars of different sizes at two stress levels of 50 and 125 MPa. In the size range of ∼7 < D ≤ 10 μm studied, the creep strain is always larger for smaller D, which is opposite to the trend for the size range 1 μm < D ≤ 6.5 μm. Reference Gu and Ngan46 Figure 3(b) shows the typical SEM morphology of crept peak-aged micropillars of sizes 7.5 and 10 µm at 125 MPa. Figures 3(c) and 3(d) summarize the quasi-steady creep rate of the peak-aged and RT-aged duralumin in the size-range from 1 to 15 µm, together with the data obtained previously. Reference Gu and Ngan46 Here, the quasi-steady creep rate is calculated as the average strain rate during the last 10 s of the load holding, after correcting for the thermal drift. Despite the scatter of the data, a clear rising and then falling trend of the creep rate is observed from both the peak-aged and RT-aged pillars on increasing size, and for both cases, a maximum in the creep rate occurs at around 7 μm, which is also the size at which the proof strength and strain-hardening rate become the smallest from Fig. 2. The results in Figs. 2 and 3 together indicate that, as the specimen size increases, the precipitated duralumin first becomes softer in the regime of 1 < D < ∼7 µm, and then becomes stronger in the size range D > ∼7 µm. At the size of ∼7 µm, duralumin exhibits the lowest strength and strain-hardening rate, and the fastest creep.
(a) Creep strain versus holding time of peak-aged micropillars under the stress of 50 and 125 MPa. (b) SEM images of typical 7.5 and 15 µm peak-aged micropillars after creep tests at 125 MPa. Quasi-steady strain rate of peak-aged (c) and RT-aged (d) micropillars versus pillar diameter under different stress values. Data below 6.5 µm are obtained from a previous work. Reference Gu and Ngan46

Figure 4(a) shows a typical bright-field STEM image of a deformed RT-aged duralumin pillar. Dense dislocations are seen as curved short segments in the microstructure. Dislocation densities were estimated from similar TEM images by the line-interception method, i.e., random lines were drawn on the TEM images to make interceptions with dislocations, and then the average distance l between neighboring dislocation lines was measured to estimate the dislocation density ρ as 1/l 2. The measured dislocation densities are shown in Fig. 4(b) for the peak-aged condition. It can be seen that the residual dislocation density in deformed duralumin is as high as over 1 × 10¹⁵/m2, and, more interestingly, ρ exhibits a peak value at a pillar size that approximately corresponds to the lowest strength in Fig. 2 or the fastest creep in Fig. 3.
(a) Bright-field STEM image of a typical deformed RT-aged micropillars of 7.5 µm diameter with BD ∼[112]. (b) Dislocation density versus size of duralumin. Discrete data bars show total dislocation densities of deformed peak-aged micropillars measured from TEM images with BD ∼[112] and
 $\mathord{\buildrel{\lower3pt\hbox{$\scriptscriptstyle\rightharpoonup$}}\over g} = \left( {\bar 1\bar 11} \right)$
. The curve shows model prediction with d = 2.05 µm. (c) Theoretical σ0.02 of different precipitate spacing d versus micropillar size. (d) Predicted density and mean free path of mobile dislocations versus micropillar size at stress 500 MPa for different precipitate spacing d. Adapted with permission from Ref. Reference Ngan, Chen, Leung, Gu and Gan29. Figure created based on original research presented in this paper, first published in MRC.

IV. DISCUSSION
The present results indicate a novel size effect in the strength of duralumin, i.e., the strength reaches a lowest value at a pillar size of about 7 µm, at which the dislocation density in the deforming specimen also reaches a peak value. Such a nonmonotonic size effect is unseen before in compression experiments on micropillars of pure metals including pure Al, which would serve as a control for duralumin to compare with. Since duralumin is an Al-based alloy containing second-phase precipitates, the internal length scale of the latter should couple with the specimen size to govern strength and deformation. To gain insights into such coupling effects, a theoretical model was devised and details are given in the Appendix. The evolution of the mobile dislocation density ρm is assumed to be governed by the following law:
 $${\dot \rho _{\rm{m}}} = C{\sigma ^n} - {{{\rho _{\rm{m}}}} \over {k\Lambda }}\bar v\quad ,$$
where n, k, and C are constants, and
 $\bar v$
is the dislocation velocity, which is assumed to be a power law of the effective glide stress comprising contributions from the applied stress σ, precipitation resistance, and Taylor hardening. In Eq. (1), the first term represents dislocation generation and the second term annihilation, with Λ being the mean free path of the mobile dislocations before being captured by precipitates or annihilating at free surfaces. The stress–strain relation is predicted as
 $$\sigma = {\left[ {\left( {n + 1} \right)\dot \sigma \cdot \left( {{\varepsilon \over {Ck\Lambda b}} + {{\Delta \rho } \over C}} \right)} \right]^{{1 \over {n + 1}}}}\quad ,$$
where Δρ is the increase in ρm compared with the zero-strain state,
 $\dot \sigma$
is the loading rate which is assumed to be constant, and b is the magnitude of the Burgers vector. The mean free path Λ is determined by the probability that dislocations are trapped by the precipitates that are spaced d apart versus that when dislocations can traverse through the entire specimen thickness D.
The predicted 2% proof strength σ0.02 as a function of the pillar size and average precipitate spacing is plotted in Fig. 4(c). It can be seen that all curves of σ0.02 versus pillar-size exhibit a common trend of first falling and then rising as the specimen size increases, reaching a plateau in the end. Interestingly, the model prediction with a mean precipitate spacing of d = 1.28 and 2.05 µm is found to well match the experimental curves of RT- and peak-aged micropillars, respectively, as shown in Fig. 2(a). Moreover, in comparison with the residual dislocation density measured from TEM images, although the actual values differ, the predicted result indicated by the red curve in Fig. 4(b) also shows a density of over 1 × 10¹⁵/m2 and a peak value at similar specimen size as the experimental data.
It is noteworthy that the analysis in Fig. 4(c) indicates that the weakest-size phenomenon of precipitated duralumin always exists, regardless of the precipitate spacing within the range studied. Comparison of Figs. 4(c) and 4(d) also shows that the weakest specimen size is almost that corresponding to the highest density and longest mean free path of mobile dislocations. For specimens smaller than the weakest size, Fig. 4(d) shows that the density of mobile dislocations decreases as the specimen size decreases, and the mean free path Λ of mobile dislocations is always the same order of magnitude as the specimen size D. This indicates that in this regime, mobile dislocations are exhausted mainly by depletion at free surfaces of the specimen as a phenomenon similar to dislocation starvation, rather than by impedance by precipitates. Thus, to sustain the plastic flow, higher stress is necessary to active new dislocation sources or re-mobilize the trapped dislocations. However, in this regime, the size effect of strength is significantly milder than that of pure and pristine Al, and is similar to pure Al containing a high initial dislocation density after heavy prestraining. Reference Gu and Ngan20,Reference Gu, Leung and Ngan51 The similarity in the size effect of strength between precipitated and heavily prestrained Al in this regime indicates that an internal microstructural length scale that is smaller than or comparable to the specimen size would constitute an important factor that governs strength, so that strength becomes less dependent on specimen size. Reference Gu and Ngan44 In the present model, in the size regime below the weakest size, Fig. 4(d) shows that more densely distributed precipitates (smaller d values) impose a stronger hindering effect leading to smaller mean free path Λ. In this regime, on increasing specimen size, zipping out of mobile dislocations becomes increasingly difficult due to the increased specimen thickness, as well as more frequent interactions with precipitates which are now present in larger quantities inside the specimen, so that the quantity of mobile dislocations increases as shown in Fig. 4(d). Moreover, the weakest size is also affected by the internal microstructure length scale d which controls the probability of dislocations encountering pinning precipitates. As can be seen in Fig. 4(c), the weakest size increases gradually as d increases from less than 1–4 μm.
For specimens larger than the weakest size, precipitate hardening becomes increasingly significant as the specimen thickness increases to contain more precipitates, so that dislocations become increasingly blocked by precipitates and hence the mobile dislocation density decreases. As can be seen in Fig. 4(c), the predicted strength increases as the precipitate spacing decreases. Figure 4(d) shows that for specimen sizes larger than the weakest size, the predicted density and the mean free path of mobile dislocations turn to be a decreasing trend with increasing D and finally becomes steady. This is due to the increasing trapping of dislocations by precipitates, and, in fact, the steady values of Λ at large specimen sizes simply become the precipitate spacing d as expected.
Summarizing the above, we can conclude that the weakest size of a precipitated alloy is the size at which both strengthening mechanisms due to dislocation starvation and precipitation hardening are ineffective. This size is too large for easy depletion of mobile dislocations at free surfaces of the specimen, and is too small to contain enough precipitates to block dislocations.
It is also interesting to see from the experimental results in Figs. 2, 3(c) and 3(d) that, in the microsize regime, the RT-aged state of duralumin 2025 is actually stronger and exhibits a milder size effect than the peak-aged, especially in the regime smaller than the weakest size. As mentioned above, in this regime, the specimen contains too few precipitates to impose a significant blocking effect, and dislocation exhaustion is mainly due to annihilation at free surfaces. Thus, the precipitation state that would give peak hardness in the bulk state would have little effects in this regime of specimen size. On the other hand, in the RT-aged state, the Cu–Mg co-clusters, and GBP zones are of nanometer-sized and densely distributed, Reference Wang, Starink and Gao39,Reference Gu and Ngan44,Reference Starink, Gao and Yan47,Reference Adachi, Osamura, Ochiai, Kusui and Yokoe48 and hence compared with the fully developed but more sparsely distributed incoherent phases in the peak-aged state, they are more effective in strengthening a micron-sized specimen in this regime. The results here indicate that the common wisdom of using precipitated phases to strengthen alloys may not be applicable to specimens of micron sizes.
V. CONCLUSIONS
In summary, we have demonstrated a novel weakest-size phenomenon in duralumin 2025 alloy with a precipitated microstructure. For sizes ranging from ∼1 to 7 µm, duralumin micropillars exhibit the usual “smaller-being-stronger” size effect due to easy exhaustion of dislocations at free surfaces, and for sizes larger than ∼7 µm, the strength increases with size until finally reaching a steady value, due to increasing precipitation hardening. The weakest-size regime is the size range too large for easy free-surface annihilation, and too small for effective precipitation hardening. Moreover, in the size regime smaller than the weakest size, the precipitation state that leads to peak hardness in bulk duralumin is less effective in strengthening than the naturally aged state that corresponds to a lower bulk strength. This work shows that the common “smaller-being-stronger” understanding of size effect in the micro-regime is far from complete for complex alloys, and the conventional wisdom of precipitation hardening may not be applicable for microsized alloys.
ACKNOWLEDGMENT
The work described in this paper is supported by funding from the Kingboard Professorship Endowment.
APPENDIX—SIMULATION MODEL
Following Nix and Lee, Reference Nix and Lee52 the rate of change of the mobile dislocation density ρm is assumed as
 $${\dot \rho _{\rm{m}}} = C{\sigma ^n} - {{{\rho _m}} \over \Gamma }\quad ,$$
where Γ is the average lifetime of a dislocation remaining mobile, σ is the stress, and C and n are constants. The two terms in Eq. (A1) account for the generation rate (Cσ
n
) and annihilation rate (ρm/Γ). With the Orowan equation
 $\dot \varepsilon = {\rho _m}\bar vb$
,
Reference Orowan53
where
 $\bar v$
is the average velocity of the mobile dislocations and b their Burgers vector, Eq. (A1) gives the strain rate as
 $$\dot \varepsilon = \left( {C{\sigma ^n} - {{\dot \rho }_{\rm{m}}}} \right)\bar vb{\rm{\Gamma }}\quad {\rm{.}}$$
Γ can be expressed as
 ${\rm{\Gamma }} = k \cdot {{\rm{\Lambda }} \over {\bar v}}$
, where Λ is the mean free path of the mobile dislocations and k is a constant, so that Eq. (A2) becomes
 $$\dot \varepsilon = \left( {C{\sigma ^n} - {{\dot \rho }_{\rm{m}}}} \right)k\Lambda b\quad .$$
Under a load controlled mode of compression at a fixed stress rate
 $\dot \sigma$
, the mean stress evolves with time t as
 $\sigma = \dot \sigma \cdot t$
. Then, Eq. (A3) can be transformed into a total derivative as
 $${\rm{d}}\varepsilon = Ck\Lambda b{\left( {\dot \sigma \cdot t} \right)^n}{\rm{d}}t - k\Lambda b{\rm{d}}{\rho _{\rm{m}}}\quad .$$
Since the model now involves only three variables ε, ρ, and t, we can write ε = ε(ρm, t) and so Eq. (A4) implies that
 $${{\partial \varepsilon } \over {\partial t}} = Ck\Lambda b{\left( {\dot \sigma \cdot t} \right)^n}$$
and
 $${{\partial \varepsilon } \over {\partial {\rho _{\rm{m}}}}} = - k\Lambda b\quad .$$
For a given pillar size and precipitate state, Λ is a constant, and Eqs. (A5) and (A6) now indicate that ∂ε/∂t depends only on t, and ∂ε/∂ρm is a constant; thus ∂ε/∂t and ∂ε/∂ρm can be separately integrated leading to
 $$\varepsilon = \varepsilon \left( {{\rho _{\rm{m}}},t} \right) = {{Ck\Lambda b{{\dot \sigma }^n}} \over {n + 1}}{t^{n + 1}} - k\Lambda b{\rho _{\rm{m}}} + {\hat \varepsilon _0}\quad .$$
At the beginning when t = 0, with an initial mobile dislocation density ρ0, the micropillar should be free of strain. Therefore, the condition of ε(ρ0,0) = 0 will result in the constant term in Eq. (A7) as
 ${\hat \varepsilon _0} = k\Lambda b{\rho _0}$
, so that
 $$\varepsilon \left( {{\rho _{\rm{m}}},t} \right) = {{Ck\Lambda b{{\dot \sigma }^n}} \over {n + 1}}{t^{n + 1}} - k\Lambda b\left( {{\rho _{\rm{m}}} - {\rho _0}} \right)\quad .$$
Writing Δρ = (ρm − ρ0) as the increase in mobile dislocation density (for each pillar size D) upon straining from ε = 0 to the current strain ε, Eq. (A8) can be rearranged to give the proof strength as
 $$\sigma = {\left[ {\left( {n + 1} \right)\dot \sigma \cdot \left( {{\varepsilon \over {Ck\Lambda b}} + {{\Delta \rho } \over C}} \right)} \right]^{{1 \over {n + 1}}}}\quad .$$
The model is not yet closed since Δρ is basically unknown. For different pillar sizes, the loss of dislocations to the free surfaces and the trapping of dislocations by the precipitates as well as Taylor hardening should be different, so that Δρ would not be the same. The evolution of Δρ is governed by Eq. (A1) and other necessary conditions. Eq. (A1) and
 $\Gamma = k \cdot {\Lambda \over {\bar v}}$
give
 $${\dot \rho _{\rm{m}}} = C{\dot \sigma ^n}{t^n} - {{{\rho _{\rm{m}}}\bar v} \over {k\Lambda }}\quad .$$
A velocity law
 $\bar v = c{\left( {{\sigma _{{\rm{eff}}}}} \right)^m}$
can also be assumed, where the effective stress is given by
 $${\sigma _{{\rm{eff}}}} = \left\{ {\matrix{ {\sigma - {{\mu b} \over d} - \alpha '\sqrt {{\rho _{{\rm{tot}}}}} - {\sigma _{\rm{f}}}} {{\rm{if\ }}\sigma > {{\mu b} \over d} + \alpha '\sqrt {{\rho _{{\rm{tot}}}}} + {\sigma _{\rm{f}}}} \cr 0 {{\rm{otherwise}}} \cr} } \right.\quad .$$
The resistance terms in Eq. (A11) represent, respectively, the precipitate hardening μb/d (with d = mean center-to-center spacing of the precipitates and μ = shear modulus), the Taylor hardening
 $\alpha '\sqrt {{\rho _{{\rm{tot}}}}}$
(with ρtot = total dislocation density), and the intrinsic friction σf which also includes solid-solution hardening. Here, the shape and size effects of the precipitates are ignored so the only length scale ascribed to the precipitates is their mean center-to-center spacing d. Thus, putting (A11) into (A10), the governing equation for dislocation density evolution is
 $${\dot \rho _{\rm{m}}} = C{\dot \sigma ^n}{t^n} - c{{{\rho _{\rm{m}}}} \over {k\Lambda }}{\left( {{\sigma _{{\rm{eff}}}}} \right)^m}\quad .$$
During deformation of a bulk crystal containing a low density of impurities, the mean free path Λ of mobile dislocations would be determined by mutual dislocation interactions producing hardening and substructures such as cells. Here, we focus on the regime in which strength is controlled mainly by the internal length scale (d) imposed by the precipitates, as well as the external length scale (D) due to the specimen size. Specifically, in this regime, the mean free path Λ is controlled by the interactions of dislocations with the precipitates, as well as the loss of dislocations to the free surfaces of the specimen due to a limited D. For bulk deformation, the mean free path is also known to evolve with strain, Reference Tamler, Kanert, Alsem and De Hosson54–Reference De Hosson, Kanert, Sleesvyk and Nabarro56 and here, these effects are ignored, so the treatment here would be less applicable to the regime with large D and strain when dislocations accumulate quickly. Therefore, as in a previous analysis on creep, Reference Gu and Ngan46 we write Λ as Λ = F(D) ⋅ D + [1 − F(D)] ⋅ d, in which F(D) is the probability that a mobile dislocation is not pinned by precipitates. Here, the term F(D) · D represents the contribution to Λ by those dislocations that are not pinned and can thus travel over the entire specimen thickness D, and [1 − F(D)]·d is the contribution to Λ by those initially mobile dislocations that are eventually pinned by the precipitates spaced d apart. Furthermore, F(D) should be a monotonically decreasing function of D, i.e., the chance of not getting pinned must be decreasing as the distance traveled increases, and as was done previously, Reference Gu and Ngan46 we assume that F(D) = exp(−αD β) where α and β are positive constants.
In Eq. (A11), the total dislocation density ρtot includes all dislocations not zipping through the micropillar, and so it can be calculated as
 $${\rho _{{\rm{tot}}}} \approx \left( {{\rho _0} + \int_0^t {C{{\dot \sigma }^n}{t^n}\;{\rm{d}}t} } \right) \cdot \left[ {1 - F\left( D \right)} \right] = \left( {{\rho _0} + {C \over {n + 1}}{{\dot \sigma }^n}{t^{n + 1}}} \right) \cdot \left[ {1 - F\left( D \right)} \right]\quad .$$
The model is now closed, and Eq. (A12) is a nonlinear differential equation solvable by a simple finite-difference scheme,
 $$\Delta \rho = \left[ {C{{\dot \sigma }^n}{t^n} - c{{{\rho _{\rm{m}}}} \over {k\Lambda }}{{\left( {{\sigma _{{\rm{eff}}}}} \right)}^m}} \right]\Delta t\quad ,$$
 $${\rho _{\rm{m}}}\left( {t + \Delta t} \right) = {\rho _{\rm{m}}}\left( t \right) + \Delta \rho \quad .$$
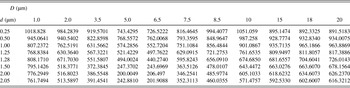
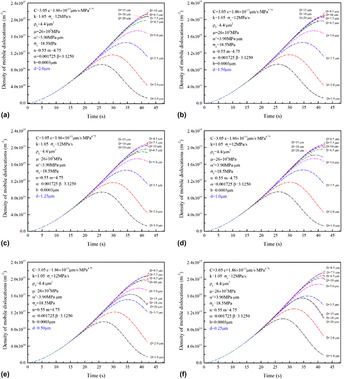
The calculated increment of mobile dislocation density at the proof strain of 0.02 is shown in Table I. Then, inputting the calculated increment in dislocation density into Eq. (A9), the 2% proof strength σ0.02 dependent on the pillar size and average precipitate spacing is calculated and plotted in Fig. 4(c) of the main text. The time evolution of ρm at different specimen size D and precipitate spacing d is shown in Fig. A1. Figure 4(d) summarizes the variation of ρm and Λ with specimen size D.
Density increase of mobile dislocations Δρ0.02 with strain ε = 0.02 solved by numerical integration (unit:/μm2).

Density evolution of mobile dislocations for different precipitate-spacing d from 0.25 to 2.0 μm as specified in (a) to (f). Significant loss of mobile dislocations is due to the strong trap brought by the increasing pinning by precipitates and/or Taylor hardening for large pillars, or easy gliding out from the pillar volume under the high applied stress for small pillars. The curves for the largest specimen sizes D = 15, 18, and 20 µm simulated nearly overlap as they are already close to the bulk state.