INTRODUCTION
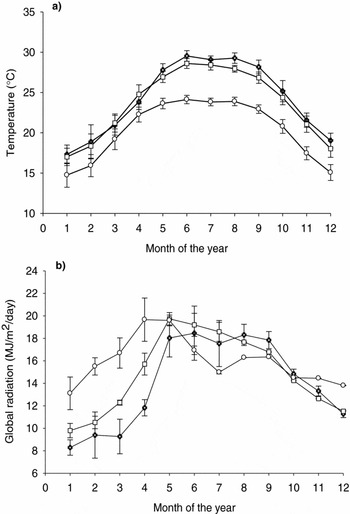
In order to preserve sensitive natural areas on the mountain slopes of continental Southeast Asia, one of the strategies adopted by governments is to intensify agriculture in irrigable valleys bottoms and terraced hillsides to guarantee an income or a sufficient subsistence base for farmers, enabling them to alleviate the pressure exerted on other landscape compartments (Jourdain et al., Reference Jourdain, Boere, van den Berg, Dang, Cu, Affholder and Pandey2014; Linquist et al., Reference Linquist, Trosch, Pandey, Phouynyavong and Guenat2007). The introduction of a second crop cycle – ‘spring crop’ – in irrigable fields before the main summer rice crop each year takes part of this strategy. Whereas rice–rice double cropping is a common practice in regions of low altitude of Asia, its expansion to higher altitudes is hampered by climatic constraints (Dat Van, Reference Dat Van1997; Feng and Fu, Reference Feng and Fu1989). Most of the mountainous area of continental Asia lies at latitudes greater than 20 °N where, during winter and spring, temperatures and incident solar radiation are substantially lower and more variable between years and sites than they are during the summer. On one hand, at the beginning of the spring season, temperature occasionally reaches particularly low values that may destroy the crop. In addition, daily solar radiation is particularly low at this period (e.g. in Vietnam, Figure 1). As a consequence, the radiation potentially used by a crop, as well as the likeliness that the crop escapes from lethal temperature both increase if the crop is sown later in the season. On the other hand, harvest must occur early enough to allow a proper timing of the main rice cycle that takes place during the summer, wet and warm season. Thus, the opportunity to grow an irrigated spring crop in the highlands of continental Asia depends on risks of crop failure due to cold temperatures, reduced yields under low global radiation, and risks that the date of crop maturity delays the installation of the summer crop.
Monthly variation of (a) temperature and (b) global radiation during spring season in 3 locations Phu Ho ( ), Van Chan (
 ) and Mu Cang Chai (
 ). Mean over 10 years ± standard deviation.

The mountainous area of Vietnam is a typical case where the government encourages the development of spring crops despite these risks. Rice, aerobic rice (i.e. able to withstand periods when the rice field is not flooded, Bouman et al., Reference Bouman, Peng, Castaneda and Visperas2005), soybean and maize are the main options promoted by agricultural extension services who provide, additionally to technical training, seeds and fertilizers at attractive prices. Yet so far, in several municipalities of this area, double cropping became the most common practice among farmers. However, it failed to develop in many other locations (Le Quoc Doanh, Reference Le Quoc Doanh2007), climatic constraints and the lack of adapted cultivars being possible causes of the reluctance of farmers to follow the extension services’ recommendations. The summer season begins at the end of June with direct sowing or establishment of nurseries, transplanting taking place around 10–15 July at the latest. Between the spring and summer crops, farmers need around 10–15 days for harvesting, threshing and transport and for soil preparation. So, in order to introduce a spring crop without hampering the summer rice, cultivars and sowing dates have to allow harvesting the spring crop by 5 July, at the latest.
Irrigated rice fields in the northern highlands of Vietnam are found not only along valley floors, with elevation ranging from 15–500 m, but also on terraces carved along slopes, at elevation of up to 1400 m. Apart from the effects of elevation and slope, the climate of the region is known to vary greatly across space. Latitude and the position relatively to the main axis of the relief are key factors of this variation. The cultivars currently available in spring season in Vietnam for the previously mentioned crops (rice, aerobic rice, soybean and maize) are insensitive to photoperiod, so that their cycle duration is mainly determined by temperature, the time interval between sowing and maturity increasing when temperature decreases (Rezaul, Reference Rezaul1997). As a consequence, at a given location and for a given cultivar insensitive to photoperiod, the likeliness of completing the spring cycle before the 5th of July is expected to increase with the earliness of the sowing date.
Experimentally assessing the risks of crop failure due to cold temperature and the risk that the date of crop maturity delays the installation of the summer crop would require experiments to be repeated in many locations and years since they are all highly dependent on temperature and global radiations conditions that are expected to vary strongly with locations and years in mountainous areas. An alternative is the use of virtual experiments performed with adequate simulation models. Models are useful tools to explore management options and design cropping systems suited to environmental constraints. Several authors used models to analyse the impact of climate on cropping systems and their management (e.g. Keating et al., Reference Keating, Carberry, Hammer, Probert, Robertson, Holzworth, Huth, Hargreaves, Meinke, Hochman, McLean, Verburg, Snow, Dimes, Silburn, Wang, Brown, Bristow, Asseng, Chapman, McCown, Freebairn and Smith2003; Launay et al., Reference Launay, Brisson, Satger, Hauggaard-Nielsen, Corre-Hellou, Kasynova, Ruske, Jensen and Gooding2009; Maton et al., Reference Maton, Bergez and Leenhardt2007). Recently, Shrestha et al. (Reference Shrestha, Dibike and Prowse2011) used a phenological model (RIDEV) to test various rice genotypes and develop cropping calendar options for rice-wheat cropping systems in Nepal.
The objective of this study is to use an appropriate simulation tool, PYE (potential yield estimator), and a virtual experiment approach aiming at better identifying, across locations and accounting for inter-annual climate variability, the extent to which radiation and temperature constrain the feasibility of a spring crop through yield reduction, crop mortality, or excessive increase in crop duration in mountainous areas of continental Asia. The model was calibrated and applied to the study case of introducing a spring crop before rice in the northern mountainous area of Vietnam.
MATERIALS AND METHODS
General methodology
The methodology adopted to meet the objectives of this study consists in two main stages.
The first stage was devoted to adapt, calibrate and evaluate the PYE model (Affholder et al., Reference Affholder, Poyedebat, Corbeels, Scopel and Tittonell2013) simulating phenological development and crop growth for rice (irrigated and in ‘aerobic’ condition), maize and soybean without growth limitations from water, nutrients, pests or diseases. The purpose was therefore to estimate potential yield as defined by Lobell et al. (Reference Lobell, Cassman and Field2009) for irrigated systems. PYE had been previously built following the guidelines proposed by Sinclair and Seligman (Reference Sinclair and Seligman1996) for ‘ad hoc’ modelling of potential yield of rainfed agriculture under tropical climate. It uses simple published relationships and model components that have proven to be robust after numerous tests in various environments including environments and crops similar to those of this study. It had been developed aiming at keeping it as simple as possible, not overloaded with unnecessary details, with minimum data requirements and with the reuse of existing model components, and using the principles of interfacing between models and databases as a way to facilitate virtual experiments (Affholder et al., Reference Affholder, Tittonell, Corbeels, Roux, Motisi, Tixier and Wery2012). Its adaptation to the specific purpose of the present study followed the same principles.
In the second stage, the model was used for virtual experiments in which cropping systems were simulated using long term series of temperature and radiation data for a set of locations of contrasted climates, under scenarios combining varied elevations and sowing dates.
Model description
PYE is written in VBasic under Microsoft Access. It uses a daily time step and simulates the duration of a crop cycle depending on thermal time, leaf area index (LAI) dynamics during the cycle, total aboveground biomass production resulting from the interception of incident solar radiation by the LAI, its conversion into biomass depending on the temperature, and yield through the allocation of a share of that biomass to the grain during a grain filling development phase, also determined by thermal time. The crop is assumed to be sown at a ‘standard’ stand density corresponding to the recommendation made by the agricultural support service in the region (see section 2.3). The two following additions were made to the previous version of PYE, in order to make it suitable for the purpose of the present study: (i) the simulation of crop destruction by excessively cold temperatures during early growth stages, and (ii) the simulation of transplanting and its impact on crop development and growth. PYE contains a water balance module and water stress functions reducing potential transpiration and growth, allowing its use for simulating potential yield under rainfed conditions. These components of the model were not used in the present study.
Phenological development model:
Crop development is simulated using the thermal time approach (Gao et al., Reference Gao, Jin, Huang and Zhang1992). A given stage of development i that started on day k is completed on day n if
 \begin{equation}
{\rm TC(i) = }\sum\nolimits_{\rm k}^{\rm n} {{\rm f(T)}} ,\end{equation}
where f(T) = 0 if T < Tdmin; f(T) = T-Tdmin if Tdmin < T < Tdmax; f(T) = Tdmax if T > Tdmax; T is the daily average air temperature (°C) and TC the thermal time constant of the cultivar at stage i (°C d); Tdmin and Tdmax are minimal and maximal thresholds for development of the cultivar. The (i) stages considered were: (1) emergence, (2) end of the juvenile phase corresponding to slow LAI growth, (3) end of rapid LAI growth, (4) start of grain filling (end of flowering), (5) start of senescence and (6) maturity.
The effect of transplantation on development was adapted from the Oryza 2000 model (Bouman et al., Reference Bouman, Kropff, Tuong, Wopereis, Berge and van Laar2001): development is stopped after transplantation for a duration StressShock expressed in thermal time.
From crop emergence to stage 2, the model simulates crop death in the event of exposure to an average daily temperature below a ‘critical cold’ temperature (Tcold) for a number Ncold of consecutive days, also as in the Oryza 2000 model.
LAI dynamics over the crop cycle:
From stages 1 to 3, the LAI is simulated using a logistic function of thermal time borrowed from the model STICS (Brisson et al., Reference Brisson, Mary, Ripoche, Jeuffroy, Ruget, Nicoullaud, Gate, Devienne-Barret, Antonioletti, Durr, Richard, Beaudoin, Recous, Tayot, Plenet, Cellier, Machet, Meynard and Delecolle1998):
 \begin{equation}
{\rm dLAI} = {\rm dLAlmax}/(1 + {\rm exp}(5.5^* (1.5 - {\rm ULAI})))^{*}({\rm T} - {\rm Tdmin}),\end{equation}
where dLAI is the daily increase in LAI; dLAImax is the maximum daily LAI increase; ULAI is the leaf development unit, ranging from 1 to 1.5 between stage 1 and stage 2, and from 1.5 to 3 between stage 2 and stage 3. Between the stages, ULAI is linearly interpolated between these values, proportionally to thermal time. From stage 3 to stage 5 LAI is constant. It then decreases linearly with thermal time, down to the LAImat value reached at maturity (stage 6).
Simulation of above-ground biomass and grain yield:
The simulation of light interception by leaves, its conversion into biomass and distribution between grain and the rest of the above-ground biomass were all borrowed from STICS. Solar radiation intercepted by the leaves Raint is calculated for a day d according to Beer–Lamber's law depending on LAI:
 \begin{equation}
{\rm Raint}({\rm d}) = 0.48^{*}{\rm GR}({\rm d})^{*}(1 - \exp ( - {\rm Kext}^{*}{\rm LAI}({\rm d})),\end{equation}
where GR is the global daily radiation and Kext is the coefficient of radiation extinction for the crop in question.
Then, the daily accumulation of biomass, dBiom, is calculated by the following equation:
 \begin{equation}
{\rm dBiom}({\rm d}) = ({\rm Ebmax}^{*}{\rm Raint(d)} - 0.0815^{*}{\rm Raint}({\rm d})^2 )^{*}{\rm Ftemp}({\rm d}),\end{equation}
where Ebmax is the maximum efficiency of radiation conversion into biomass, and Ftemp is a function accounting from non-optimum temperatures as follows:
 \begin{equation*}
{\rm Ftemp}({\rm d}) = 0\,{\rm if}\,{\rm T(d)}\,{\rm < Tcmin}\,{\rm or}\,{\rm T > Tcmax;}
\end{equation*}
 \begin{equation*}
{\rm Ftemp}({\rm d}) = 1\,{\rm if}\,{\rm T(d) = Tcopt;}
\end{equation*}
 \begin{equation*}
{\rm Ftemp}({\rm d}) = 1 - ({\rm T(d)} - {\rm Tcopt)/(Tcmin} - {\rm Tcopt)}\,{\rm if}\,{\rm Tcmin < T(d) < Tcopt;}
\end{equation*}
 \begin{equation*}
{\rm Ftemp}({\rm d}) = 1 - ({\rm T(d)} - {\rm Tcopt)/(Tcmax} - {\rm Tcopt)}\,{\rm if}\,{\rm Tcopt < T(d) < Tcmax;}
\end{equation*}
where Tcmin, Tcopt, Tcmax are crop specific parameters.
In this model, the grain yield, grain(d), on day d between stage 4 and stage 6 (maturity) is a function of harvest index HI(d) which increases linearly from 0 as a function of thermal time with a crop specific rate called Vitircarb and without exceeding a maximum value (HImax). Grain yield is also limited by the number of grains formed per unit area, Ngrains, and the maximum weight of a grain, P1grainMax, as follows:
 \begin{equation}
{\rm Grain}({\rm d}) = {\rm Min}({\rm Biom}({\rm d})^{*}{\rm Min}({\rm HI(d),}\,{\rm HImax),}\,{\rm P1grainMax^{*}Ngrains),}\end{equation}
where Ngrains is a linear function of average biomass growth VTmean over the flowering stage:
 \begin{equation}
{\rm Ngrains} = {\rm Min}({\rm Ngrmax},\,{\rm Cgrain}^{*}{\rm VTmean} + {\rm Cgrainv}0),\end{equation}
where Ngrmax is the cultivar specific maximum number of grains per unit area at the standard stand density used, and Cgrain and CgrainV0 are crop specific calibration parameters.
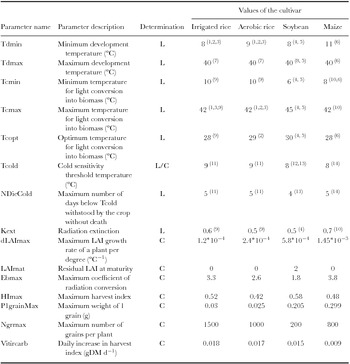
All the components and parameters of this model corresponded to well established and broadly valid modelling approaches of yield and crop duration at cropping system scale. Some of the model parameters were not cultivar-dependent and were set to values available in the literature (Table 1). However, a certain number of cultivar-dependant parameters had to be calibrated using a specific experimental design.
Values of the parameters used in the PYE model.

C: parameter calibrated using data from the experiment; L: value from the literature.
1: Bouman et al. (Reference Bouman, Kropff, Tuong, Wopereis, Berge and van Laar2001); 2: Fukai (Reference Fukai1999); 3: Alocilja and Ritchie (Reference Alocilja, Ritchie and Hodges1991); 4: SOYGRO model, Brisson et al. (Reference Brisson, Bona and Bouniols1989); 5: SOYDEV model, Setiyono et al. (Reference Setiyono, Weiss, Specht, Bastidas, Cassman and Dobermann2007); 6: CERES-Maize model, Birch et al. (Reference Birch, Hammer and Rickert1998); 7: Dingkuhn (Reference Dingkuhn1995); 8: Hungria et al. (Reference Hungria, Chueire, Coca and Megias2001); 9: Confalonieri et al. (Reference Confalonieri, Acutis, Bellocchi and Donatelli2009); 10: STICS model, Brisson et al. (Reference Brisson, Mary, Ripoche, Jeuffroy, Ruget, Nicoullaud, Gate, Devienne-Barret, Antonioletti, Durr, Richard, Beaudoin, Recous, Tayot, Plenet, Cellier, Machet, Meynard and Delecolle1998); 11: Andaya and Mackill (Reference Andaya and Mackill2003); 12: Wang et al. (Reference Wang, Reddy and Quebedeaux1997); 13: Schleppi et al. (Reference Schleppi, Soldati and Keller1990); 14: Janowiak et al. (Reference Janowiak, Luck and Dorffling2003).
Experiments for model calibration
The purpose of the experiments was to calibrate PYE for the four crops involved in this study: irrigated rice, aerobic rice, soybean and maize. The crop cultivars considered were the ones currently best adapted to the spring season according to the local research (NOMAFSI: Northern Mountainous Agriculture and Forestry Science Institute) and extension institutions (Le Quoc Doanh, Reference Le Quoc Doanh2007): Nhi uu 838 (F1 hybrid, indica type) for irrigated rice, IR74371 (indica type) for aerobic rice cultivar, cultivar DT84 for soybean and cultivar LVN99 (F1 hybrid) for maize. All the experiments were sown at standard stand density as recommended by NOMAFSI, i.e. transplanted irrigated rice at 40 plants m–2, and direct seeded rice at 90 plants m–2; aerobic rice at 22 plants m–2, soybean at 30 plants m–2 and maize at 6.2 plants m–2.
The experiments consisted in establishing growing situations that were as close as possible to potential growth conditions, i.e. without any biotic or abiotic stress, on soils that were as suitable as possible. These situations were created with N-P-K fertilization equal to 100‑100–80, plus 10 Mg ha−1 of manure. The plots were irrigated to avoid any water stress and were meticulously and repeatedly weeded, with regular phytosanitary monitoring and appropriate phytosanitary treatments if needed. By varying the locality, elevation, year and sowing date within the year, we sought to establish contrasting temperature and radiation conditions representative of the end of the winter and the spring in the northern highlands of Vietnam. The plots were monitored at two sites during 2010 and 2011:
– NOMAFSI research station in Phu Ho commune, Phu Tho district (N 21°27′; E 105°14′): despite the low elevation of this site (30–50 m), its local climate exhibits low temperature and solar radiations during winter and spring, as compared to the summer season and similarly to places of higher elevations (Figure 1). The advantage of this site was its immediate proximity to the NOMAFSI centre, so more intensive measuring was possible. Each year, for each crop (and planting method in the case of irrigated rice) three sowing dates were tested at this site: early sowing from 28 to 30 January, intermediate sowing from 8 to 10 February and late sowing from 19 to 22 February.
– Farmers’ fields in Suoi Giang commune – Van Chan district (N 21°57′; E 104°57′): this site was covering elevations varying from 200 to 1100 m over a few kilometres, and experimental plots were rented from farmers at three different elevations: 300, 600 and 800 m. The downside of this site was the distance from the NOMAFSI research infrastructures. This site was used for a slightly simplified experimental design with a single sowing date tested each year for each crop and a lower frequency of measurements along the crop cycle.
Each growing situation considered in this study was thus defined by the species cultivated (with the chosen cultivar of that species), the year, the sowing date in the year, the location, the elevation of the location in the case of the Suoi Giang site and the planting method in the case of irrigated rice. Each of these growing situations was replicated three times in unit plots of 15–30 m2 using a randomized block design. There was an automatic weather station (CIMEL) at each site providing daily minimum, maximum, mean air temperatures and daily cumulative global radiation. In addition, recording thermometers were positioned in sheltered ventilated places in the immediate vicinity of each of the experimental plots in the design.
In all the unit plots, emergence, tillering (rice), flowering and maturity were monitored along the crop cycle. Survival or death of the crop during vegetative stage was reported. Above-ground biomass and LAI (using a LICOR LI-2000) were also monitored (one measurement at flowering in 2010 and four measurements in 2011 for above-ground biomass; every 10–12 days at Phu Ho and 15–20 days at Suoi Giang for LAI). Yield components were measured at harvest using samples taken on 1 m2 for irrigated and aerobic rice, and on 3 m2 for soybean and maize.
Model calibration
The objective of model calibration for the cultivar-dependant parameters was to minimize the distance between measurements and model predictions for the three key variables of the study: crop survival to cold temperature during vegetative stage, crop duration and yield under temperature and radiation limited conditions. For the latter two quantitative variables, this distance was assessed using the two following indicators: RMSE (root mean squared error) and the bias (average deviation between observed and simulated values). An intermediary step towards this objective was to ensure a satisfactory fit between observed and measured values of dates of occurrences of the main development stages, LAI and above-ground biomass along the development cycle, as a way to reduce the risk that good estimates of the key variables of the study result from compensating errors on intermediary variables. The calibration parameters were estimated seeking the best fit between the simulated variables depending on a given parameter or set of parameters, and the corresponding observed variables, for all the experimental growing situations for each crop in our experimental device.
Following this principle, thermal time constants were first calibrated for the emergence to flowering and the flowering to maturity period. Next, the parameters of LAI dynamics, i.e. dLAImax, LAImat and those of the thermal constants (TC) not determined at the previous step were estimated by fitting simulated LAI curves to observed LAI data. Ebmax was estimated by fitting simulated biomass to above-ground biomass measurements at flowering and maturity. Cgrain and CgrainV0 were obtained plotting observed values of Ngrain against simulated values of VTmean. P1grainMax was taken at the highest value observed in our experiment, and HImax and Vitircarb were calibrated fitting simulated to observed grain yields. Finally, the threshold Tcold of cold sensitivity during vegetative stages was calibrated by searching the values maximizing the number of matches between the model and observations regarding crop survival (or destruction by cold) in the set of growing situations established in our experiment.
Virtual experiment
The virtual experiment consisted in simulation scenarios including all the possible combinations for the following 5 factors: (1) climatic year (10 years tested), (2) elevation (6 in all, every 200 m from 0 to 1000 m); (3) crop (irrigated rice, aerobic rice, soybean, maize); (4) sowing date (every 10 days, from the 10th to the 90th day of the year), and (5) regional climate (3 weather stations). In the case of irrigated rice, the planting technique (direct sowing and transplanting) was tested as an additional factor.
Three weather stations were considered, chosen for representing contrasted climates in terms of temperature and radiation during spring (Figure 1), and for the availability of daily data of solar radiation and minimum and maximum temperature for the period 1989–2002, as follows: Phu Ho (N 21°27′; E105°13′48″; 36 m), in the hilly region at the southern end of the northern mountainous area, with low solar radiation and relatively high temperature in spring as compared to the other two weather stations; Mu Cang Chai (N 21°04′59″; E 104°49′59″; 975 m) at the heart of the mountainous area, with high radiation and relatively low temperature in spring, mostly due to its high elevation as compared to the other weather stations, and Van Chan (N 21°36′; E 104°31′; 257 m) in an intermediary position geographically and in terms of solar radiation in spring, temperature being close to that of Mu Cang Chai despite its location at a lower altitude. In every small region surrounding these weather stations, a significant share of agricultural land is irrigated in valley floors at an altitude similar to that of the weather station (Phu Ho and Van Chan, both located at the bottom of the main local toposequence) or much lower than that of the weather station (Mu Cang Chai, located at the top of the local toposequence). The other share of the irrigable land is located on terraces of a wide range of altitudes, approximately 20–500 m; 200–1000 m; and 300–1000 m for Phu Ho, Van Chan and Mu Cang Chai, respectively. This is why an elevation factor had to be included in the virtual experiment. The elevation factor was accounted for solely through its impact on air temperature as calculated using the equation from Baker (Reference Baker1944):
 \begin{equation}
{\rm Tz} = {\rm T}0 - 0.6({\rm z} - {\rm z}0)/100,\end{equation}
where Tz is the temperature in °C of a given height z (m) asl and T0 is the temperature in °C at a given location characterized by an elevation z0.
Hence from the data series of each weather station representing a regional climate, we built data series corresponding to each elevation from 0 to 1000 m with a 200 m increment, by using the solar radiation data of the weather station and the temperature data of the weather station corrected using equation (7).
The simulations provided grain yield (being zero in the event of lethally low temperatures) and total crop cycle duration for each combination of factors. The results were analysed per location and crop in two main steps. First were assessed separately, the criteria of yield reduction due to low solar radiation and temperature, crop mortality due to excessively low temperature and increase in crop duration due to low temperature and incompatible with latest date for summer crop installation. This was done by calculating, per sowing date, crop and elevation, the probability that a year within the set of years in the weather station data set for the location:
-
• simulated crop maturity is reached before 5 July (P1),
-
• simulated crop is not destroyed by excessive cold (P2),
-
• simulated yield exceeds 0.7× Ymax, where Ymax is the highest simulated yield of the crop at the location and elevation considered, over years and sowing dates (P3).
Second, was calculated for each crop, location and elevation a single indicator of temperature and radiation constraining spring crop. This indicator was the length in days of a favourable window for sowing a spring crop (FWS), defined as the simulated sowing period for which P1, P2, and P3 were all over 0.8.
Sensitivity analysis
To assess the robustness of our estimates of the size of the sowing windows defined as above, a simple sensitivity analysis was carried out. The influence on the size of the sowing window of the main parameters of PYE was tested ‘one parameter at a time’. In order to avoid any underestimation of the role of the parameters, this sensitivity analysis was performed for the most constraining combination of crop and climate as detected from the virtual experiment. The model parameters whose influence was evaluated were all the cultivar specific calibrated parameters, namely the sum over the crop cycle of the phenological TC governing the overall cycle duration in days ( = ΣTC), Tdmin and Tcold, Ebmax, dLAImax, Cgrain and HImax. The range of values tested varied from −20 to + 20% around the calibrated value used in the model, using a 10% step.
RESULTS
Growth conditions established in the experiment
In some of the experimental plots, events such as water shortage in the irrigation system, shortage of fertilizers or labour force for weeding at the experimental site occurred. These circumstances prevented to maintain the plot free of any nutrient, water or biotic stress. The final set of valid growing situations, i.e. those where we could assume that crop growth was not limited by water, nutrients or pests or disease throughout the cycle consisted of eight situations for rice; four for aerobic rice; three for maize and three for soybean. However, potential growth conditions were maintained during vegetative stages in more situations, which were used for calibration of crop survival across low temperature during this period (15 situations for irrigated rice, and 12 for each of the 3 other crops).
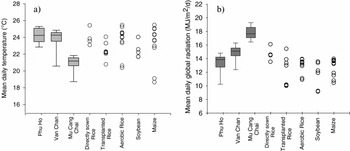
The experimental design set up effectively provided growing conditions exposed to varied radiation and temperature conditions representative of the springtime climate conditions in the northern highlands of Vietnam. Across the valid growing situations established in the two year experiment, the temperature averaged over the duration of crop cycle varied similarly to the 10-years inter-annual distribution of temperature averaged over the spring season (Figure 2a). More specifically, the temperature averaged over the crop cycle was in our experiment between 18.6 °C and 25.5 °C, while 75% of spring-averaged temperature ranged between 23.7 and 24.9 °C at Phu Ho, 23.7 and 24.4 °C at Van Chan and 20.8 and 21.5 °C at Mu Cang Chai during the 1989–2002 period.
Mean daily temperature (a) and global radiation (b) during spring season observed for the 4 crops studied in the experiment (dots) as compared to the climate of the northern mountains of Vietnam (whisker boxes). Whisker boxes: inter-annual distribution of data averaged over historical series from weather stations at Phu Ho (14 years), Mu Cang Chai (14 years) and Van Chan (12 years), from February, 1 to June, 30. Dots: data averaged over the period from sowing to maturity for each growing condition established in the 2-years experiment.

The values of daily solar radiation averaged over the cycle in our experiment ranged over an interval (9.1 –16.1 MJ m−2 day−1) comparable to the variation interval over years of spring-averaged radiation in the region (10.3–19.2 MJ m−2 day−1). However, most of the growing situation established in our experiment were below 14.7 MJ m−2 day−1, and thus reflect radiation conditions that are among the lower half of those observed in the mountainous region of Vietnam (Figure 2b).
Model calibration
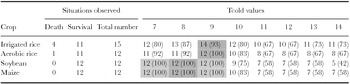
Table 2 shows the influence of the parameter Tcold on the proportion of actual growing situations for which the model adequately simulated the survival or death of the crops. This proportion was at best 93% for rice and 100% for aerobic rice, maize and soybean, within intervals of Tcold values. Whatever the crop, Tcold greater than 9 °C provoked a marked decrease in the quality of prediction, in fact due to an increase in the number of cases where the model predicted the death of the crop when it actually survived. Simulations with lower values of Tcold resulted in a less marked (rice and aerobic rice) or no decrease (soybean and maize) in the proportion of situations well predicted by the model. When lowering Tcold below its optimal value, the model tends to predict more cases of crop survival than in the real world. Nevertheless, destruction of the crop by cold did not occur in our experiment for maize and soybean, and it occurred much less frequently than survival for aerobic and irrigated rice. We thus lacked sufficiently cold conditions, in our experiment, to reduce the uncertainty on the lower end of the interval of the possible values of Tcold. As shown in Table 2, estimates of Tcold available in the literature were within the interval of best match between PYE simulations and our experimental data, and equal to or very close to its upper end. We thus chose to set Tcold at the values from the literature for all the other simulations used for model calibration and virtual experiment, and to use the sensitivity analysis as a way to check the dependency of our results to uncertainties in Tcold determination.
Calibration of crop survival sensitivity to low temperatures. Observed numbers of survival and destruction due to low temperatures among the growing situations established in the experiments (situations observed), and number of simulations matching the observed survival or destruction as depending on the value at which Tcold parameter was set in the model (Tcold values). Values within brackets are the percentages of simulations matching observations per crop and per Tcold value. Cells in grey indicate the highest percentage of simulations matching observations. Cells in darker grey highlight Tcold values found in the literature (see Table 1).

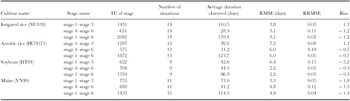
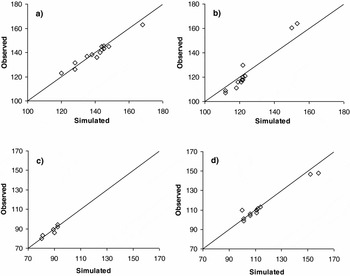
The calibrated TC of all the crops studied are given in Table 3 for the main phenological stages considered in the model. Using these calibrated values of TC, PYE correctly simulated the spring crop cycle length, the time from emergence to flowering, and the time from flowering to maturity (Table 3, Figure 3). The relative RMSE (RMSE divided by mean of observed values) associated with the cycle length simulation were satisfactorily low, from 2% (irrigated rice) to 5% (aerobic rice). The bias was also quite low. Despite a slight tendency towards underestimation of total cycle duration, the bias remained mostly below 1.5 days whatever the crop. Thus calibrated, the model proved suitable for an accurate estimation of crop cycle duration during spring in the northern mountains of Vietnam for the studied cultivars of maize, rice and soybean.
Calibrated thermal constants (TC, in degree days) for the main stages of the 4 crops studied. Stage 1: emergence, stage 3: end of rapid LAI growth, stage 4: start of grain filling, stage 6: maturity. RMSE = root mean squared error, RRMSE = relative root mean squared error.

Observed and simulated cycle length (in days) for (a) rice (b) aerobic rice, (c) soybean and (d) maize. Solid lines are the 1:1 lines.

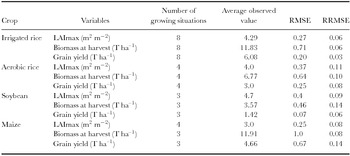
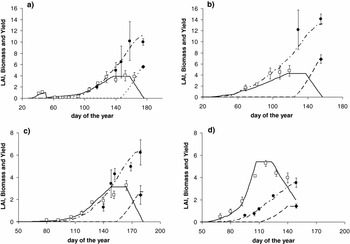
The calibrated values of the other parameters of PYE are given in Table 1. Figure 4 exhibits the intermediary comparisons between simulated and observed growth dynamics after calibration for a selection of contrasted growing situations taken from the research station site where growth was monitored more intensively than in the farmers’ field site. The calibrated model simulated remarkably well the strong differences between crops, and in the case of rice, between its transplanted and directly sown options, in terms of LAI and above-ground biomass dynamics throughout the development cycle. Table 4 presents the final calibration results obtained for the different spring crops studied and the following variables, using all the valid growing situations of the two sites: LAI at flowering, above-ground biomass and grain yield at harvest. The calibrated model was found particularly accurate for estimating rice yield (RRMSE = 3%). The highest value of RRMSE for yield was the one obtained for maize, 14%, which remains acceptable. Yield of soybean and aerobic rice were estimated with a RRMSE of 6 and 8%, respectively. The model was therefore found suitable for estimating potential yield of the studied cultivars of maize, soybean and irrigated and aerobic rice under temperature and radiation regimes of the mountainous area of Vietnam.
Model accuracy after calibration for maximum LAI, average biomass at harvest and average grain yield for the 4 studied crops. RMSE = root mean squared error, RRMSE = relative root mean squared error.

Observed (□) and simulated LAI (—); observed (●) and simulated biomass (−· −); observed (♦) and simulated grain yield (- - - - -) of growing situations for (a) transplanted rice in 2011, (b) directly sown irrigated rice in 2010, (c) late sowing from 19–22 February 2011 for aerobic rice, (d) late sowing from 19–22 February 2011 for soybean. Mean ± standard error.

Virtual experiment
Risk of excessive crop cycle duration
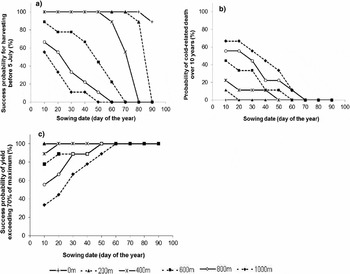
Figure 5a illustrates the influence of sowing date and elevation on P1, i.e. the simulated probability that crop maturity occurs before 5th of July for the case of maize at Phu Ho. In that particular case, at the tested elevations greater than 600 m, even with the earliest considered sowing date, there was a significant risk (passing 2 years over 10, or P1 < 0.8) that simulated maturity occurs later than 5th of July, hampering the setting of the main crop, summer rice. The elevation threshold above which P1 < 0.8 for the earliest sowing date varied with location and crop. It was between 600 and 800 m for direct seeded rice at Van Chan and maize at Phu Ho, and exceeded 1000 m for soybean at Mu Cang Chai (data not shown). Above such elevation threshold, FWS (the length of the favourable window for sowing a spring crop) was zero due to excessive crop duration. Below this elevation threshold, there was an interval of sowing dates for which P1 > 0.8. The size of this interval increased as elevation decreased.
Simulated effect of sowing date and elevation at Phu Ho on (a) the probability P1 of reaching maturity before 5th July for maize, (b) the probability (1-P2) of lethally cold events for transplanted rice, and (c) the probability P3 of achieving yield over 70% of maximum yield in growing situations for maize.

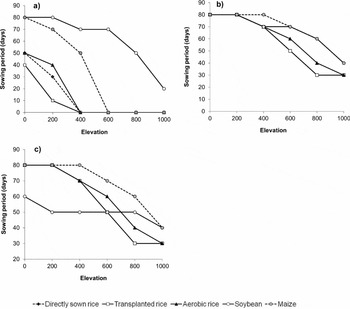
Figure 6a presents the size of this interval of sowing date favourable to spring crop on the criteria of its compatibility with the setting of summer rice, as depending on crop and elevation at Phu Ho, the coldest location among those studied when temperatures are corrected to sea level. The crops could be classified in decreasing order of risk that spring cycle conflicts with the right timing of the summer crop as follows: rice (transplanted more risky on that criteria than direct seeded), aerobic rice, maize and soybean. This classification is maintained in the three locations studied (data not shown). The most constraining location on that criterion was found to be Phu Ho, followed by Van Chan and Mu Cang Chai.
Length in days of the interval of sowing dates matching the criterion of (a) the probability P1 for spring crop to reach maturity before 5th July > 80%, (b) the probability P2 > 80% and (c) the probability P3 of achieving yield over 70% of maximum yield in the growing situations > 80%, as depending on elevation. Case of Phu Ho.

Risk of crop failure due to cold temperature periods
As expected, the virtual experiment showed that the risk of crop destruction by periods of excessively cold temperature increased with elevation and decreased as sowing date takes place later in the year, at a given location and for a given crop. Figure 5b provides an example of the effect of sowing date and elevation on the probability that the crop is not destroyed by low temperatures (P2), in the case of irrigated rice, the crop with the longest crop cycle and the highest sensitivity to cold events, at Phu Ho. For each location, crop and elevation, there was an interval of sowing dates for which P2 is greater than 80%.
Figure 6b presents the size of this interval as depending on crop and elevation at Phu Ho. Rice appeared to be the most risky considering this probability, without difference between direct seeded and transplanted rice, aerobic rice being slightly less risky. Maize and soybean appeared equally less risky than rice. The most risky location was, as for the criteria of P1, Phu Ho, followed by Van Chan and Mu Cang Chai (data not shown).
Risk of low yield due to low radiation and temperature
Figure 5c provides an example of the effect of sowing date and elevation on the probability (P3) that yield is greater than 70% of the maximum yield simulated over all tested sowing dates. In the case of this criteria, the risk of low yield increases with elevation and from late to early sowing dates. For each crop, location and elevation, an interval of sowing dates for which P3 was higher than 80% was obtained in the simulations.
Figure 6c presents the size of this interval as depending on crop and elevation at Phu Ho. In Van Chan and Mu Cang Chai, whatever the crop, the risk of low yield had very little influence on the duration of the favourable sowing period except for very high elevation of above 800 m (data not shown). Under the climate of Phu Ho, whatever the elevation the risk of reduced yield was the lowest for soybean, followed by maize and then rice.
Length of the favourable window for sowing a spring crop
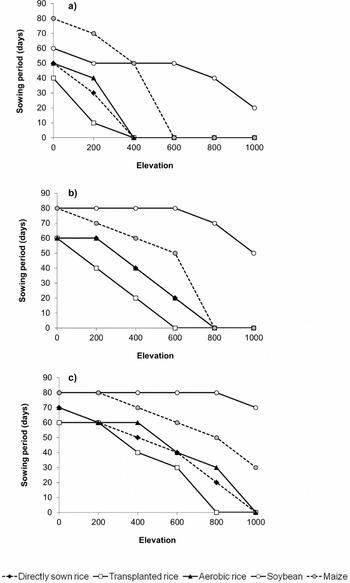
The preceding results confirmed that a sowing period favourable to spring crop (FWS) should combine the criteria of a date of crop maturity compatible with the proper timing of summer rice, of avoiding crop failure due to cold temperature, and of achieving a relatively high yield. The simulated probabilities of satisfying the first two criteria in a given year, P1 and P2, respectively, decreased with increasing sowing date, whereas the simulated probability of satisfying the third criteria, P3, increases with increasing sowing date. FWS, (defined in the section 2.5) is shown in Figure 7 per location, elevation and crop. FWS decreased with increasing elevation. Under the climate of Phu Ho (Figure 7a), FWS reaches zero at elevations above 400 and 600 m for rice and maize, respectively, while the climates of Van Chan (Figure 7b) and Mu Cang Chai (Figure 7c) are less constraining for spring crops, with FWS of maize reaching zero above 800 and 1000 m, respectively, and FWS of directly sown or aerobic rice reaching zero at 800 and 1000 m, respectively.
Length of favourable window for sowing (sowing period during which P1, P2 and P3 are over 80%, in days) related to elevation at (a) Phu Ho; (b) Van Chan; and (c) Mu Cang Chai.

For each of the three locations, soybean was the crop with the longest sowing period with reasonable risks relative to the three criteria, even at an elevation of 1000 m. At such high elevation, FWS of soybean was 20 days, 50 days and 70 days at Phu Ho, Van Chan and Mu Cang Chai, respectively. At an elevation of 600 m, where arable and irrigable land is commonly found in the mountains of Vietnam, FWS of soybean was 80 days at Van Chan and Mu Cang Chai, and 50 days at Phu Ho. Growing maize as a spring crop was found more constraining since at the same elevation of 600 m, FWS of maize was 0, 50 and 60 days at Phu Ho, Van Chan and Mu Cang Chai, respectively. Rice was even more constraining, especially if transplanted, with FWS of transplanted rice at a given elevation and location being 20–60 days lower than that of maize. At most locations and elevations, FWS of direct seeded and aerobic rice (also direct seeded) could not be distinguished, and otherwise showed little difference. The FWS of these two crops were 10–30 days greater than that of transplanted rice in most locations and elevations.
Sensitivity analysis
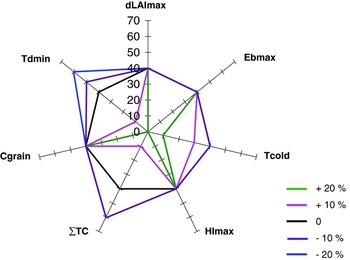
The most constraining combination of crop and climate, as detected in the preceding section, was irrigated rice under the climate of Phu Ho. The sensitivity analysis was thus applied to this scenario. However, the temperature data were corrected using equation (7) for an elevation of 400 m, in order to account for the fact that most of the irrigated area of the region studied lies at around this elevation and hence is exposed to a cooler climate than monitored at the elevation of the weather station. Under this scenario and with the calibrated values of all the parameters, FWS was 40 days. Figure 8 presents the results of the sensitivity analysis on FWS of changes of ±20% in parameters values around the calibrated values. FWS was not sensitive to parameters governing yield (dLAImax, Ebmax, Cgrain, HImax). The absence of influence of Cgrain on FWS denotes the fact that at reproductive stages in our studied case, temperatures are not low enough to constrain the crop. Temperature have generally sufficiently increased, as compared to those of the beginning of the spring season, to be of little influence on growth rate and furthermore on grain number formation. Oppositely, FWS was mainly affected by variations in the parameters governing cycle duration, namely Tdmin and ΣTC and crop destruction by low temperatures (Tcold). FWS was particularly sensitive to the thermal time constant summed over the crop cycle, of which a 10% increase provoked a reduction of FWS down to 10 days, and a 10% decrease resulted in FWS increasing up to 60 days. A further 10% decrease in the thermal time constant did not result in an extra increase of FWS, due to a high number of days with temperature lower than Tdmin. FWS was also strongly sensitive to this latter parameter Tdmin, of which a 10% increase resulted in FWS decreasing from 40 to 10 days, and a 20% decrease resulted in FWS increasing in a lesser proportion, from 40 to 60 days. Last, it is noteworthy that a decrease of Tcold of 10 or 20% did not affect FWS. This was due to the fact that days with temperature below the calibrated value of Tcold are predominantly more than 20% cooler than this value. As a consequence, even if this parameter was overestimated by 20%, this would have no impact on FWS estimates. An increase of 10 and 20% led to a decrease of FWS from 40 to 30 and 10 days, respectively, but the comparisons between simulated and experimental crop survival data shown in section 3.2 indicated that Tcold values retained in model parameterization were not likely to be underestimated.
Length of favourable window for sowing as depending on variations around calibrated values of the main parameters of the model, in the case of irrigated rice under the climate of Phu Ho corrected for an elevation of 400 m.

DISCUSSION
The PYE model was calibrated using experimental data over two years at two locations and at different elevations, considering different sowing dates and planting techniques for irrigated rice, taking into account the diversity of temperature and radiations conditions found in the northern highlands of Vietnam during spring. Although the experiments were set up under controlled conditions aiming at avoiding any water, nutrient or biotic stress, some plots failed to satisfy to these criteria, due to logistical constraints in the mountainous region of our study. Lobell et al. (Reference Lobell, Cassman and Field2009) mentioned this issue as common in studies of this kind in their review of methods for estimating yield gaps and potential yields.
Model calibration enabled us to obtain satisfactory simulations in terms of simulated crop duration, LAI, above-ground biomass and grain yield, when assessed against our experimental data. Ebmax values obtained in our study for maize and irrigated rice (3.8 and 3.3 g MJ−1, respectively) were in agreement with values found by other authors using similar models (around 3.8 and 3.2 g MJ−1 for maize and irrigated rice, respectively; Brisson et al., Reference Brisson, Gary, Justes, Roche, Mary, Ripoche, Zimmer, Sierra, Bertuzzi, Burger, Bussiere, Cabidoche, Cellier, Debaeke, Gaudillere, Henault, Maraux, Seguin and Sinoquet2003; Confalonieri et al., Reference Confalonieri, Acutis, Bellocchi and Donatelli2009; Horie and Sakuratani, Reference Horie and Sakuratani1985; Idinoba et al., Reference Idinoba, Idinoba and Gbadegesin2002). Yet, the calibrated value obtained for soybean was low compared to the value obtained by Brisson et al. (Reference Brisson, Bona and Bouniols1989), 1.8 vs. 2.5 g MJ−1 respectively, but in the same order of magnitude than the results obtained by Singer et al. (Reference Singer, Meek, Sauer, Prueger and Hatfield2010). This suggests that despite our efforts, the growing conditions established in our experimental plots for soybean were not perfectly free of water, nutrient or biotic stress. With our calibrated parameters, PYE may thus underestimate the potential yield of soybean. This does not affect the reliability of our assessment of the favourable sowing dates for spring soybean since we used the yield relative to the maximum simulated yield at a given location and elevation, and not the yield itself as an indicator of the radiation-related constraint. In the case of aerobic rice, the calibrated value was 2.6 g MJ−1, consistent with those from Bouman et al. (Reference Bouman, Yang, Wang, Wang, Zhao and Chen2006), ranging 2.09–2.53 under flooded conditions. Moreover, the sensitivity analysis showed that possible remaining errors on the estimates of parameters governing the simulation of LAI, biomass and grain yield would have little consequences on the estimates of FWS.
FWS proved more dependent to the parameters of crop duration, but our experimental device with crops exposed to particularly contrasted temperature, and the use of the classical thermal time approach in PYE made our simulations of crop duration particularly reliable for the cultivars used in our study. However, thermal time constants will have to be determined for any other cultivar to which our simulation approach would be applied. Water running in irrigated fields in the highlands of Vietnam may be of a slightly different temperature than air measured in weather stations in some particular places, and this is expected to change crop duration and affect yield (Shimono et al., Reference Shimono, Hasegawa and Iwama2002) in a way that was not accounted for in our simulations.
The parameters relative to the cold-related destruction of the crop were set at values found in the literature. However, some authors suggest that the sensitivity of crops to irremediable damages from low temperature is cultivar dependent and there are discrepancies between the values proposed by Lou et al. (Reference Lou, Chen, Sun, Xing, Li, Xu, Mei and Luo2007). The sensitivity analysis showed that an underestimation of the sensitivity to low temperature of the studied cultivars (i.e our estimate of Tcold too low) would have led to overestimate the size of the favourable sowing windows, and hence to underestimate the risks associated with spring crops in the region studied. However, these risks were certainly not strongly underestimated in our study, since the model calibration section showed that Tcold is much more likely to be too high than too low in our parameterization. The sensitivity analysis also showed that an overestimation of the sensitivity to low temperature of the studied cultivars (i.e. our estimate of Tcold too high) has little impact on FWS estimates. However, we cannot discard completely the possibility that our model and its parameterization led to underestimating FWS. Refining this aspect of the model and of the related criteria in the virtual experiment would require a specific experiment in which crops would be exposed for various durations to a range of temperatures below the range covered during our calibration experiment.
Overall, and despite uncertainties on model's outputs as discussed above, the virtual experiment and the sensitivity analysis showed clearly that low temperature and radiation do constrain the feasibility of a spring crop in some environments of the mountains of Vietnam. The most constraining issue, whatever the crop and location among those we tested, was shown to be the risk that low temperatures delay the completion of the crop's cycle so that the setting of the subsequent summer rice cannot be carried out at a proper time. We assumed a date after which the setting of the summer rice was not acceptable. This approach proved effective for showing the variability of the constraint of crop duration across crops, locations and elevations, and thus for identifying the most favourable and unfavourable environments for introducing a spring crop. However, in intermediary situations, a more in depth analysis of the economic soundness of introducing a spring crop would be useful. It would require that the total yield (and economic return) obtained over the year with the sequence of two crops, accounting for possible delays in sowing or transplanting the summer rice, is compared to the yield and economic return of the sole summer cycle set at its optimal date. This would be possible by applying our virtual experiment approach to the sequence of the two crops instead of the sole spring crop.
The risk of crop destruction due to periods of consecutive days with lethally low temperature and the negative impact on yield of low solar radiation and low temperature are not as constraining as the increase in crop duration, but they cannot be neglected in some environments, especially for rice and maize. Our approach of combining criteria in the definition of a favourable window for sowing was well adapted to the objective of identifying the diverse influences of solar radiation and temperature on the feasibility of introducing a spring crop. This approach is similar to that of a ‘window of opportunity’ for sowing proposed by Kouressy et al. (Reference Kouressy, Dingkuhn, Vaksmann and Heinemann2008) in their virtual experiment for evaluating the adaptation of sorghum cultivars to contrasted environments.
As shown by the calibration results and the sensitivity analysis, possible bias in the analysis as resulting from errors in the model and in the way FWS was defined might lead to underestimating the impact of the climatic constraint on the feasibility of the spring crop in the studied region. Hence, scenarios detected, in our virtual experiment, as strongly constrained by climate, are very likely to be so in the real world, and as such are not advisable to farmers. Most differences in the sensitivity to climatic constraint of the scenarios tested came from differences in crop cycle duration. As this was particularly well simulated by our model, the classification of crops and location, in terms of feasibility of a spring crop, is also particularly robust. More caution should be taken before encouraging farmers to practice scenarios identified as favourable, since there is a risk that we underestimated the influence of the climatic constraint.
Nevertheless, other factors not accounted for in this study may reduce or enhance the feasibility of spring crops. First, water availability in the earliest part of the season may be low in some areas and this can further reduce the window of opportunity for sowing a spring crop. In order to assess the spatial and temporal distribution of this constraint, the approach used in the present study would deserve to be repeated using a water balance model coupled to PYE. Second, the use of a plastic tunnel greenhouse during nursery period of transplanted rice may reduce the risk of crop destruction and allow earlier transplanting (Sipaseuth et al., Reference Sipaseuth, Fukai, Farrell, Senthonghae, Sengkeo, Linquist and Chanphengsay2007). The extent to which this increases the duration of the favourable period for sowing would also deserve to be studied, especially in areas where the irrigation system is not of sufficient quality to allow direct seeding of rice. Third, the cold temperature at the beginning of the crop cycle is likely to result in a relatively low growth during initial stages of the crop, a situation particularly favourable to weeds. This suggests that spring crops are likely to require particular efforts for controlling weeds, as compared to the main crop cycle. Fourth, in the mountainous environment of this study, variations in solar radiation may arise from variations in the aspect and angle of the slope, and from shading effects from the relief. However, this does not concern the predominant case of rice fields located in relatively large valley floors of varying elevation, but only terraced fields along slopes and fields in the floor of very narrow valleys. Furthermore, as mentioned above, and despite its relatively high variations between weather stations and across sowing dates, solar radiation played a relatively minor role in the variations of FWS as compared to temperature. However, in the cases of slopes facing north and/or narrow valleys, possible spots of particularly low solar radiation may occur and prevent farmer to practice a spring crop even in places predicted to be favourable by our analysis.
CONCLUSION
Our updated version of the model PYE proved suitable for evaluating the impact of temperature and solar radiation on crop duration, LAI, above-ground biomass and yield of maize, rice (under transplanting and direct seeding management) and soybean under conditions free from water, nutrients and biotic stresses. The principles of our experimental device were adapted to the calibration of such model. Yet, maintaining growing conditions corresponding to those of the potential yield remains challenging and was not fully achieved, in our study, in the specific case of soybean.
We defined a virtual experiment and a favourable window for sowing based on the several ways temperature and radiation affect yield. This approach proved effective to identify favourable and unfavourable environments for introducing a spring cycle in the mountains of Vietnam, in order to help better targeting the policy in support to the introduction of a spring crop.
The study showed that using the currently recommended cultivars, growing rice and maize during spring may be clearly risky under some environments, mostly due to increase in crop duration that hampers the proper timing of the main summer rice, but also due to crop destruction by severely cold temperatures at the beginning of the season. Soybean appeared to be less risky as an option in non-water limited environments.
Options to refine the approach are to better calibrate the parameters related to the sensitivity of crops to severely low temperature, and to account for possible changes in the sowing date of the summer rice and their impact on the economic return of the spring-summer crop sequence compared to that of a sole summer crop. Water stress related constraint and the effects of plastic tunnel greenhouses on the window of opportunity for sowing should also be studied in future research in order to be included in the model.
Acknowledgements
We wish to thank Dr Benjamin Sultan, Prof. Jacques Caneil and Prof. Jacques Wery for their critical reading of an earlier version of the manuscript. Dr Le Quoc Doanh and Dr Pham Thi Sen (NOMAFSI, Vietnam) provided key support to the operational and institutional aspects of the work. We are grateful to Julie Iglesia, Nguyen Van Nien, Nguyen Thi Huong, Nguyen Phuc Chung and Nguyen Van Giang for their invaluable contribution to field and lab work. Dang Dinh Quang (NOMAFSI) deserves a special word of thanks for unlocking many doors to the Vietnamese Mountains for Damien Jourdain and François Affholder. We owe particular thanks to the people's committee and farmers of Suoi Giang Commune, Yen Bai province, Vietnam, who warmly received us and greatly facilitated the building and operating of our device in farmer's fields. We wish to thank also Cécile Fovet-Rabot for her linguistic help. The scientific equipment used was acquired with financial support from IRRI and CIRAD.