INTRODUCTION
Natural ecosystems, including managed grasslands, provide services and goods that are essential for humans (Matson et al. Reference Matson, Parton, Power and Swift1997). Until recently, grassland ecosystems were mainly regarded as supplying food for domestic herbivores (Hopkins & Wilkins Reference Hopkins and Wilkins2006). Today, the contribution of grasslands to other services is well established. They provide environmental protection, e.g. limitation of water and atmospheric pollution, greenhouse gas balance, prevention of soil erosion, and potential sequestration of carbon (Parris Reference Parris, Durand, Emile, Huyghe and Lemaire2002; Hopkins & Holz Reference Hopkins and Holz2006; Allard et al. Reference Allard, Soussana, Falcimagne, Berbigier, Bonnefond, Ceschia, D'hour, Henault, Laville, Martin and Pinares-Patino2007) and also ecological management, e.g. contribution to biodiversity preservation or trophic cascades. Predicting the extent to which grassland ecosystems deliver these services is a threefold economic, technical and scientific stake (Eitzinger et al. Reference Eitzinger, Orlandini, Stefanski and Naylor2010). Among the predictors that have been used, grassland vegetation characteristics appear to be the most relevant, as demonstrated by several authors for various services (Duru et al. Reference Duru, Cruz and Theau2010a; Polley et al. Reference Polley, Morgan and Fay2011).
The links between vegetation characteristics and ecosystem services were shown clearly in a recent review (De Bello et al. Reference De Bello, Lavorel, Diaz, Harrington, Cornelissen, Bardgett, Berg, Cipriotti, Feld, Hering, Da Silva, Potts, Sandin, Sousa, Storkey, Wardle and Harrison2010). It was suggested that plant trait clusters can be used to monitor and balance the delivery of multiple services in ecosystem management. Relationships between forage production (quantity and quality) and plant life traits including leaf dry matter content (LDMC), specific leaf area (SLA), leaf life span (LLS) and plant phenology have been shown clearly (Duru et al. Reference Duru, Cruz, Al Haj Khaled, Ducourtieux and Theau2008; Andueza et al. Reference Andueza, Cruz, Farruggia, Baumont, Picard and Michalet-Doreau2010). Links between functional characteristics of vegetation and ecosystem services have also been suggested. The relationship between carbon sequestration and the relative proportion of legumes and grasses (Soussana & Luscher Reference Soussana and Luscher2007) or between pollination services and the proportion of entomophilous species (Batary et al. Reference Batary, Baldi, Sarospataki, Kohler, Verhulst, Knop, Herzog and Kleijn2010) has been explored. The botanical (genetic or species) composition of grasslands, such as species dominance (SD) or floristic composition (FC), also determines services such as the conservation of patrimonial (related to site history; Delpech Reference Delpech2005) or ordinary diversities (Peter-Schmid et al. Reference Peter-Schmid, Kolliker and Boller2008). Ecosystem services can also be determined by both functional and botanical composition of grasslands. For instance, Guillot-Fleury (Reference Guillot-Fleury1995) and Lindemann-Matthies et al. (Reference Lindemann-Matthies, Junge and Matthies2010) found that the provision of high-quality landscapes was due not only to the nature of species but also to functional features (height and structure of vegetation, dominating colours, date and duration of flowering and distribution of traits within the plant community). These examples illustrate that the prediction of a broad range of ecosystem services requires both the botanical and functional dimensions of the vegetation characteristics to be taken into account. Finally, vegetation characteristics cannot predict all ecosystem services, as some accrue simply from soil cover by sward (e.g. limitation of erosion or effluent leaching; Reid et al. Reference Reid, Mooney, Cropper, Capistrano, Carpenter, Chopra, Dasgupta, Dietz, Duraiappah, Hassan, Kasperson, Leemans, May, Mcmichael, Pingali, Samper, Scholes, Watson, Zakri, Shidong, Ash, Benett, Kumar, Lee, Raudsepp-Hearne, Simons, Thoell and Zurek2005; Burel et al. Reference Burel, Garnier, Amiaud, Aulagnier, Butet, Chauvel, Carre, Cortet, Couvet, Joly, Lescourret, Plantureux, Sarthou, Steinberg, Tichit, Vaissiere, Van Tuinen, Villenave, Le Roux, Barbault, Baudry, Burel, Doussan, Garnier, Herzog, Lavorel, Lifran, Roger-Estrade, Sarthou and Trommetter2009).
The delivery of multiple services from grassland ecosystems raises the question of the influence of environmental factors on vegetation characteristics. Phytosociologists have looked closely at this question in the past, focusing on the species composition of grasslands. It is now clearly established that edaphic and climatic factors have an influence on vegetation characteristics, determining the presence and abundance of species and distribution of their life traits (Diaz et al. Reference Diaz, Marcelo and Casanoves1998; Duru et al. Reference Duru, Cruz, Theau, Jouany, Ansquer, Al Haj Khaled and Therond2007; Pakeman et al. Reference Pakeman, Leps, Kleyer, Lavorel and Garnier2009; Cruz et al. Reference Cruz, Quadros, Theau, Frizzo, Jouany, Duru and Carvalho2010). Grassland management also affects the presence and dominance of plant species (Kohoutek et al. Reference Kohoutek, Pozdisek, Sramek, Odstrcilova, Nerusil, Komarek, Gaisler, Fiala, Micova, Svozilova, Lillak, Viiralt, Linke and Geherman2005; Klimas & Balezentiene Reference Klimas and Balezentiene2008; Brum et al. Reference Brum, Lopez, Garcia, Andres and Calleja2009), as well as plant functioning, i.e. plant traits (Lavorel & Garnier Reference Lavorel and Garnier2002). In this context, interactions between management, edaphic and climatic factors must be considered (Dibb et al. Reference Dibb, Fixen and Murphy1990; Pakeman et al. Reference Pakeman, Leps, Kleyer, Lavorel and Garnier2009), i.e. between (i) soil and management, (ii) management and climate, (iii) climate and soil and (iv) management practices themselves.
The aim of the present study is to examine links between botanical and functional characteristics of vegetation, environmental factors and ecosystem services. Only a few studies have thus simultaneously taken into account (i) the co-occurring effects of management, edaphic and climatic factors (Rudmann-Maure et al. Reference Rudmann-Maure, Weyand, Fischer and Stöcklin2008), (ii) more than one or two characteristics of the vegetation (Fonseca et al. Reference Fonseca, Overton, Collins and Westoby2000; Diaz et al. Reference Diaz, Lavorel, McIntyre, Falczuk, Casanoves, Milchunas, Skarpe, Rusch, Sternberg, Noy-Meir, Landsberg, Zhang, Clark and Campbell2007; Klimek et al. Reference Klimek, Kemmermann, Hofmann and Isselstein2007; Pavlu et al. Reference Pavlu, Hejcman, Pavlu and Gaisler2007; Kahmen & Poschold Reference Kahmen and Poschold2008) or (iii) a wide range of pedoclimatic conditions.
As vegetation characteristics were identified to be able to predict grassland services, two descriptors of botanical composition (presence of species and SD), and four traits of functional composition (LDMC, date of flowering, proportion of entomophilous species and number of oligotrophic species) were selected, which predict most of the services. It is hypothesized that along a large pedoclimatic gradient, most vegetation characteristics are determined mainly by climatic conditions, and there will be significant interactions between factors (Pakeman et al. Reference Pakeman, Leps, Kleyer, Lavorel and Garnier2009). A second step considers the factors driving each of the six vegetation characteristics. It is postulated that:
1. The presence and dominance of species would be influenced by pedoclimatic and management factors, with presence being more sensitive to soil (pH, humidity and fertility) and climate and dominance being more sensitive to management factors (Plantureux et al. Reference Plantureux, Bonischot and Guckert1993; Kopec et al. Reference Kopec, Zarzycki and Gondek2010).
2. LDMC would be driven mainly by soil fertility and grassland management (Ansquer et al. Reference Ansquer, Duru, Theau and Cruz2009).
3. The number of oligotrophic species would be determined by soil fertility and fertilizer application (Kapfer Reference Kapfer1988).
4. The proportion of entomophilous species (which depends on the ability of species to flower) would be linked mainly to management factors influencing the plant life cycle, such as grazing intensity, mineral fertilization (Potts et al. Reference Potts, Woodcock, Roberts, Tscheulin, Pilgrim, Brown and Tallowin2009; Batary et al. Reference Batary, Baldi, Sarospataki, Kohler, Verhulst, Knop, Herzog and Kleijn2010) and soil fertility.
5. The mean date of flowering of grassland, depending on botanical composition, would be driven by both climatic (temperature, precipitation, photoperiod and humidity) (Martini et al. Reference Martini, Biondi, Batista and Natal2010) and edaphic factors (Seghieri et al. Reference Seghieri, Vescovo, Padel, Soubie, Arjounin, Boulain, De Rosnay, Galle, Gosset, Mouctar, Peugeot and Timouk2009).
These hypotheses were tested on an original network of permanent grasslands distributed along a climatic and edaphic gradient in France. The novelty of the work is to allow predictions of some multi-services provided by permanent grassland through merging descriptive (i.e. botanic) and functional (i.e. plant traits) descriptors in response to abiotic or management factors.
MATERIALS AND METHODS
Sampling design
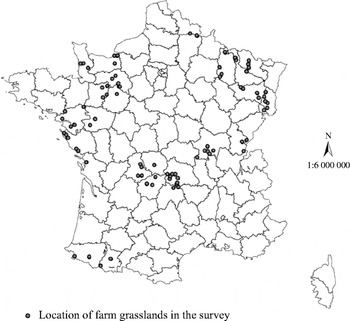
A set of 178 permanent grasslands in France were selected from among 1500 grasslands listed by a survey conducted in 2008 on 78 farms (Fig. 1), selected for their management and geographic location. The network included most pedoclimatic areas from Atlantic to Alpine conditions and covered most of the existing grassland types in France, resulting in a range of altitude from sea level to 2000 m asl. This pedoclimatic gradient was crossed with a management gradient, defined by a diversity of farm systems (dairy or meat cattle and sheep) and management practices (type and number of uses (grazing and cutting), type of animals and livestock density, type and amount of fertilization). All the grasslands of the survey had been native pastures for more than 10 years. They were subdivided into three categories: grazed only (0·44), cut only (0·13) and mixed grazed and cut (0·43). Those proportions are very close to the French national average proportions: in 1998, 0·56 of grasslands were grazed only, 0·08 cut only and 0·36 grazed and cut (Agreste 2000). Average time of first cut was mid June, with 0·74 of grassland used for hay, 0·18 for wrapped bale silage and 0·09 for other uses (direct cut silage and litter). Among cut grasslands, 0·33 were cut twice (0·91 of hay production) and 0·03 third (all of hay production). Average time of first grazing was mid May.
Location of farms where grasslands were studied.

Data collection
For each of the grasslands selected, data were collected on botanical composition, management, soil and climate. For each grassland, botanical composition was determined in spring 2009 in a homogeneous plant community (vegetation structure and FC) of c. 1 ha. The list of species was compiled from eight randomly located sampling areas (0·25 m2) and completed by an overview of the global plant community in order to note the presence of other species in the sampled area. In each 0·25 m2 sampling area, SD was determined by visual estimation of the relative volume of each species in the biomass (Benizri & Amiaud Reference Benizri and Amiaud2005).
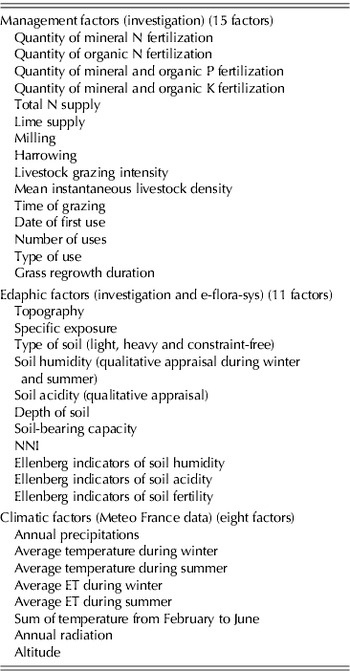
Management and edaphic characteristics of permanent grasslands were obtained mainly by interviewing farmers with a standard questionnaire in 2008. To characterize management practices, 15 factors were recorded. The mineral and organic nitrogen (N), phosphorus (P) and potassium (K) fertilizers applied (quantity and number of applications). For organic fertilization, amounts of manure or slurry were converted into N, P and K units by assigning standard conversion coefficients (Ziegler & Heduit Reference Ziegler and Heduit1991). The intensity of utilization including livestock grazing intensity, mean instantaneous livestock density, time and duration of grazing, type of use and date of use (Table 1). Livestock grazing intensity (days LU/ha/year) was calculated as the sum of products of duration of grazing and number of livestock units (LU) per unit area. Mean instantaneous livestock density was the average of livestock density for each grazing period, weighted by duration of visit on the grassland (LU/ha). Date of first use was characterized by the first grassland exploitation in the year, either mowing or grazing.
Management, edaphic and climatic factors available by survey, calculation (e-flora-sys software) and from Meteo France database

NNI was calculated using the proportion of N and DM yield (NNI=N×10/4·8 (DM)−0·32, with N in g/kg DM) (Lemaire & Salette Reference Lemaire and Salette1984).
The edaphic characteristics were described by 11 factors. These were compiled from farmer surveys (type of soil, depth of soil, load-bearing capacity of soil, specific exposure and topography) or from estimated indicators such as N nutrient index (NNI). NNI was calculated using the proportion of N and dry matter (DM) yield (NNI=N×10/4·8 (DM)−0·32, with N in g/kg DM) (Lemaire & Salette Reference Lemaire and Salette1984) or from the Ellenberg indicators. Ellenberg indicator values reflect the average realized niches of species along seven fundamental gradients (light, temperature, continentality, nutrients, soil moisture, pH, salinity; Ellenberg Reference Ellenberg1974). Ellenberg indicator values for soil humidity, acidity and fertility (Table 1), using the mean value of the species present (excluding species unaffected by the factor), were determined. Ellenberg values are good indicators of soil parameters. Schaffers & Sykora (Reference Schaffers and Sykora2000) found a close relationship between Ellenberg moisture values and soil moisture contents, but demonstrated a weaker relationship with the N indicator. In contrast, Duru et al. (Reference Duru, Ansquer, Jouany, Theau and Cruz2010b) found the opposite.
All the grasslands plots were located with Lambert II coordinates by Google Map® to assign them the closest meteorological station. Lambert II coordinates express location on a local projection system (France), with metric coordinates. The origin of axes is the principal meridian: Greenwich. A further check was done to ensure similarity between the studied grassland and the meteorological station (altitude and orientation). A climatic database was built on an average of 15 years of data (1992–2006, source: Meteo France). The grasslands were thus characterized by spatial location and information on altitude (m), annual radiation, temperature, rain and transpiration (eight factors) (Table 1). Average data were used: average temperature (T) during summer and winter, average evapotranspiration (ET) during summer and winter, annual precipitation and annual radiation. Summer and winter had significantly different temperature and ET. For temperature and ET, the winter season comprised 10-day periods 1–9 and 29–36 and summer season 10-day periods 10–28, corresponding to 1 April–7 October. The sum of temperature was calculated, for each 10-day period in spring, as the cumulative sum of positive (>0°C) daily temperature, from 1 February to the present day considered (Theau & Zerourou Reference Theau, Zerourou, Cruz, Jouany and Theau2008).
Data analysis
The botanical lists were entered into the e-flora-sys software (http://eflorasys.inpl-nancy.fr, Plantureux et al. Reference Plantureux, Ney, Amiaud, Schnyder, Isselstein, Taube, Auerswald, Schellberg, Wachendorf, Herrmann, Gierus, Wrage and Hopkins2010). From the botanical composition of each grassland, the e-flora-sys software calculated: Ellenberg ecological indicators, proportion of entomophilous species, number of oligotrophic species and mean plant life traits (LDMC or date of flowering). At the vegetation community level, the aggregated leaf trait corresponded to the average plant trait weighted by SD (Louault et al. Reference Louault, Pillar, Aufrere, Garnier and Soussana2005). Species values of traits used were those previously measured by the INRA Orphée team in Toulouse in standardized conditions (Cruz et al. unpublished).
Selection of environmental factors
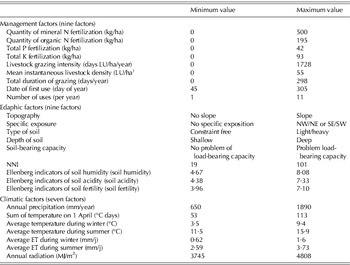
The list of 15 management, 11 edaphic and 8 climatic factors is presented in Table 1. The most relevant factors from this list were selected from the results of a principal component analysis (PCA, SPAD software package, version 7.0; Coheris, Suresnes, France). Management, edaphic and climatic groups of factors were tested separately. After the exclusion of dependent variables among the 34 factors, only 25 were selected: nine management factors, nine edaphic factors and seven climatic factors (Table 2).
Management, edaphic and climatic factors retained for the study of links between those factors and characteristics of vegetation

NNI was calculated using the proportion of N and DM yield (NNI=N×10/4·8 (DM)−0·32, with N in g/kg DM) (Lemaire & Salette Reference Lemaire and Salette1984).
Redundancy of vegetation characteristics
Vegetation of grassland was characterized by six vegetation characteristics: two related to botanical composition (SD and species presence (‘FC’)) and four describing the functional composition: number of oligotrophic species, proportion of entomophilous species, LDMC and date of flowering. For botanical composition, two grassland classifications were made to determine types of vegetation based on FC (presence/absence) and types of vegetation based on SD. These vegetation characteristics were obtained using the SPAD software package with multiple component analysis (MCA) followed by an ascendant hierarchical classification, and a tree cut with a characterization of classes. Functional composition characteristics were calculated by e-flora-sys software (Table 3). The six characteristics of vegetation were compared to exclude redundancy among them. To study the link between vegetation characteristics, three types of statistical treatments were performed with the SAS software package (version 9.2): (i) linear regression between functional characteristics using ‘proc reg procedure’, (ii) variance analysis between botanical characteristics (qualitative variable) and functional characteristics (quantitative variables) and (iii) a χ 2 test between types of SD and FC.
Number of data (n), mean, minimum, maximum, median and s.d. data for quantitative characteristics of vegetation

Estimation of the effect of environmental factors on vegetation characteristics
Selected management, edaphic and climatic factors were compared with selected vegetation characteristics. Qualitative vegetation characteristics were implemented in the CANOCO software package (Version 4.5; Ter Braak & Šmilauer Reference Ter Braak and Šmilauer2002). A canonical correspondence analysis (CCA) was used with the CANOCO software (Lepš & Šmilauer Reference Lepš and Šmilauer2003). Each group of factors was tested separately using a forward stepwise procedure with associated Monte Carlo permutation tests. These tests assessed the significance of the correlation between the predicted variable (qualitative characteristics of vegetation) and the predictors (management, edaphic and climatic factors). Secondary factors had a weak effect on vegetation characteristics. For quantitative data (functional composition), a stepwise regression was performed using the ‘proc glmselect’ procedure from the SAS software package version 9.2. Secondary factors were significant in the ANOVA results but were not selected by the stepwise procedure. Interactions between factors were tested and only significant interactions were conserved in the model.
RESULTS
Botanical composition and links between vegetation characteristics
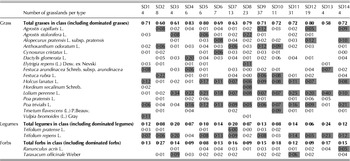
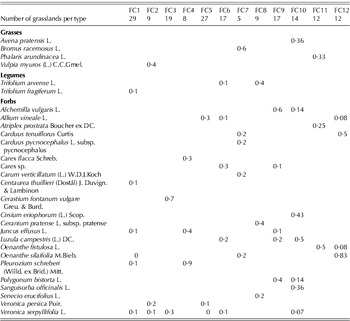
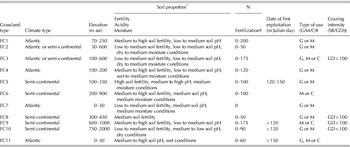
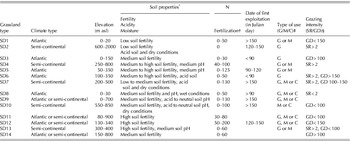
Classification of the botanical characteristics of vegetation results from two independent classifications of grasslands: the first is based on SD with 14 classes of SD (types SD1 to SD14, Table 4) and the second on species presence with 12 classes of FC (types FC1 to FC12, Table 5). The mean proportion in the biomass (dominance) of 20 species, mostly grasses, explains the discrimination between types of grasslands according to dominance classes (Table 4). The main pedoclimatic and management features of the types of grasslands (SD and FC classifications) are presented in Tables 6 and 7. The present paper cannot detail all these features, since its main purpose is not to demonstrate their effects on grassland botanical composition. However, as example, the grasslands classified as type SD8 (wet grasslands in oceanic conditions) differ from the other types because of the high dominance of Agrostis stolonifera and Elytrigia repens (Table 4). Table 5 shows the frequency of the 28 species and genus, each value indicating the proportion of grassland within a class where the species was found, that are the so-called ‘differential species’ among the 317 different species found in the entire sample set. These 28 species were generally found only in one or two classes of grassland, and rarely more. This indicates that the FC of each class is different from the others. Forbs represent the majority of the species (26 out of 29) presented in Table 5. For example, type FC 10 comprises mountain grasslands and is characterized by the presence of Luzula campestris, Polygonum bisorta or Sanguisorba officinalis. The classification of grasslands according to types of dominance is not similar to the classification based on the FC. This means that in grasslands containing almost the same list of species, the dominance of these species may vary significantly. There was a strong convergence between species composition and SD in only one type of grassland, found in oceanic lowland conditions (FC types FC11 and FC12, and dominance type SD8).
Classification of grasslands according to species categories and main dominating species

SD, species dominance classes of grasslands.
Values indicate the mean dominance of the species in the class of grassland (e.g. the mean dominance of A. capillaris in the eight grasslands of the class SD2 is 0·08). Dominance is expressed as a proportion of the total plant biomass. The sum of total grasses, legumes and forbs in class is equal to 1; the difference is the proportion of bare soil. Dominances values higher or equal to 0·05 are highlighted (species mainly contributing to biomass).
Classification of grasslands according to their FC and frequency of presence species of each class of grassland

FC, floristic composition classes of grasslands. Values indicate the proportion of the grassland of the class where the species is present (e.g. 0·83 of the 12 grasslands of the class FC12 contain Oenanthe silaifolia). Empty cells of the table indicate that species is always missing in the class.
Main pedoclimatic and management features of the classes of grassland according to the FC typology (types FC1 to FC12). Missing information on features indicate that the variability of the feature within the class is too high. Soil properties are estimated from the values of Ellenberg indexes, N fertilization includes mineral and organic fertilization, stocking rates are calculated from data collected by interviewing farmers

* Estimated from Ellenberg indices.
† Fertilization in kg N/ha/year.
‡ G, grazed only; M, cut and grazed; C, cut only.
§ Stocking rate (SR) in LU/ha and grazing duration (GD) in days/year.
Main pedoclimatic and management features of the classes of grassland according to the dominance typology (types SD1 to SD14). Missing information on features indicate that the variability of the feature within the class is too high. Soil properties are estimated from the values of Ellenberg indexes, N fertilization includes mineral and organic fertilization, stocking rates are calculated from data collected by interviewing farmers

* Estimated from Ellenberg indices.
† Fertilization in kg N/ha/year.
‡ G, grazed only; M, cut and grazed; C, cut only.
§ Stocking rate (SR) in LU/ha and grazing duration (GD) in days/year.
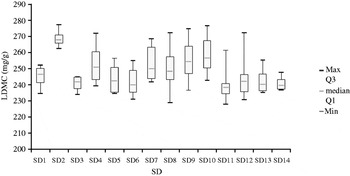
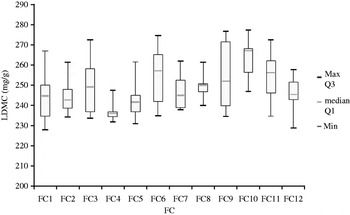
Two types of response can be distinguished regarding the link between botanical characteristics and functional characteristics (Table 8). For some classes of FC or SD, a very high variability of functional characteristics was observed, whereas this variability was low for some other types, as demonstrated in Figs 2 and 3 for LDMC. In fact, SD3 or FC4 presented a low variability, whereas SD8 or FC9 showed a high variability (Figs 2 and 3). These results pointed to a low level of redundancy among the six selected characteristics of vegetation, which were thus kept for further analyses.
Variability of LDMC (mg/g) for 14 SD types identified (cf. Table 4).

Variability of LDMC (mg/g) for the 12 FC types identified (cf. Table 5).

Correlation matrix between vegetation characteristics. Linear regressions were performed between functional characteristics, variance analysis between botanical characteristics (qualitative variable) and functional characteristics (quantitative variables), and a χ2 test between types of SD and FC

* −, negative effect; +, positive effect; 0, no statistical trend.
† P, significance threshold.
‡ LDMC, leaf dry matter content.
Environmental factors influencing botanical and functional composition
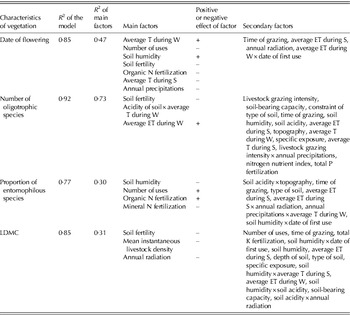
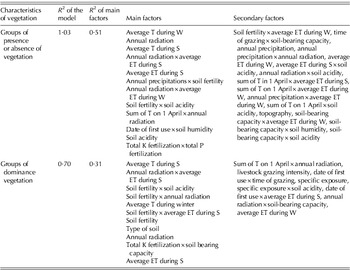
The links between the characteristics of vegetation selected previously and the management, edaphic and climatic factors are presented in Table 9 for functional composition and in Table 10 for botanical composition. The best-fitting models were able to predict from 0·70 (SD) to 0·92 (number of oligrotrophic species) of the variability of the model when all factors were considered and from 0·30 (proportion of entomophilous species) to 0·73 (number of oligotrophic species) of the variability when using main factors only. Factors were distributed into main and secondary factors according to their ranking in stepwise regressions and ANOVA. The total number of main factors underlying vegetation characteristics ranged from 3 to 7 for functional composition (Table 9) and was higher (11–12) for botanical composition (Table 10).
Significance of management, edaphic and climatic factors on functional composition (date of flowering, number of oligotrophic species, proportion of entomophilous species and LDMC): stepwise short listed factors (main factors) and significant factors (secondary factors). Main factors were classified weight hierarchy in the stepwise. See Table 2 for description of factors

LDMC, leaf dry matter content; N, nitrogen; ET, evapotranspiration; T, temperature; P, phosphorus; K, potassium; S, summer; W, winter. Factors are classified in order of importance.
Significance of management, edaphic and climatic factors on botanical composition (dominance species and FC): stepwise short listed factors (main factors) and significant factors (secondary factors). Main factors were classified weight hierarchy in the stepwise. See Table 2 for description of factors

N, nitrogen; ET, evapotranspiration; T, temperature; P, phosphorus; K, potassium; S, summer; W, winter. Factors are classified in order of importance. The R 2 of the model could be equal or greater than 1 because of the integration of interaction in the calculation of R 2.
Soil and climate appeared as main factors in accounting for all the vegetation characteristics. Even so, management factors occurred as secondary factors in all cases. Soil fertility was a major factor for many vegetation characteristics. The determination of FC and SD was more complex, with more driving factors and interactions between factors.
For functional composition, the factors determining the number of oligotrophic species were similar to those for botanical composition, with a marked effect of management factors, but a very short list of main climatic and edaphic factors. Winter conditions played an important role in climatic parameters with the contribution of average temperature (T) and average ET during winter. The proportion of entomophily species was mainly related (R 2 of main factors=0·30) to the water status of soil, the annual N supply and the number of grassland uses. Factors affecting LDMC were more closely linked to intensification (livestock density and soil fertility), with annual solar radiation also having an impact. Finally, date of flowering was influenced by more main factors than other functional characteristics, with a mixture of climatic, edaphic and management factors.
The FC appears to be driven mainly by climatic factors, distinguishing oceanic and continental or semi-continental climates. The effect of management factors was weakest, except for the first date of use, and the P and K annual supply. The results were quite different for SD, both climatic factors and soil fertility being responsible for the dominating species. The importance of management factors was very low for this characteristic.
Similarly to the main factors, the number of secondary factors accounting for vegetation characteristics was higher for botanical composition than for functional composition. Unlike the main factors, the SD and the number of oligrotrophic species were much more strongly influenced by management factors.
The date of first use and time of grazing were the most frequent factors featuring in the list of factors. Soil fertility was the most frequent main edaphic factor, whereas acidity and humidity were the most frequent secondary factors, other edaphic factors (depth of soil, soil bearing capacity, etc.) rarely occurring in the list of explanatory factors. Annual radiation and average ET during summer and to a lesser extent average ET during winter were the most frequent climatic factors determining vegetation characteristics. The effect of temperature and precipitations appeared to be relatively weak.
DISCUSSION
The set of grasslands studied was a large sample located in various areas and characterized by different combinations of management, edaphic and climatic factors. This allowed the development of an original approach to test the abiotic and management factors, which drive the botanical and functional composition of permanent grasslands.
The proportions of cut only, grazed only, and cut and grazed grasslands in the sample were close to the proportions estimated from a national survey in 1998 (Agreste 2000). However, high environmental value grasslands, which have an elevated floristic richness (i.e. >50 species for an area of c. 105 m2), are less well represented here. However, such grasslands are not the most frequent in France, so the effect on representativeness is slight. Overall, the set was strongly representative of French grasslands.
The environmental factors used in the present study were precise enough to estimate management and climate, but evaluation of soil conditions was mostly indirect. Two types of edaphic information were studied: (i) information from surveys on location, specific exposure, soil bearing capacity, type of soil, acidity of soil and humidity of soil, and (ii) Ellenberg indicators information. Some factors from surveys were retained, such as location, specific exposure, soil-bearing capacity and type of soil. However, for the other variables of the survey, the validity of data in a countrywide context was difficult to demonstrate, information on these variables being related to a small area and so difficult to compare at a national scale. Thus, specific soil measurements such as depth, humidity and acidity could enrich edaphic factors.
Redundancy among vegetation characteristics
The lack of similarity between the classifications by FC and SD may be related to the dynamics of the vegetation, and the changes in the management of grassland during the past few decades. As previously shown by Plantureux et al. (Reference Plantureux, Bonischot and Guckert1993) for grasslands submitted to significant changes in their management, SD is affected before FC, until a new equilibrium is reached. These mechanisms have different rates, so the FC mostly reflects past conditions, whereas SD reflects the response to recent perturbation, i.e. present conditions. In addition, intensification of exploitation generally favours the competitive (productive) species such as Lolium perenne, Poa trivialis and Trifolium repens, whatever the soil conditions. In more lenient management, the nature of dominating species is more sensitive to soil conditions. All these mechanisms result in a discrepancy between FC and SD. Moreover, the lower level of redundancy between functional and botanical characteristics may be attributed to the fact that different species share the same range of variability of functional traits.
In the conditions of the present work, it was hypothesized that the botanical composition of a grassland results in the trade-off between edaphic and management conditions (a two-step process), the outcome depending on the relative intensity of the more determinant (stress induced) factor.
Effect of management, edaphic and climatic factors on vegetation characteristics
Global hierarchy between factors
The present results support the view that hierarchy between factors is not the same, but differs according to the characteristics of each vegetation type. However, a higher effect of edaphic and climatic factors was found compared with management. This effect of climatic factors has previously been shown by Pakeman et al. (Reference Pakeman, Leps, Kleyer, Lavorel and Garnier2009). Also, studies showing a significant effect of management factors are generally conducted in a precise pedoclimatic context. Overall, a combined effect of management, edaphic and climatic factors generally explains the botanical or functional composition of grassland (Klimek et al. Reference Klimek, Kemmermann, Hofmann and Isselstein2007). The large gradient of edaphic and climatic conditions (from oceanic lowlands to continental mountainous conditions) considered in the present study certainly offers an explanation for this ranking. In comparison with botanical data collected in 1980 and 1990 in the same area (Lorraine; Plantureux et al. Reference Plantureux, Bonischot and Guckert1993), the present study shows a reduction of the floristic richness compared with the data collected in 2009. This erosion of biodiversity is due to a general intensification in grassland use, which flattens the gradient of management factors.
Factors influencing vegetation characteristics
Continentality (evaluated by average summer and winter temperature) and intensification (evaluated by number of uses, fertility of soil and organic fertilization) are the main factors affecting the community and then, indirectly, date of flowering. Plant communities with a late date of flowering are found in less intensive grasslands or oceanic conditions. This effect of climatic factors, and more specifically temperature, precipitation and humidity on date of flowering is consistent with the literature (Martini et al. Reference Martini, Biondi, Batista and Natal2010), as for edaphic factors (Seghieri et al. Reference Seghieri, Vescovo, Padel, Soubie, Arjounin, Boulain, De Rosnay, Galle, Gosset, Mouctar, Peugeot and Timouk2009). Management factors and particularly intensification could affect date of flowering, reducing flowering and number of species (Kopec et al. Reference Kopec, Zarzycki and Gondek2010). Also, little is known about the direct effect of nutrients and defoliation regimes on phenological stages for species-rich grasslands, and studies generally find small variations in date of flowering (Cleland et al. Reference Cleland, Smith, Andelman, Bowles, Carney, Horner-Devine, Drake, Emery, Gramling and Vandermast2004).
The effect of soil fertility appears, as expected, as the main explanatory factor for a number of oligotrophic species. Soil fertility is linked to the region and to past and present management, which affect this factor (Kapfer Reference Kapfer1988; Grevilliot & Muller Reference Grevilliot and Muller1996). In addition, the other factors expected were management factors. Here management factors, which are more closely linked to grazing conditions, appear secondary (Kapfer Reference Kapfer1988; Grevilliot & Muller Reference Grevilliot and Muller1996).
However, the present results show that south mountain grassland conditions associated with uplands grassland of central France and oceanic wet grassland conditions affect a number of oligotrophic species. These are characterized by an elevated average ET during winter (Table 9), which helps to increase the number of oligotrophic species. Upland grasslands of central France have an elevated number of oligotrophic species due to the acidity of soil and average temperature in winter conditions (limitation of winter mineralization).
As expected from the hypothesis, intensification was the main factor affecting the proportion of entomophily species. The impact of an intensification of the practices on this factor has been shown previously (Potts et al. Reference Potts, Woodcock, Roberts, Tscheulin, Pilgrim, Brown and Tallowin2009; Batary et al. Reference Batary, Baldi, Sarospataki, Kohler, Verhulst, Knop, Herzog and Kleijn2010). The present work also demonstrates a negative effect of soil humidity on this factor; the most likely explanation is due to the management of grasslands. In fact grasslands in humid conditions present a weak proportion of entomophilous species because they are more intensively managed.
The main factors affecting LDMC are consistent with the fact that LDMC reflects the nutrient capture strategy of plants. LDMC is thus a life trait mainly driven by soil fertility and frequency of use as expected by the hypothesis. LDMC decreases when grazing pressure or mowing frequency increases and with high fertilization (Fonseca et al. Reference Fonseca, Overton, Collins and Westoby2000; Al Haj Khaled et al. Reference Al Haj Khaled, Duru, Theau, Plantureux and Cruz2005; McIntyre Reference McIntyre2008; Ordonez et al. Reference Ordonez, Van Bodegom, Witte, Wright, Reich and Aerts2010).
Botanical composition was mainly influenced by climatic and edaphic factors, as expected by the hypothesis. The marked effect of habitat factors taking into consideration soil and management factors has been shown (Weibull & Östman Reference Weibull and Ostman2003) and notably the effect of soil fertility (Kopec et al. Reference Kopec, Zarzycki and Gondek2010). The effect of habitat includes management factors (Kahmen et al. Reference Kahmen, Poschold and Schreiber2002) and also a joint effect of management and environmental factors (Klimek et al. Reference Klimek, Kemmermann, Hofmann and Isselstein2007). The more sensitive effect of management factors on dominance species was not demonstrated in the present work. Management factors were less strongly represented for FC and dominance species. A very small effect of landscape factors on botanical composition has been demonstrated (Weibull & Östman Reference Weibull and Ostman2003), but the weakness of the effect confirmed that it did not need to be taken into consideration in the present work.
CONCLUSION
Management, edaphic and climatic factors help to explain vegetation characteristics, with a predominant effect of edaphic and climatic factors. Functional composition was characterized by management, edaphic and climatic factors together, whereas botanical composition was mainly influenced by climatic and edaphic factors and included more factors and more interactions between factors. Interactions between factors have to be taken into consideration to predict the botanical and the functional composition of grasslands. Also, relations between vegetation characteristics and environmental factors could be extrapolated over a long gradient of situations. The hypotheses concerning factors driving the functional composition were confirmed. However, functional composition is explained by other factors such as management factors for proportion of entomophilous species, although the effect of management on botanical composition and more specifically on dominance species was demonstrated but not as a major factor. The present study demonstrates that over the management and pedoclimatic gradient studied in this set of grasslands, functional and botanical vegetation characteristics were not closely linked. Vegetation characteristics are good predictors of ecosystem services. Thus to predict ecosystem services delivered by grasslands, functional and botanical composition have to be taken into consideration and may be used in combination.
This study was funded by the French Ministry of Agriculture and supported by the CAS DAR programme. This programme was conducted in collaboration with the French Livestock Institute, INRA, Nancy University and agricultural extension services. We thank E. Pottier, the manager of the study, botanical experts (P. Carrère, L. Chabrol, P.O. Cochard, B. Dury, A. Farruggia, D. Leconte and P. Pierre), 33 members of agricultural extension services for data collection, Meteo France, the national service for climate recording for climatic data and B. Noirtin for spatialization data. Finally, we thank the farmers who helped us set up our sample of grasslands.