I. INTRODUCTION
Direct space methods for crystal structure solution from powder diffraction data, including the Monte Carlo method (Kariuki et al., Reference Kariuki, Zin, Tremayne and Harris1996; Andreev et al., Reference Andreev, Lightfoot and Bruce1997), genetic algorithms (GAs) (Kariuki et al., Reference Kariuki, Serrano-González, Johnston and Harris1997; Shankland et al., Reference Shankland, David and Csoka1997), and simulated annealing (Andreev and Bruce, Reference Andreev and Bruce1988; David et al., Reference David, Shankland and Shankland1998), began their development with the appearance of high-speed computers at the beginning of 1990s. Nowadays, programs using the simulated annealing method, such as FOX (Favre-Nicolin and Černý, Reference Favre-Nicolin and Černý2002), DASH (David et al., Reference David, Shankland, Van de Streek, Pidcock, Motherwell and Cole2006), and TOPAS (Whitfield et al., Reference Whitfield, Davidson, Mitchell, Wilson and Mills2010), are widely applied. GAs are implemented in the known EAGER (Harris et al., Reference Harris, Johnston and Kariuki1998), GEST (Feng and Dong, Reference Feng and Dong2007), and MAUD (Lutterotti and Bortolotti, Reference Lutterotti and Bortolotti2003) programs. The essence of GA is the modeling of natural biological selection operations: pairwise crossing, mutation, and selection of the best trial structural models for getting new advanced generations.
According to Le Bail and Cranswick (Reference Le Bail and Cranswick2009), the crystal structures of over 200 new substances are annually solved by methods of global optimization in direct space. A common problem of these methods is a deterioration in the convergence along with an increase in the complexity of determined structures because of a non-linearly growing probability of GA and stagnation in the numerous local minima of the R-factor hypersurface. Therefore, in practice their use is limited by the number of degrees of freedom to be varied (usually no more than 30–50). Simulated annealing techniques are the most common and easy to use amongst the methods of global optimization in the direct space. Shankland et al. (Reference Shankland, Spillman and Kabova2013) point out that the principal disadvantage in the GA implementation is the need to set numerous parameters that regulate the evolution processes.
With the increase in the number of multi-core computers and clusters, parallel computing becomes more popular. For example, related versions of FOX.Grid (Rohlíček et al., Reference Rohlíček, Hušák and Favre-Nicolin2010), GDASH (Griffin et al., Reference Griffin, Shankland, van de Streek and Cole2009a), and MDASH (Griffin et al., Reference Griffin, Shankland, van de Streek and Cole2009b) software have been developed. Meredig and Wolverton (Reference Meredig and Wolverton2013) describe a new hybrid approach for the automated crystal structure solution, which combines the application of GAs for the crystal structure algorithmic optimization from experimental diffraction data with the calculation of structural models from the first-principles density functional theory energies. Articles dedicated to the development of different parallel GA models for supercomputing clusters and application of distributed computing in a number of other science and technology fields, are being published increasingly (Falahiazar et al., Reference Falahiazar, Teshnehlab and Falahiazar2012; Kurose et al., Reference Kurose, Yamamori, Aikawa and Yoshihara2012; To and Elati, Reference To and Elati2013; Nalepa and Blocho, Reference Nalepa and Blocho2014; Ozkan et al., Reference Ozkan, Ermis and Bekmezci2015).
The first version of the parallel GA for crystal structure solution was proposed by Habershon et al. (Reference Habershon, Harris and Johnston2003). This version is based on the successfully used single-population GA (Albesa-Jové et al., Reference Albesa-Jové, Kariuki, Kitchin, Grice, Cheung and Harris2004), which is complemented with a direct exchange of random structural models among different GA populations. However, this approach has not been sufficiently developed so far. At the same time, GAs have two essential advantages. Firstly, they simultaneously execute the evolution of the whole set (population) of trial structural models, i.e. explore in parallel a wide region of the structural parameters space. Secondly, the parallel GA is much better suited for implementation on supercomputing clusters than in a single one. This creates the possibility of using the full power of parallel computing for structural analysis (Habershon et al., Reference Habershon, Harris and Johnston2003). The multi-population approach could help to solve more complex structures, but it has not almost been investigated so far.
We present a multi-population parallel GA, which implements co-evolution of independent GA processes on computational cores of multicore PC or cluster. Co-evolution is performed by accumulating the best trial structural models on the managing core and then selectively transmitting them into populations on the working cores. Such approach contributes to getting out from local minima of the R-factor hypersurface, accelerates the accumulation of correct atomic positions in the populations and increases the probability of GA convergence when more complex structures (Burakov et al., Reference Burakov, Zaloga, Semenkin and Yakimov2015) are managed.
II. EXPERIMENTAL
A. Features of MPGA
The design and the current features of MPGA are described in more detail by Burakov et al. (Reference Burakov, Zaloga, Semenkin and Yakimov2015). Below we present a general description of its original features. The main ones are:
-
(1) Appointing of penalties to a structure:
-
• if the distance among atoms is less than a minimum value,
-
• if the number of interatomic bonds is different from the theoretical one.
-
-
(2) Working with the molecular fragments and restricting of distances and angles within the fragments.
-
(3) Automatically putting the atoms on the symmetry elements if near to them.
-
(4) Working with multi-phase samples.
-
(5) Providing built-in tools for the convergence process analysis: convergence chart for each core, 3D crystal structure, atoms distribution maps at each generation.
-
(6) Being based on the FOX/ObjCryst++ library (Favre-Nicolin and Černý, Reference Favre-Nicolin and Černý2002).
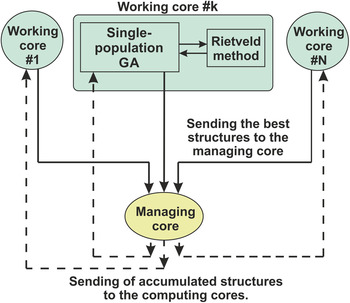
Figure 1 shows the flow-chart of MPGA. Green color indicates working cores, which execute individual GA processes. Yellow color indicates a managing core, where the accumulation of the best structures and the control of their distribution to the working cores is carried out.
(Color online) The flowchart of MPGA.

From this flow-chart the factors improving the MPGA convergence can be seen:
-
(1) the execution of independent parallel processes with different settings on working cores;
-
(2) the refinement of the best structures by the Rietveld method;
-
(3) the co-evolution involving accumulation and a managed exchange of the best solutions among the GA processes.
B. Analysis of the MPGA effectiveness increasing the amount of involved resources
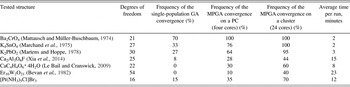
Comparative tests of MPGA with different amount of involved resources were conducted over several known crystal structures. Results are shown in Table I. It demonstrates that the structure determination on four-core PC is two to three times as reliable as for the single-population GA, while for supercomputer cluster it is two to fourtimes as reliable as for four-core PC. The table has only one column “Time per run”, because in all modes the number of parallel processes was different, while the number of generations and the number of individuals in each process was the same.
The MPGA performances and efficiency investigated on known structures.

C. Determination of the crystal structure of [Pt(NH3)5Cl]Br3 using MPGA
1. Description of the input data for the determination of the crystal structure
The unknown crystal structure of [Pt(NH3)5Cl]Br3, synthesized from standard chemical reagents with a purity not less than “chemically pure—analytically pure”, has been chosen to be solved. Synthesis of [Pt(NH3)5Cl]Br3 was made as follows. The complex compound [Pt(NH3)5Cl]Cl3 × H2O, obtained in accordance with Chernyaev (Reference Chernyaev1964), was dissolved in a minimum amount of water at 30–40 °C, then a concentrated solution of potassium bromide with a molar ratio Pt : Br = 1 : (3–4) was added. The formed precipitate was filtered, washed with water and ethanol and subsequently dried on a filter. The X-ray powder diffraction pattern was recorded in the reflection geometry on a PANalytical X'Pert PRO diffractometer with a PIXcel detector (CoKα radiation, 2θ scan range 6°–110°). The indexing of the diffraction pattern and the determination of the space group symmetry were carried out by the EXPO program (Altomare et al., Reference Altomare, Caliandro, Camalli, Cuocci, Giacovazzo, Moliterni and Rizzi2004). As a result, the following crystallographic characteristics were determined: space group I41/a, unit-cell parameters a = 17.2587(5) Å; c = 15.1164(3) Å, V = 4502.61(10) Å3, Z = 16, with M 20 = 20 and F 20 = 38. The conformity of all the experimental diffraction peak positions to those calculated from the crystal lattice parameters confirmed the purity of the chemical synthesis.
The profile parameters of the diffraction pattern and the target value of the profile R-factor equal to 5.49% were determined using the Le Bail method. Restrictions on the interatomic distances were imposed according to the statistics of the interatomic distances distribution, which has been calculated by Diamond program (Pennington, Reference Pennington1999) using structures having a similar composition.
The required parameters for solving this structure by MPGA were the locations of three Br atoms and the a priori knowledge of the structural fragment of PtN5Cl (its orientation was described by quaternion consisting of four elements) in the unit cell. The hydrogen atoms were not taken into account at this stage, whereas the parameters of the atomic isotropic thermal oscillations were taken from structures of similar composition. The total number of degrees of freedom for this structure is 16.
The crystal structure determination was performed using the MPGA software on a computer equipped with an Intel i7–3770 processor having eight processing threads. Seven of them were involved in the evolutionary search of the crystal structure in independent populations and one thread managed the accumulation of the best structural models from the generated populations and the exchange between populations (Zaloga et al., Reference Zaloga, Burakov, Semenkin and Yakimov2014). The MPGA version providing real-coded atomic coordinates and the periodical local optimization of the best structural models by local search (LS) of the Rietveld method (Burakov et al., Reference Burakov, Zaloga, Semenkin and Yakimov2015) was used. The evolutionary search of the crystal structure was performed automatically after the MPGA launch, and the process was visually controlled with convergence charts, charts of atomic positions distribution in the populations, and comparative charts between the experimental powder pattern and that one obtained from the best structural model in a current generation. It should be mentioned that the presetting of the search parameters for the MPGA operation is required because their quality affect the probability of GA to converge to the correct structure. This was achieved by an empirical selection from the parameters used in the MPGA launches for searching the known crystal structures of [Pd(NH3)4](C2O4) and [Pt(NH3)2(C2O4)], which compositions are similar to the investigated structure's one.
2. MPGA convergence during the structure determination of [Pt(NH3)5Cl]Br3
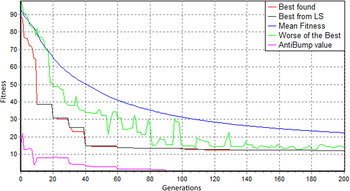
Figure 2 shows the graph of the MPGA convergence for the [Pt(NH3)5Cl]Br3 structure determination. The combination of the reported diagrams allows the control and the analysis of the convergence process.
(Color online) MPGA convergence graph for the search of [Pt(NH3)5Cl]Br3 structure. The X-axis is the number of generations in the population (the number zero is the initial random generation of all populations); the Y-axis is the fitness function value (R-factor plus penalties for violation of the structural limitations) of the best structural model selected from the accumulated structures at the control core. The red line is the fitness value for the best found structural models. The black line is the best fitness value obtained after the refinement of the best structural model by the LS method (it has a stepped appearance when the LS execution mode sets to once every few generations). The purple line is the contribution of penalties to the fitness function value. The blue line is the average fitness value of the structural solutions accumulated on the managing core. The green line is the fitness value of the worst, among the best, solutions on the working cores.

It can be seen from Figure 2 that by the 40th generation of the evolution process, the fitness value of 15% rel. was reached and the structure had been essentially formed. However, it was not yet fully correct, because the interatomic distances were beyond the limits (a penalty level for this trial structure was about 15% of a fitness value). By the hundredth generation the penalty had disappeared, all the interatomic distances had become correct and the fitness value had coincided with the R-factor value. Next, the R-factor was gradually reduced from 13.5 to 12% rel., mainly because of the refinement of the PtN5Cl fragment's orientation, and by the 180th generation the convergence had been completed. Wherein, the best structural models were gradually spread over the populations on the working cores (the green line is decreasing). It should be noted that almost all sharp declines of the fitness function occurred because of a local optimization of the structural models (the red line becomes coincident with the black one).
A new visualizer was developed to better understanding the GA convergence processes in populations in the working cores. It allows visualizing the projection of the atomic positions at chosen basic planes of the unit cell (e.g., ac) for all structural models in a population at a chosen generation. It is possible to specify the atomic coordinates of a known structure to compare with, and these positions will be marked with colored crosses (+). Thus, the visualizer allows us to scroll and compare in real time the distributions of atoms in different populations at different evolutionary generations and compares them with the working cores convergence charts, etc. In particular, this tool is very useful to study the MPGA convergence on the test crystal structures.
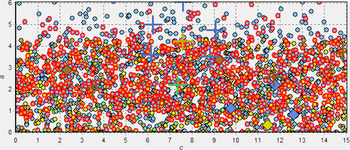
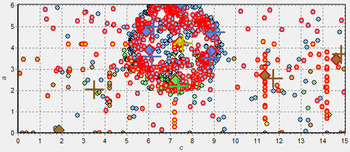
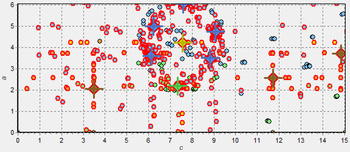
To illustrate the MPGA convergence process, atomic positions distribution maps for the [Pt(NH3)5Cl]Br3 search are reported in Figures 3–5. The projection of an independent part of the cell on the ac-plane is shown. Crosses (+) indicate correct positions; diamonds indicate the positions of the best structure's atoms; circles indicate the other atoms. Pt atoms are shown in yellow, N in blue, Cl in green, and Br in brown.
(Color online) First generation. Completely random structures. R wp value of the best solution = 84.36%. The X-axis is the direction c (Å) in the unit cell; the Y-axis is the direction a (Å) in the unit cell.

(Color online) 21st generation. 70% of the atoms are close to the correct positions. R wp value of the best solution = 40.78%. The X-axis is the direction c (Å) in the unit cell; the Y-axis is the direction a (Å) in the unit cell.

(Color online) 200th generation. R wp value of the best solution = 11.13%. The X-axis is the direction c (Å) in the unit cell; the Y-axis is the direction a (Å) in the unit cell.

The pictures demonstrate how the atomic positions in a population of structure models evolve from randomly generated (Figure 3) to the correct positions (shown with the crosses (+)), identified from a full-profile refinement of the best structural model.
3. Refinement of the crystal structure
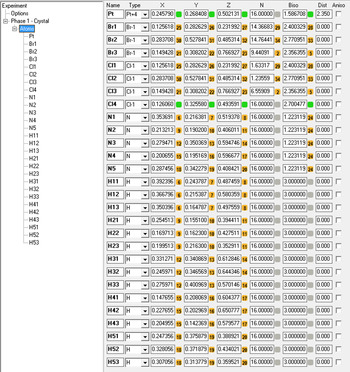
The structural model obtained from the MPGA had been refined by the DDM full-profile analysis software (Solovyov, Reference Solovyov2004) involving the thermal oscillation parameters of the atoms. The obtained R-factor value of 7.64% was higher than the target value by 2.15%. Next, the positions of the hydrogen atoms, which are chemically bonded with the nitrogen atoms in NH3 groups (taken from similar structures in the ICSD database), were added to the structure and the DDM refinement was repeated. Hydrogens were rigidly attached to the nitrogen so that just the positions of the NH3 groups were refined. As result, the profile R-factor had been reduced to 6.89%. However, it still was by 1.9% higher than the target value and the values of the isotropic thermal oscillation coefficients of Br atoms (especially Br3) were too high. Thus, it was concluded that a number of Br atoms is statistically replaced with lighter Cl atoms. To take this into account, three Cl atoms were added to the structure in positions of Br atoms and their occupancy factors were functionally associated with the occupancy factors of the appropriate Br atoms. Figure 6 shows DDM settings for the refinement of a non-stoichiometric variant of the [Pt(NH3)5Cl]Br3−x Cl x structure.
(Color online) Settings of the DDM program for the refinement of non-stoichiometric [Pt(NH3)5Cl]Br3−x Cl x structure, the refining parameters marked by buttons: independent, by green; functionally connected, by orange (numbers on the buttons show connection number).

III. RESULTS AND DISCUSSION
The probability that the atomic coordinate will be randomly generated in neighborhood of its correct position (no more than ~0.03 of the length of the unit-cell axis from the correct position; on Figures 3–5 it is the radius of crosses) is about 1/33. It is experimentally shown by Yakimov et al. (Reference Yakimov, Kirik, Semenkin, Solovyov and Yakimov2013) that a structural model having atoms quite precisely localized can be effectively refined by the LS method (at least, when the lengths of the unit-cell axes are up to 10–15 Å). The initial population of even 50 structural models contains in average one or two such coordinates for each atom (in different models). The MPGA convergence is produced by an evolutionary accumulation of “good” coordinates in a population (it goes step by step from heavy atoms to light atoms) because of successful crossings and the LS minimization. It is because the R-factor has statistical sensitivity to determining the correct set of the heavy atom atomic coordinates, while the other lighter atoms are distributed randomly (Yakimov et al., Reference Yakimov, Kirik, Semenkin, Solovyov and Yakimov2013). In addition, it is complemented by the exception of chemically incorrect structural models (by adding a penalty to the R-factor value).
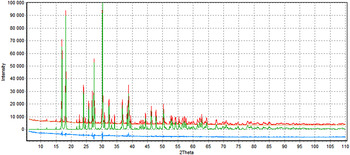
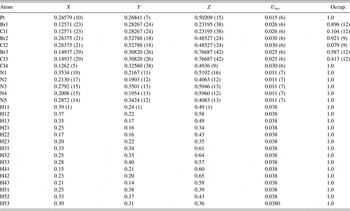
The final refinement of the structural model found by DDM resulted in a profile R-factor value of 5.64%, which corresponded well with the target value of 5.49%. Figure 7 shows the comparison between the experimental and the calculated powder diffraction pattern, this last from the refined structure. The atomic coordinates, atomic isotropic thermal parameters and the occupancy coefficients are shown in Table II. The calculated chemical formula of the compound (according to Table II) is [Pt(NH3)5Cl]Br2.4Cl0.6.
(Color online) Comparison of the experimental diffraction pattern (the red line) and the calculated one (the green line) obtained after the final refinement by DDM, for the [Pt(NH3)5Cl]Br2.4Cl0.6 compound; the blue line represents the difference profile; the R-factor value is 5.637%. The X-axis is the scattering angle 2θ; the Y-axis is the scattering intensity.

Fractional atomic coordinates, isotropic displacement parameters (Å2) and occupancy for [Pt(NH3)5Cl]Br2.4Cl0.6 crystal structure.

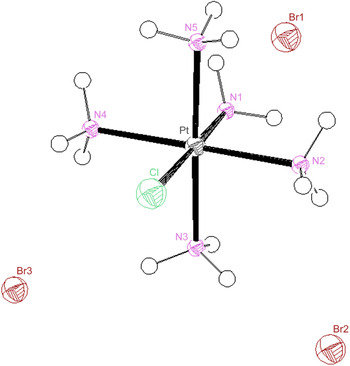
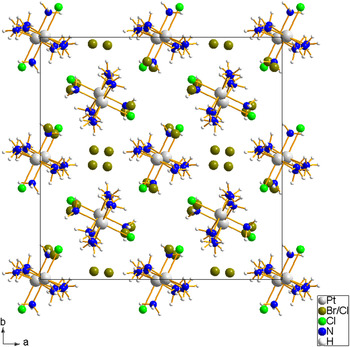
The scheme of atoms localization in the [Pt(NH3)5Cl]Br2.4Cl0.6 crystal structure is shown in Figures 8 and 9.
(Color online) The complex cation [Pt(NH3)5Cl]3+ surrounded by three independent Br– anions in the [Pt(NH3)5Cl]Br2.4Cl0.6 crystal structure.

(Color online) The projection of the [Pt(NH3)5Cl]Br2.4Cl0.6 crystal structure on the ab-plane of the crystal lattice.

The crystal structure is built with complex [Pt(NH3)5Cl]3+ cations and three crystallographically independent Br– anions. All the atoms are located in general positions. because of the presence of the chlorine atom, the complex cation shapes are distorted octahedra having the following bond lengths: Pt–Cl4 = 2291 Å; Pt–N1 = 2077 Å; Pt–N2 = 2058 Å; Pt–N3 = 2067 Å; Pt–N4 = 2051 Å; Pt–N5 = 2038 Å. The N1 and C14 atoms are located at the vertices of the octahedron, while the other four nitrogen atoms lie at its base. The N–Pt–N angles in the octahedron base deviate from the right ones and range from 86.9 to 93.2°. The angle among the atoms at the vertices of the N1–Pt–Cl4 octahedron is 176°. These bond lengths agree well with the interatomic distances in similar structures. A good correspondence between interatomic bond lengths and their statistical distribution in similar structures and a low value of the profile R-factor indicate the adequacy of the found crystal structure. A check by the online IUCr CheckCIF/PLATON service (Spek, Reference Spek2003) confirmed the structure correctness.
IV. CONCLUSION
The MPGA software, implementing a multi-population GA and using parallel computing on multi-core PCs and supercomputer clusters, was developed. A further development of MPGA for solving more complex structures has been planned.
It was shown that the increase in the number of processing cores allows the structure solution of more complex structures. The structure determination on four-core PC was two to three times as reliable as for the single-population GA, while for supercomputer cluster it was two to four times as reliable as for four-core PC.
The crystal structure of the complex compound [Pt(NH3)5Cl]Br3 was determined by multi-population GA, and then refined with the localization of the hydrogen atoms by DDM software. Non-stoichiometry of the synthesized compound was determined. The positions of each of the Br anions are statistically partially occupied by Cl anions. The overall chemical formula is [Pt(NH3)5Cl]Br2.4Cl0.6.
SUPPLEMENTARY MATERIAL
The supplementary material for this article can be found at https://doi.org/10.1017/S0885715617000197
ACKNOWLEDGEMENTS
The reported study was funded by Russian Foundation for Basic Research, Government of Krasnoyarsk Territory, Krasnoyarsk Region Science and Technology Support Fund to the research project №16-43-243049.