INTRODUCTION
Snail-trematode immunobiological interactions have been studied in the fresh-water snail Biomphalaria glabrata following infection by trematodes like the human blood fluke Schistosoma mansoni or echinostome species (Echinostoma paraensei or Echinostoma caproni). As compatibility polymorphism was evidenced in these different models (Richards, 1975; Richards and Shade, 1987; Lewis et al. 1993; Langand and Morand, 1998), numerous molecular studies comparing susceptible and resistant strains of molluscs were undertaken to elucidate the mechanisms underlying differences in compatibility. These studies revealed many transcripts or proteins that were differentially expressed between strains of B. glabrata susceptible or resistant to S. mansoni or E. caproni (Miller et al. 2001; Raghavan et al. 2003; Lockyer et al. 2004; Nowak et al. 2004; Vergote et al. 2005; Jung et al. 2005; Bouchut et al. 2006a,b).
In the B. glabrata/E. caproni system we are investigating, 2 snail strains have previously been selected for resistance or susceptibility to this parasite (Langand et al. 1998). E. caproni miracidia are able to penetrate both susceptible and resistant snails. While the parasite undergoes normal development in susceptible snails, it is encapsulated and eliminated in resistant snails. Susceptibility/resistance of B. glabrata to E. caproni is inherited in a multigenic fashion (Langand and Morand, 1998) and has been shown to rely on both cellular and humoral factors (Ataev and Coustau, 1999). Regarding humoral factors, calcium-binding proteins and glycolytic enzymes differentially represented in the plasma of susceptible and resistant snails were identified using a comparative proteomic approach (Vergote et al. 2005). This study also showed that the genes encoding these plasmatic proteins are mainly expressed in the albumen gland, raising the question of the potential involvement of this organ in mechanisms underlying susceptibility/resistance to E. caproni. Regarding cellular factors, previous studies showed that excretory-secretory (ES) products from in vitro transformed E. caproni sporocysts inhibited key defence functions of susceptible host haemocytes such as adhesion and phagocytosis (Lie, 1982; Humbert and Coustau, 2001). Interestingly, haemocytes from resistant snails remained unaffected by these parasite ES products, suggesting that they exhibit constitutive differences with susceptible snails haemocytes (Humbert and Coustau, 2001). In order to investigate the molecular basis of these differences, we developed comparative molecular approaches on haemocytes of the two strains. A global proteomic approach on this cell type allowed the identification of several proteins that were differentially represented in haemocytes from the susceptible and resistant snails (Bouchut et al. 2006b). Another study, focusing on genes involved in adhesion processes confirmed the potential importance of several candidate genes like dermatopontins and matrilin-like molecules (Bouchut et al. 2006a) This transcriptomic approach also revealed several genes that were differentially expressed in whole bodies of E. caproni-susceptible and -resistant B. glabrata.
These different approaches taken together allowed identification of several candidate genes and suggested a potential involvement of tissues other than haemocytes in susceptibility/resistance processes. In order to investigate this latter point, we compared in the present work the transcripts of the two snail strains at the whole body level using a Suppression Subtractive Hybridization (SSH) approach. Herein, we describe 3 main categories of ESTs: those directly related to immune function, ESTs related to calcium homeostasis and ESTs encoding glycolytic enzymes. Quantitative analyses of transcript levels confirmed their differential expression and the validity of this SSH approach.
MATERIALS AND METHODS
Biomphalaria glabrata strains
Biomphalaria glabrata snails used in this study belonged to the EAF-S or CB-R strains selected, respectively, for their susceptibility or resistance to E. caproni (Langand et al. 1998; Humbert and Coustau, 2001). The selection was performed from the polymorphic Bg.Bra strain (Langand et al. 1998). At the time of the study, the percentages of adult snails susceptible to E. caproni were: Bg.Bra=70%, EAF-S=98% and CB-R=1%.
RNA isolation and substractive cDNA library construction
Total RNA from whole body of unexposed (to E. caproni) EAF-S and CB-R snails was extracted according to previously described procedures (Guillou et al. 2004). The total RNAs from 10 individuals were pooled for each strain. For subtractive library construction, poly(A)+ RNA was purified using NucleoTrap mRNA purification kit (Clontech). Two forward and reverse libraries were constructed by subtracting mRNA from EAF-S and CB-R strains (tester) with mRNA from CB-R and EAF-S strains (driver), respectively. SSH libraries were produced using the PCR-Select cDNA subtraction kit (Clontech). Tester and driver cDNA were prepared using 2 μg of poly(A)+ RNA. Enzyme digestion, adapter ligation, hybridization, and PCR amplification were performed according to protocols provided by the manufacturer (Clontech). PCR products were cloned into pCR4-TOPO cloning vector using TOPO TA cloning kit (Invitrogen) and transformed into One Shot TOP10 chemically competent Escherichia coli cells (Invitrogen). The 2 libraries obtained were named EAF-S and CB-R libraries and contained transcripts potentially over-represented in the 2 corresponding strains respectively.
A total of 256 EAF-S library clones and 257 CB-R library clones were randomly selected and single-pass sequenced using a dideoxy-dye-terminator method (CEQ™ DTCS-Quick Start kit, Beckman Coulter) and a CEQ™ 8000 apparatus (Beckman Coulter). Vector and adaptor sequences were trimmed from all sequences using Sequencher™ software (Gene Codes Corporation). All sequences were then examined for possible sequencing errors. High quality ESTs, longer than 150 bp, in length, were assembled in clusters (Sequencher™ software). Consensus sequences from clusters or unique sequences from singletons were submitted to database searches using BLASTX and BLASTN programs (http://blast.genome.jp/ or http://www.ncbi.nlm.nih.gov/BLAST/). Specific domain searches were performed using the RPS-BLAST program (http://www.ncbi.nlm.nih.gov/Structure/cdd/wrpsb.cgi). EST sequences have been submitted to the dbEST databases (GenBank Accession nos. from EE049524 to EE049639 for the EAF-S library and from EE049640 to EE049693 for the CB-R library).
Real-Time PCR (Q-PCR)
Considering their similarities and their putative interest in our system, genes encoding proteins like CaBP, carbohydrate hydrolytic enzyme genes belonging to immunity class, cytoskeleton structure, cell adhesion, transport, cholesterol homeostasis and transcription regulation were selected for quantitative analysis of their transcripts. Real-Time RT- PCR analysis was performed on total RNAs extracted from EAF-S and CB-R snails. Reverse transcription was performed according to previously described procedures (Guillou et al. 2004). Specific primers for Q-PCR were edited using the Light Cycler Probe Design Software version 1.0 (Roche Diagnostics) (Table 1). PCR reactions were set up according to the LightCycler Manual (Roche Diagnostics). The following LightCycler run protocol was used: denaturation programme (95 °C, 10 min), amplification and quantification programmes repeated 40 times (95 °C for 15 s, 60 °C for 5 s, 72 °C for 16 s), melting curve programme (60–95 °C with a heating rate of 0·1 °C per second and continuous fluorescence measurement), and a cooling step to 40 °C. Amplification of single highly specific products was verified (melting curve analysis). For each reaction, the crossing point (CP) was determined using the ‘Fit Point Method’ of the LightCycler Software 3.3 (Roche Diagnostics). Three independent PCR reactions were performed in duplicate and the mean values of the CPs were calculated. For each mRNA to be analysed, the absence of contaminating genomic DNA was verified by running a no-RT control using primers for the ribosomal protein S19 (S19, Accession number CK988928).

Amplification efficiencies (E) of each PCR product were determined according to previously described procedures (Guillou et al. 2004). For each sample, the level of transcription of the target gene (Tg) was compared to the transcription of the ribosomal protein S19. The transcription ratio (R) was calculated according to the formula:

Statistical significance was assessed using the Mann-Whitney U-test for non-paired series and the Wilcoxon test for paired series. P values <0·05 were considered as significant. All tests were performed using STATVIEW v. 4.5 statistic software package.
RESULTS
EST sequencing and general characteristics of EAF-S and CB-R libraries
In total 256 EAF-S library clones and 257 CB-R library clones were sequenced. Using the CEQ™ 8000 sequence analysis software, 227 and 235 cDNA high quality sequences were obtained as one-path reads from the 2 libraries respectively (Table 2). ESTs were aligned and assembled in clusters using the Sequencher™ software. For the EAF-S library, ESTs coalesced into 41 contigs and 84 singletons, suggesting that the overall redundancy of the library was 63·4%. For the CB-R library, ESTs coalesced into 20 contigs and 47 singletons for an overall redundancy of 80% (Table 2).

All clusters, consensus sequences from contigs or unique sequences from singletons, were submitted to database searches using BLASTX and BLASTN programs (http://blast.genome.jp/ or http://www.ncbi.nlm.nih.gov/BLAST/). Clusters corresponding to contaminant sequences – vector, repeated DNA, rRNA, xenocontaminants (sequences from foreign genome) – were removed from the analysis. In order to minimize redundancy in the EST database, sequences displaying 100% identity were submitted as a single sequence. ESTs aligning in the same contig but displaying differences in their nucleotidic sequence were submitted individually to the database. A total of 116 and 54 ESTs were submitted to the dbEST section of the NCBI/GenBank database for the EAF-S and CB-R libraries, respectively (Accession numbers from EE049524 to EE049639 and from EE049640 to EE049693).
Exclusion of false-positive and functional groups of ESTs from the two libraries
As a first approach to exclude false-positives, previously selected clusters of the 2 libraries were aligned and compared using the Sequencher™ software. All sequences common to the 2 libraries were eliminated from the analysis.
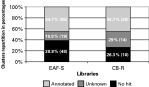
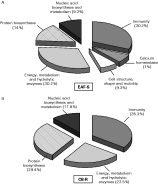
Selected ESTs were subjected to BLASTN and BLASTX search. Sequence similarities were considered to be significant when the expected value was less than 10−2. Comparison of the ESTs against non-redundant protein and nucleic databases revealed that 38·8% of EAF-S and 26·3% of CB-R clusters did not align significantly with known genes, 16·5% of EAF-S and 29% of CB-R significantly aligned with genes of unknown function, and the remaining 44·7% of clusters (for both strains) were significantly similar to genes of known function (Fig. 1). All clusters corresponding to this last category were assigned functions as predicted from sequence similarity and subsequently classified into distinct functional classes. ESTs from the EAF-S library were assigned to 6 major classes (Fig. 2A): (1) immunity, (2) calcium homeostasis, (3) cell structure, shape and mobility, (4) energy metabolism and hydrolytic enzymes, (5) protein biosynthesis, (6) nucleic acid biosynthesis and metabolism. ESTs from the CB-R library were grouped into 4 classes (Fig. 2B): (1) immunity, (2) energy metabolism and hydrolytic enzymes, (3) protein biosynthesis and (4) nucleic acid biosynthesis and metabolism.

Fig. 1. Cluster distribution of the EAF-S and CB-R libraries after BLASTN and BLASTX analysis. ‘Annotated’ clusters are clusters displaying similarities for genes of known function. ‘Unknown’ clusters display similarities for sequences present in the dbEST database of Genbank showing no similarities for genes of known function. The last group ‘No hit’ corresponds to clusters displaying no homology for any sequences present in any non-redundant databases. The percentage represents the number of clusters for each category. The number given in parentheses is the total number of sequences for each category.

Fig. 2. Distribution of the annotated clusters from the EAF-S (A) and CB-R (B) libraries into functional classes. The percentages of clusters for each class are given in parentheses.
ESTs of interest and selection of ESTs for which transcripts are differentially represented between strains
Among the genes identified, several functional groups are of particular interest. Some of these genes encoding proteins like CaBP or carbohydrate hydrolytic enzymes (Table 3) were identified in a previous proteomic study (Vergote et al. 2005), therefore supporting the potential importance of their corresponding functional groups. Indeed, the same genes (cluster numbers 21 and 22, Table 3) and novel genes of the same families (clusters 14, 15, 16 and 23, 24, 25, 26, Table 3) were identified in the present transcriptomic study. In addition, we identified here novel genes belonging to other functional groups of potential interest in our system (genes belonging to immunity class, cytoskeleton structure, cell adhesion, transport, cholesterol homeostasis and transcription regulation). All the genes corresponding to these different functional groups were selected for further analysis. Genes involved in protein and nucleic acid biosynthesis were arbitrarily excluded from the analyses.

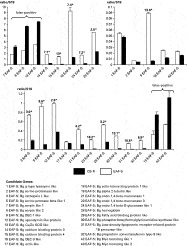
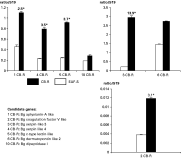
In order to assess the relative expression of selected genes and to confirm their differential expression between strains, quantitative RT-PCR experiments were carried out on total RNA extracted from EAF-S and CB-R snails (Figs 3 and 4). The transcripts corresponding to cluster numbers 4, 6, 10, 11, 20, 22, 25–27, 33, 40 and 41 of the EAF-S library were not detected, nor the cluster numbers 7–9 of the CB-R library. These results show that the SSH approach was successful. Indeed, 80% of the transcripts corresponding to EAF-S clusters display a higher concentration in EAF-S strain as compared to the CB-R strain and the relative expression ratio is greater than 2·5-fold for 60% of them (Fig. 3). For the CB-R library, 100% of the clusters are over-expressed in the CB-R strain and 70% of them displayed a relative expression ratio greater than 2·5 fold (Fig. 4). All these differences are statistically significant (P<0·05).

Fig. 3. Transcript ratios corresponding to selected clusters of the EAF-S library in whole body susceptible EAF-S snails (light boxes) and resistant CB-R snails (dark boxes). Ratios were determined using real-time quantitative PCR and are expressed relative to S19 expression levels (ratio/S19). Each histogram is the average value (±S.D.) of 3 independent experiments each performed in duplicate. Differential transcription levels between strains are indicated above the histograms. Since transcription levels can differ by up to 2 orders of magnitude, 3 different graphs were used for sake of clarity. *Genes showing differences in transcript levels that were significant (P<0·05) and higher than 2·5-fold.

Fig. 4. Transcript ratios corresponding to selected clusters of the CB-R library in whole body susceptible EAF-S snails (light boxes) and resistant CB-R snails (dark boxes). Ratios were determined using real-time quantitative PCR and are expressed relative to S19 expression levels (ratio/S19). Each histogram is the average value (±S.D.) of 3 independent experiments each performed in duplicate. Differential levels of the transcripts between strains are indicated above the histograms. Since transcription levels can differ by up to 2 orders of magnitude, 3 different graphs were used for sake of clarity. *Genes showing differences in transcript levels that were significant (P<0·05) and higher than 2·5-fold.
The EAF-S clusters displaying the more significant differences (transcript concentration 2·5-fold higher in EAF-S snail, Fig. 3) correspond to (i) proteases (cluster 3 and 5) and cell adhesion molecules (cluster 9 and 12), both included in the immunity class, (ii) CaBPs (cluster 14–16), (iii) carbohydrate hydrolytic enzymes like mannanases (cluster 21 and 23) and a glucanase (cluster 24), (iv) transport proteins (cluster 28 and 29) and (v) proteins involved in cholesterol homeostasis (cluster 30–32).
Regarding the CB-R library, the clusters displaying the most significant differences (transcript concentration 2·5 fold higher in CB-R snail, Fig. 4) correspond to putative proteins all belonging to the immunity class: an antimicrobial protein (Bg Aplysianin-A like, cluster 1), a protease (Bg coagulation factor V like, cluster 2), protease inhibitors (Bg serpin like 3 and Bg serpin like 3, cluster 3 and 4, respectively) and a pattern recognition receptor (Bg C-type lectin like, cluster 5).
In order to further investigate the putative function of these different clusters of interest, similarities were analysed in conjunction with conserved deduced domains in the corresponding proteins (Tables 3 and 4 for EAF-S and CB-R, respectively). For example, cluster 3 (Table 3) displays similarities for the cathepsin L of the sea urchin Strongylocentrotus purpuratus and the domain corresponding to this class of protease (peptidase C1A subfamilly) was detected in the deduced amino acid sequence of this cluster. Consequently, the cluster 3 was named Bg cathepsin L-like. Another example of interest, cluster 5 (Table 4) displays similarities for the lectin 1 of the planaria Girardia tigrina (Shagin et al. 2002). The deduced amino acid sequence from this cluster presents a C-type lectin domain. This protein was called Bg C-type lectin like. An extensive analysis of the deduced amino acid sequence also revealed 2 groups of 3 residues which are known to be involved in calcium binding and carbohydrate binding. One of these groups of residues (EPN) suggests that the molecule identified in this study could be a mannose-binding lectin. The same procedure was applied to all the clusters.

DISCUSSION
In order to investigate the molecular basis of susceptibility/resistance in the B. glabrata/E. caproni model, several molecular approaches were undertaken to compare susceptible and resistant snail strains (Vergote et al. 2005; Bouchut et al. 2006a,b). These studies focused principally on haemocytes and humoral factors which have been shown to play key roles in the susceptibility/resistance process (Ataev and Coustau, 1999). Regarding humoral factors, the proteomic approach revealed several proteins differentially represented in the plasma of susceptible and resistant snails (Vergote et al. 2005). They corresponded to 2 isoforms of a glycolytic enzyme (endo-1,4-β-mannanase 1 and -2), 2 isoforms of a calcium-binding protein (Bg CaBP-1 and -2) and an inhibitor of cysteine protease (Bg type-2 cystatin). All these proteins are expressed in the albumen gland (Vergote et al. 2005). Regarding haemocytes, we developed 2 molecular approaches based on the comparison of transcript and protein expression in haemocytes of both strains. The first transcriptomic approach focused on genes involved in adhesion processes and revealed 4 transcripts which were differentially represented between haemocytes from resistant and susceptible snails (Bouchut et al. 2006a). These genes encode 2 dermatopontin-like proteins, a matrilin-like and a cadherin-like protein. The same study (Bouchut et al. 2006a) also revealed different expression levels in whole snails of different genes potentially involved in extracellular matrix (ECM) structuring or coagulation. A second approach we developed aimed at identifying proteins differentially represented in haemocytes of the 2 strains. This study (Bouchut et al. 2006b) revealed an aldolase, an intermediate filament protein, a cytidine deaminase.
In the present work, we used another molecular comparative method termed SSH to identify transcripts differentially expressed between the 2 mollusc strains of interest. This approach was performed on entire snails in order to investigate the potential involvement of genes expressed in other snail tissues. This approach revealed several genes identified in the above-mentioned studies but also new candidates belonging to novel functional groups of interest.
The functional groups of – glycolytic enzymes and calcium-binding proteins (CaBP) – were identified in the present work but also in plasma of B. glabrata as previously shown (Vergote et al. 2005). Bg endo-1,4-β-mannanase 1 was found in both cases. In addition, a novel isoform of the same family of proteins, the Bg endo-1,4-β-mannanase 3 was identified in the present study. In both works, the transcripts corresponding to these enzymes were over-represented in susceptible snails. This type of glycosidase randomly cleaves within the β-1,4-mannan main chain of galactomannan, glucomannan, galactoglucomannan and mannan. In the present work another glycolytic enzyme, named Bg endo-1,4-β-D-glucanase like 1, was revealed. Bg endo-1,4-β-D-glucanase like 1 transcripts were also over-represented in susceptible snails. These data taken together reinforce the previously presented hypothesis that glycolytic enzymes could be involved in the B. glabrata/E. caproni interactions (Vergote et al. 2005).
For the functional group corresponding to CaBP, a similar situation is observed. Indeed, the comparative proteomic approach developed on plasma revealed an over-representation of transcripts and proteins of plasmatic CaBP (Bg CaBP-1 and Bg CaBP-2). In the present study, 3 novel members of this protein family were identified (Bg CaBP-3, -4 and Bg DEC-3) and their transcripts are also over-expressed in susceptible snails. Regarding links between differential representation of these molecules and susceptibility/resistance, a possibility is that these proteins could be involved in regulation of adhesion processes as described in a previous study (Vergote et al. 2005).
Regarding novel functional groups of interest, the most promising candidates identified in the present study belong to immunity class. Some of them were characterized from the EAF-S library. The first functional group of interest identified in this library contains several proteases showing a higher expression in EAF-S snails: Bg cathepsin L like and Bg serine protease beta like 1. One attractive hypothesis is that a higher content in proteases could facilitate the parasite settlement in EAF-S snails. Indeed, as an alternative to produce their own proteases, some parasites (like pathogenic bacteria) can use proteases produced by host and turn them to their own advantage to facilitate invasion and dissemination (Armstrong, 2006). In addition, clusters corresponding to cell adhesion proteins were characterized from the EAF-S library. Two of them presented higher transcript levels in EAF-S snails. The first molecule, named Bg DEC-1 like, displays high similarities for a gene DEC-1 (dextral enriched clone-1) identified from the snail Lymnaea stagnalis (Harada et al. 2004). This molecule possesses chitin binding and von Willebrand type A (vWA) domains, suggesting a putative involvement in adhesion processes. The higher representation of this kind of molecule in susceptible snails can be linked to results obtained in a previous study (Bouchut et al. 2006a). In this last work, a series of genes encoding proteins containing vW domains potentially involved in coagulation processes have been shown to be more expressed (higher transcript level) in EAF-S snails. This led to the hypothesis that susceptible snails could possess a more potent collagen-independent filamentous network which could prevent haemocyte migration towards the parasite larvae and therefore facilitate parasite settlement in susceptible snails (Bouchut et al. 2006a). The second adhesion molecule, named Bg ependymin like, displays similarities for mammalian ependymin related proteins (MERPs). Ependymin was originally identified in the ependymal zone of goldfish brain and is a constituent of the extracellular matrix. Ependymins may be involved in cell contact mechanisms through anti-adhesive properties (Hoffmann and Schwarz, 1996). These anti-adhesive molecules could play a key role in establishing specific cell contacts during neural regeneration, differentiation and cell migration (Nimmrich et al. 2001). MERPs genes have been shown to be expressed at high levels in several haematopoietic cell lines as well as in non-haematopoietic tissues such as brain, heart, and skeletal tissues and by malignant tissues and malignant cell lines. This broad tissue distribution suggests a role for this MERP protein in processes that are important in many other types of cells and tissues (Apostolopoulos et al. 2001). The Bg ependymin-like transcript we identified in this study is over-represented in EAF-S snails. This candidate gene could be of potential interest in our system considering its putative involvement in anti-adhesive processes. The higher expression of these molecules and their associated anti-adhesive properties could prevent parasite encapsulation in EAF-S snails. Further studies investigating the tissue expression of the Bg ependymin-like should be developed in order to test this hypothesis.
Several other novel clusters identified from the EAF-S library and belonging to another class (energy, metabolism and hydrolytic enzymes) also display a transcript content that are superior in EAF-S snails. These clusters correspond to functional groups like transport (Bg haemoglobin and Bg fatty acid binding protein) and cholesterol homeostasis (cluster 30–32). Considering their putative function, it is difficult to speculate on the potential role of these genes in our system.
Regarding genes identified from the CB-R library, several genes potentially involved in immune processes were also identified. Among them, we identified a cluster displaying similarities for a defence factor Aplysianin A purified from the albumen gland of Aplysia kurodai (Takamatsu et al. 1995). This glycoprotein inhibited the growth of both Gram-positive and Gram-negative bacteria. Another study developed in Aplysia punctata has evidenced a molecule called APIT (A. punctata ink toxin) displaying about 60% identity with Aplysianin A (Butzke et al. 2005). APIT is an L-amino acid oxidase, which produces hydrogen peroxide and was shown to lead to necrosis-like oxidative damage of Jurkat-T eukaryotic cells. The Bg Aplysianin A-like we identify in this study could be a defence factor involved in the anti-parasitic response of B. glabrata. Its higher abundance in CB-R snails could explain the efficiency of the resistant snail response against E. caproni. Further studies investigating its biological activity and tissue localization could help to strengthen this hypothesis.
The second gene of interest identified from the CB-R library is a transcript encoding a C-type lectin, we called Bg C-type lectin-like. This molecule displays an amino acid motif which suggests mannose-binding capabilities. The majority of C-type lectins characterized in invertebrates are humoral sugar-binding proteins with a demonstrated or suggested involvement in pathogen-associated molecular pattern recognition (e.g. from mollusc (Yuasa et al. 1998), crustaceans (Luo et al. 2003), flat worm (Duclermortier et al. 1999) and nematode (Loukas et al. 1999)). The putative function of this protein of B. glabrata and the over-abundance of the corresponding transcripts in CB-R snails suggest a potential involvement of this gene in resistance. Future functional studies should be developed to evaluate this putative role.
Finally, several clusters corresponding to protease inhibitors were characterized from the CB-R library. This kind of molecule often plays a crucial role in anti-parasitic defence. Two serpin-like molecules were identified from the CB-R library. Serpins (serine protease inhibitors) are protease inhibitors that are capable of inactivating and clearing the proteases involved in parasitic invasion and thus, that are an important component of the armamentarium of the immune system to counter parasitic invasion (see Armstrong (2006) for review). Because proteases constitute one of the important classes of virulence and survival factors, the host has developed inhibitors of proteases which have evolved as important elements in the system of host defences against pathogens and as regulators of endogenous proteases. Inactivation of the secreted proteases of pathogens has the potential to restrict the steps of invasion and dispersal in the internal milieu, and parasite-mediated inactivation of other elements of host immunity. In invertebrates such as arthropod (see Kanost (1999) for review), serpins are likely to function in protecting their hosts from pathogens or parasites and thus play several roles in immunity: protection against microbial proteases, regulation of endogenous proteases involved in cascade responses against pathogens, haemolymph coagulation, phenoloxidase activation and proteolytic cytokines activation. Recently, a mosquito serpin, Anopheles stephensi SRPN6, has been found to be strongly implicated in the innate immune response against Plasmodium by RNA interference (Abraham et al. 2005). AsSRPN6 knockdown significantly increased the number of developing parasites, which suggests that AsSRPN6 could be involved in the parasite killing process. Higher abundance of 2 serpin-like molecules in CB-R snails and the putative function of these molecules make them very attractive candidates in our system. Future functional studies have to be applied to verify their potential interest.
In conclusion, this SSH approach has been successful in identifying new transcripts that were differentially represented in E. caproni-susceptible and resistant B. glabrata. Similarities of the corresponding genes provided informative data on the potential functions of these proteins. According to these predicted functions, various assumptions can be made on their potential involvement in susceptibility/resistance processes. Future functional studies are needed to clarify the role of these genes in the host-parasite interaction.
This work was supported by the CNRS. We are grateful to Pierre Tisseyre (FR2577 CNRS) for performing DNA sequencing. We are indebted to Frédéric Chevalier and Lidwine Ambengat for technical assistance.