Implications
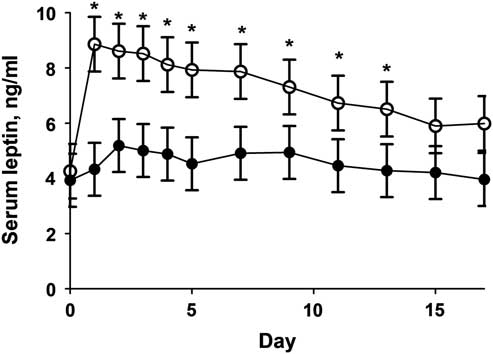
The interrelationship between circulating cortisol and leptin in newborn ruminants has not been explored. Occurrence of increased serum cortisol in animals with altered leptin concentrations has been noted. From the current study, if glucocorticoid concentrations are increased for the first 2 days of life, there is a significant reduction of serum leptin that persist up until day 13. From this study, increased cortisol reduced secretion of leptin in newborn calves that could lead to alterations in the development of the appetite centers of the hypothalamus.
Introduction
In the beef cattle industry, many variables affect profitability of a cow calf operation. The many costs associated with maintaining a cow calf operation and subsequent finishing of animals in a feedlot must be offset by the animals’ performance. Perhaps one of the most important variables impacting performance is feed efficiency. Cattle can be genetically selected for increased feed efficiency, however, selecting for increased residual feed intake has the potential to negatively influence other production traits. Manipulation of the appetite center in the hypothalamus using exogenous glucocorticoid administration could increase feed efficiency without negating other valuable genetic traits. The appetite center of the hypothalamus is programmed by a postnatal leptin surge responsible for the development of energy-regulation circuits (Yura et al., Reference Yura, Itoh, Sagawa, Yamamoto, Masuzaki, Nakao, Kawamura, Takemura, Kakui, Ogawa and Fujii2005). Cattle exhibit this surge from about 1 to 4 days of life (Long and Schafer, Reference Long and Schafer2013). In sheep, a disruption in this profile results in increased appetite and weight gain when subjected to a feeding trial (Long et al., Reference Long, Ford and Nathanielsz2011 and Reference Long, Smith, Ford and Nathanielsz2013). Disruption of leptin profiles can be induced through maternal overnutrition or glucocorticoid administration. In both of these scenarios, the disruption of the leptin profile coincides with a high circulating cortisol level (Long et al., Reference Long, Ford and Nathanielsz2011 and Reference Long, Smith, Ford and Nathanielsz2013). This study hypothesized that administration of exogenous hydrocortisol sodium succinate in calves after parturition will suppress postnatal serum leptin concentrations.
Material and methods
Animals and sample collection
Angus and Angus crossbred cows (n = 31) of similar age, parity and body condition score (BCS) were selected for this study. Cow BCS ranged from 5 to 7.5 with age ranging from 3 to 12 years old. Cows were confirmed pregnant to natural service to one of three sires and allowed to calve naturally. Dam BCS was determined by the same trained individual 24±4 days before parturition. At birth, calves were allotted into treatment groups based upon gender, age of dam, sire and BCS of dam.
Within 4 h of parturition, calf BW was determined via a hoof circumference measuring tape (Calfscale Company, Ames, IA, USA). Blood samples were collected using 6 ml blood collection syringes (Starstedt, Newton, NC, USA) via jugular vein at BW determining and before infusion. Calves were then given an intravenous infusion of either hydrocortisol sodium succinate (Solu-Cortef; Pfizer, NY, USA; HC) or sterile saline (CONT) depending upon treatment group. Dosage of HC and CONT was based on calf BW, where calves received 3.5 μg/kg of hydrocortisol sodium succinate (HC, 8 females and 8 males) or a similar volume (between 5 and 8 ml) of sterile saline for CONT (8 females and 7 males). At 24±4 h of age, a second blood sample was taken and each calf received a second intravenous infusion of either CONT or HC at a dosage of 1.5 μg/kg of BW of (HC) or a similar volume of sterile saline for CONT. This dose was chose to mimic the cortisol concentrations reported in Tipton et al (Reference Tipton, Ricks, LeMaster and Long2018). Additional blood samples were collected daily at 0600 h from days 2 to 5, then every other day from days 7 to 17. All samples were allowed to clot at room temperature for approximately 1 h then refrigerated at 4°C for 18 to 24 h. Blood samples were centrifuged at 2000×g for 20 min at 4°C and then serum was decanted. Serum samples were frozen at −20°C until analysis. All male calves were castrated at day 17 of age following blood collection. Calf BW were collected every month using a scale mounted under a squeeze chute and adjusted to days 60, 90, 120 and 150 BW using standard Beef Improvement Federation guidelines (2010) without using the age of dam adjustments.
Biochemical assays
Serum cortisol concentrations were determined using a previously validated Coat-A-Count cortisol RIA (Siemens Medical Solutions Diagnostics, Los Angeles, CA, USA; Long and Schafer, Reference Long and Schafer2013) with a sensitivity of 5 μg/dl. All samples were analyzed in duplicate in multiple assays (n = 3). The intra-assay and inter-assay CV were 3.4% and 5.7%, respectively. Serum leptin concentrations were analyzed in duplicate using previously validated radioimmunoassay (RIA) (Linco Research, St. Charles, MO, USA; Long and Schafer, Reference Long and Schafer2013), with a sensitivity of 0.5 ng/ml in three assays blocks; With an intra-assay and inter-assay CV of 3.7% and 4.1%, respectively.
Statistics
Maternal age, BCS and calf birth weight were analyzed as an ANOVA using the MIXED procedure of SAS (SAS Institute Inc., Cary, NC, USA) with treatment, sex and their interaction included in the model. Individual calf was used as the experimental unit for hormone concentrations and BW gain. Leptin and cortisol concentrations during infusion (days 0 to 1) and post-infusion (days 2 to 4) were analyzed using the MIXED procedure of SAS with treatment, day and their interaction in the model. Dam age, BCS, calf sex and birth weight was initially included in the model but was found to be non-significant P < 0.36 and was removed from the final model. Calf BW from days 60 to 150 of age was analyzed as repeated measures using the MIXED procedure with treatment, day, sex and their two-way interactions. The three-way interaction was found to be non-significant (P = 0.87) and was removed from the final model. Data are presented as least square means±SEM and considered significantly different when P⩽0.05 and a tendency was indicated when P⩽0.10.
Results
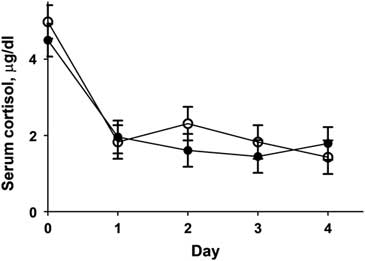
Dam age was not different (P = 0.81) between treatment groups (4.7±0.5 and 4.9±0.5 years, CONT and HC, respectively). There was no difference in birth weight between treatments (P = 0.87), with CONT calves weighing 38.0±1.4 kg and HC calves weighing 38.5±1.4 kg. Dam BCS was not different between groups (5.6±0.2 and 5.7±0.2 units CONT and HC, respectively; P = 0.66). There was no difference in serum cortisol between CONT and HC calves (Figure 1). It should be noted that the exogenous cortisol utilized for infusions (hydrocortisol sodium succinate) had only a 4% binding to our RIA assay as determined by spiking with 50 and 100 µg of hydrocortisol sodium succinate into previously assayed samples (n = 20). Calves from HC group had significantly reduced (P = 0.03) serum leptin concentrations on days 1 to 13 (Figure 2). Serum leptin concentrations were not different between groups at days 0, 15 and 17. Calf BW was not different (P = 0.65) on days 60, 90, 120 and 150 between treatments (Table 1).
Serum cortisol concentrations of calves receiving either 3.5 μg/kg of birth weight of hydrocortisol sodium succinate (HC, closed circles) or sterile saline (CONT, open circles) at birth and 1.5 μg/kg of birth weight at 24 h of life. Data are presented as least square means±SEM. Treatment P = 0.23, day P < 0.001, treatment×time P = 0.14.

Serum leptin concentrations of calves receiving either 3.5 μg/kg of birth weight of hydrocortisol sodium succinate (HC, closed circles) or sterile saline (CONT, closed circles) at birth and 1.5 μg/kg of birth weight at 24 h of life. Data are presented as least square means±SEM. Treatment×time P = 0.03.*Means differ within a time point (P < 0.05).

Calf BW in kilogram of calves receiving either 3.5 μg/kg of birth weight of hydrocortisol sodium succinate (HC) or sterile saline (CONT) at birth and 1.5 μg/kg of birth weight at 24 h of life

Overall P values: treatment P = 0.65, sex P = 0.52, Day P < 0.0001, treatment × day P = 0.19, treatment × sex P = 0.36, treatment × sex × day P = 0.585.
Discussion
To the authors’ knowledge, this is the first example of administration of exogenous cortisol suppressing postnatal leptin levels in beef calves. The HC group displayed significantly reduced leptin levels on days 1 to 13 of age when compared to CONT calves. One study examined the effects of dexamethasone on newborn dairy calves found little differences in plasma leptin concentrations. The dosage used in this study was 15 μg/kg of birth weight injected intramuscularly on postnatal days 1 to 4 (Blum et al., Reference Blum, Zbinden, Hammon and Chilliard2005). Compared with our present study, there is an increase in dosage and length, but also an increase in potency of glucocorticoid used. The potency of dexamethasone to cortisol has been reported to be as high as 25 times more potent (Sloboda et al., Reference Sloboda, Challis, Moss and Newnham2005). Hydrocortisol sodium succinate was used in our study because it has a similar potency to endogenous cortisol. The timing and dosage of our infusions, on days 0 and 1 of life, were designed to be similar to the timing of increased cortisol seen in beef calves that also had their leptin profiles disrupted by maternal nutrient restriction in late gestation (Tipton et al., Reference Tipton, Ricks, LeMaster and Long2018).
Leptin and cortisol values were not influenced by dam age, BCS, calf sex or birth weight. This conflicts with findings by Long and Schafer (Reference Long and Schafer2013), as they found bull calves to have a higher plasma leptin concentration than heifer calves. However, our study had a sample size of 31 multiparous cows, while Long and Schaefer used 12 nulliparous cows. There could be difference between nulliparous and multiparous beef dams that could attribute to the differences in studies.
A distinct natural increase in cortisol concentrations occurs in precocial species just before parturition. Previous studies have examined the relationship between glucocorticoids and leptin. One group observed that lambs born with high plasma cortisol levels due to maternal overnutrition also displayed a suppressed leptin peak (Long et al., Reference Long, Ford and Nathanielsz2011). Other studies have examined the effects of synthetic glucocorticoids, such as dexamethasone, on the postnatal leptin profile. A multigenerational sheep model examined the effects of dexamethasone administration to ewes at 103 and 104 days of gestation. The F2 female offspring of these ewes displayed leptin levels that were significantly reduced from days 2 to 4 of life when compared with control animals, likely because of an increase in cortisol (Long et al., Reference Long, Smith, Ford and Nathanielsz2013).
Leptin plays a vital role in the development of the appetite center during neuronal development. Timing of leptin exposure to certain areas of the brain is believed to be critical to the animal’s life-long ability to regulate appetite. This leptin peak is necessary for development of projection pathways in the hypothalamus. Leptin-deficient mouse pups display a much smaller density of axons emitting from the arcuate nucleus to other areas of the hypothalamus when compared to wild-type mice (Bouret et al., Reference Bouret, Draper and Simerly2004). These effects lasted through adulthood, but could be reversed if the pups were given supplemental leptin during neonatal period (Bouret et al., Reference Bouret, Draper and Simerly2004). The neurotrophic effects of leptin have been studied in an explant model. Low birth weight rat pups displayed reduced neurons and astrocytes in the hypothalamic region when compared to samples from control animals. These neuron explants were also subjected to leptin treatment, and neuronal progenitor cells proliferated in a dose-dependent manner. This proliferation was decreased in samples taken from low birth weight animals, likely because they had not been properly exposed to leptin (Desai et al., Reference Desai, Li and Ross2011). The timing of this leptin elevation differs between precocial and altricial species. Precocial species such as sheep and cattle display elevated postnatal leptin levels around days 1 to 4 and days 6 to 9, respectively (Long et al., Reference Long, Ford and Nathanielsz2011). This transient rise in leptin has been altered in previous studies. It has been demonstrated that lambs born to obese dams do not exhibit normal leptin profile; as the characteristic peak is not present (Long et al., Reference Long, Ford and Nathanielsz2011).
The HC calves and CONT calves did not display a difference in BW up to weaning, however, these animals were never subjected to ad libitum feeding. It has been previously shown that heifers born to dams that were nutrient restricted for the last 100 days of gestation displayed a reduced postnatal leptin profile, increased BW gain, and increased appetite when subjected to a feeding trial as yearlings (Tipton et al., Reference Tipton, Ricks, LeMaster and Long2018). These heifers also displayed increased adipose depots, leptin resistance and glucose dysregulation. These parameters were not analyzed in our study, indicating that further research is necessary to determine the life-long impacts of postnatal leptin disruption on metabolism in beef calves. This information could be potentially useful in the beef industry, as a higher turnover rate would be financially advantageous to producers. Currently, cattle in the United States spend anywhere from 90 to 300 days in a feedlot, averaging 140 days (United States department of Agriculture (USDA), 2016). The amount of time spent in a feedlot is contingent upon the animal’s weight when entering the finishing phase, as well as average daily gain. In the United States, average gain in a feedlot is 1.1 to 1.8 kg/day with about 6 kg of dry matter/kg of gain (USDA, 2016). Decreasing the amount of time it would take for an animal to reach its finishing weight would reduce producer’s cost. An increase in growth rate, appetite and feed efficiency by reducing days on feed would potentially allow increased efficiency.
Acknowledgements
Preliminary results have been published in an abstract form Lewis et al. (Reference Lewis, Ricks and Long2016).
Declaration of interest
The authors report no conflicts of interest with any of the data presented.
Ethics statement
All procedures were approved by Clemson University’s Institutional Animal Care and Use Committee (AUP #2016-005).
Software and data repository resources
None of the data were deposited in an official repository.