


 for the substrate
 comparable with AKs from other organisms. Sequence analysis revealed high amino acid sequence identity between A. suum AK and other nematode AKs, all of which cluster in a phylogenetic tree. However, comparison of gene structures showed that A. suum AK gene intron/exon organization is quite distinct from that of other nematode AKs. Phosphagen kinases (PKs) from certain parasites have been shown to be potential novel drug targets or tools for detection of infection. The characterization of A. suum AK will be useful in the development of strategies for control not only of A. suum but also of related species infecting humans.
Introduction
Phosphagen kinases (PKs) catalyse the reversible transfer of the phosphoryl group of ATP to naturally occurring guanidine compounds in the presence of Mg2+. These enzymes play key roles in ATP buffering systems in animal cells that experience high and variable rates of ATP turnover (Ellington, Reference Ellington2001). PK activity is important in muscle contraction and for the generation of ATP needed for the onset of rapid motility prior to availability of ATP derived from glycolysis (Brown & Grossman, Reference Brown and Grossman2004). Based on the guanidine substrate used, members of this family of enzymes are classified as follows: creatine kinase (CK), glycocyamine kinase (GK), thalessemine kinase (ThK), taurocyamine kinase (TK), hypotaurocyamine kinase (HTK), lombricine kinase (LK), opheline kinase (OK) and arginine kinase (AK) (Morrison & James, Reference Morrison and James1965; Thoai, Reference Thoai, Thoai and Roche1968; Watts, Reference Watts, Thoai and Roche1968).
AK exists widely in organisms such as arthropods, protozoa and nematodes (Claudio et al., Reference Claudio, Guillermo, Cristina, Adolfo, Laura, Hector and Mirtha2000; Pereira et al., Reference Pereira, Alonso, Torres and Flawia2002; Wickramasinghe et al., Reference Wickramasinghe, Uda, Nagataki, Yatawara, Rajapakse, Watanabe, Suzuki and Agatsuma2007) and bacteria (Logan et al., Reference Logan, James, Mark and Dean2008). Meanwhile, CKs have been discovered in many vertebrates, including humans (Robert et al., Reference Robert, Arnold and Joseph1988), and in Cnidaria, Annelida (Matsushima et al., Reference Matsushima, Uda, Ishida, Kokufuta, Iwasaki and Suzuki2006), Echinodermata (Robert & Bennett, Reference Robert and Bennett1987) and Porifera (Ellington, Reference Ellington2000). In vertebrates, CK is the sole phosphagen kinase (Ellington, Reference Ellington2001; Tanaka et al., Reference Tanaka, Ichinari, Iwanami, Yoshimatsu and Suzuki2007). On the other hand, GKs, TKs, LKs and OKs are chiefly identified in Annelida.
The pig round-worm, A. suum is distributed worldwide and is also an economically important parasite that infects domestic swine (Crompton, Reference Crompton1999). Prevalence of A. suum in pigs in southern Kyushu in Japan can reach 30% (Tokojima et al., Reference Tokojima, Ashitani and Nakazato2004). Ascaris suum is also a significant zoonotic parasite causing visceral larva migrans (VLM) in humans (e.g. Sakakibara et al., Reference Sakakibara, Baba, Niwa, Yagi, Wakayama, Yoshida, Kobayashi, Yokoi, Hara, Itoh and Kimura2002; Kakihara et al., Reference Kakihara, Yoshimitsu, Ishigami, Irie, Aibe, Tajima, Shinozaki, Nishie, Nakayama, Hayashida, Nakamuta, Nawata and Honda2004). The signs and symptoms of VLM include eosinophilic leucocytosis, cough, fever and multiple lesions of lung and liver, and may lead to a mis-diagnosis of pneumonia (Tokojima et al., Reference Tokojima, Ashitani and Nakazato2004). Since it is extremely difficult to detect larvae from patients because of the rapid migration of the small worms, an enzyme-linked immunosorbent assay (ELISA) inhibition test would be useful for detection of VLM (Sakakibara et al., Reference Sakakibara, Baba, Niwa, Yagi, Wakayama, Yoshida, Kobayashi, Yokoi, Hara, Itoh and Kimura2002). Wickramasinghe et al. (Reference Wickramasinghe, Yatawara, Nagataki, Takamoto, Watanabe, Rajapakse, Uda, Suzuki and Agatsuma2008) suggested that Toxocara canis AK could be exploited for immunological diagnosis of human toxocariasis. It has been suggested that cockroach AK is a kind of cockroach allergen (Sookrung et al., Reference Sookrung, Chaicumpa, Tungtrongchitr, Vichyanond, Bunnag, Ramasoota, Tongtawe, Sakolvaree and Tapchaisri2006) and an enzyme inhibition study has been performed for it (Brown & Grossman, Reference Brown and Grossman2004). Moreover, PKs of helminth parasites could be utilized in the development of a new drug that targets only the energy metabolism catalysed by these enzymes. For instance, Trypanosoma cruzi AK has been suggested as a possible chemotherapy target for Chagas disease (Pereira et al., Reference Pereira, Alonso, Ivaldi, Silber, Alves, Torres and Flawia2003b) and substrate analogue inhibition studies have been performed for this enzyme (Pereira et al., Reference Pereira, Bouvier, Torres and Flawia2003a). As AKs are not found in vertebrates, studies have been performed to explore the potential of this enzyme as a drug target and diagnostic tool for certain human and animal parasites and for the control of insect pests.
In the present study, we determined the cDNA sequence of the AK from A. suum. Recombinant A. suum AK was also expressed and the enzyme activity was measured. In addition, site-directed mutagenesis of amino acid residues was performed to identify the residues necessary for substrate binding, and evolutionary analysis of the genomic DNA was performed.
Materials and methods
RNA extraction, mRNA purification and cDNA synthesis of A. suum arginine kinase
Total RNA was extracted from an adult worm of A. suum collected from Kochi, Japan using an acid guanidinium thiocyanate–phenol–chloroform extraction method described by Chomczynski & Sacchi (Reference Chomczynski and Sacchi1987). Then mRNA was isolated using a Poly(A)+ Isolation Kit (Oligotex™d30, Nippon Gene, Tokyo, Japan). The cDNA was synthesized with Ready-To-Go You-Prime First-Strand Beads (Amersham Pharmacia Biotech, New Jersey, USA) and an oligo-dT primer including SmaI and BamHI sites (5′-CCCGGGATCCT17VN-3′).
cDNA amplification and sequence determination of A. suum arginine kinase
The following specific primers were designed from the sequence of A. suum PK obtained from NEMBASE3 (http://www.nematodes.org/nembase3/index.shtml): Asuum PKF1 (5′-CGTATGGCTTTTCTGAAGAA-3′) and Asuum PKR1 (5′-CGAACTAGGTTTTACTGACG-3′). Polymerase chain reaction (PCR) was performed with Takara Ex Taq™ (Takara, Kyoto, Japan) and PCR conditions were as follows: initial denaturation at 94°C for 2 min, followed by 35 cycles of 94°C for 30 s, annealing at 50°C for 35 s and extension at 72°C for 2 min and a final extension at 72°C for 4 min. PCR was carried out in a T-personal Thermal Cycler (Biometra, Goettingen, Germany).
PCR products were purified with GeneClean 2 Kit (Funakoshi, Japan) and cloned into pGEM-T Vector System (Promega, Wisconsin, USA). Plasmid DNA was purified from positive clones using the alkaline sodim dodecyl sulphate (SDS) method. Nucleotide sequences were determined with an ABI PRISM 3130-Avant DNA sequencer using a BigDye Terminators v3.1 Cycle Sequencing Kit (Applied Biosystems, California, USA).
pMAL cloning and expression of A. suum arginine kinase
The complete open reading frame (ORF) of A. suum AK was amplified with the following primers having EcoRI and PstI sites: forward-AsuumPK5EcoRI (5′-AAGAATTCATGGCTTTTCTGAAGAATCAG-3′) and reverse- AsuumPK3PstI (5′-TTCTGCAGCTATTTCTCCTTCTCCTCCAG-3′). KOD+DNA polymerase (Toyobo, Osaka, Japan) was used for amplification and dATP was added to the 3′ end of the blunt-ended PCR products. The ORF was then cloned into the EcoRI/PstI sites of pMAL-c2X (New England Biolabs, Massachusetts, USA). The maltose binding protein (MBP)–A. suum AK fusion protein was expressed in Escherichia coli TB1 cells by induction with 1 mm isopropyl β-d-1-thiogalactopyranoside (IPTG) at 25°C for 24 h. The recombinant protein was extracted by resuspending and sonicating the cells in 5 × TE buffer (10mm Tris–HCl and 1mm EDTA, pH 8.0) and purified by affinity chromatography using amylose resin (New England Biolabs). SDS-polyacrylamide gel electrophoresis (SDS-PAGE) was performed to confirm the purity of the recombinant AK.
Enzyme assays of A. suum arginine kinase
Protein concentration was determined at 280 nm absorbance (0.77 AU at 280 nm in a 1 cm cuvette corresponds to 1 mg protein/ml). Enzyme activity was measured (UV/Visible Spectrophotometer 4300 Pro, Amersham Biosciences UK, Ltd, Little Chalfont, Bucks, UK) with an NADH-linked assay at 25°C (Morrison, Reference Morrison and Boyer1973) for the forward reaction (phosphagen synthesis) (Rosenthal et al., Reference Rosenthal, Dahlman and Robinson1977). The reaction mixture contained the following: 4.76 mm Tris–HCl (pH 8), 35.71 mm KCl, 11.90 mm Mg-acetate, 1.19 mm phosphoenolpyruvate made up in 100 mm imidazole/HCl (pH 7), 0.24 mm NADH made up in 100 mm Tris–HCl (pH 8), pyruvate kinase/lactate dehydrogenase (PK/LDH) (Roche, Basel, Switzerland) mixture made up in 100 mm imidazole/HCl (pH 7), 4.76 mm ATP made up in 100 mm imidazole/HCl (pH 7), appropriate concentration of guanidine substrate made up in 100 mm Tris–HCl. The reaction was started by adding 0.05 ml of recombinant enzyme. The initial velocity values were obtained by varying the concentration of guanidine substrate under fixed concentration of ATP. The  value was determined using nine different concentrations of the guanidine substrate. To determine the
 value, the above reactions were performed at four different concentrations of ATP (10 mm, 7 mm, 5 mm and 3 mm). All measurements were performed within 12 h from the start of purification.
The calculations for the kinetic constants were based on Michaelis–Menten kinetics; a Lineweaver–Burk plot was made and fitted by the least-squares method in Microsoft Excel or by fitting data directly according to the method of Cleland (Reference Cleland1967), using the software written by Dr R. Viola (Enzyme kinetics Programs, v. 2.0).
Site-directed mutagenesis of A. suum arginine kinase
The following amino acid substitutions were introduced in the template of pMAL/A. suum AK wild type (wt): Ala105 to Ser, Ser106 to Gly and Ala105Ser106 to SerGly. The mutations were introduced using KOD+DNA polymerase under the subsequent PCR conditions: initial denaturation at 94°C for 2 min, followed by 35 cycles of 94°C for 15 s, annealing at 60°C for 30 s and extension at 68°C for 9 min and a final extension at 72°C for 5 min. The primer sequences used were as follows: AscF106 (5′-AGCATTGGCGTCTACGCACCG-3′), AscF106StoG (5′-GGCATTGGCGTCTACGCACCGGAT-3′), AscR105 (5′-CGCGTCCAAGTTGAATACACC-3′), AscR105AtoS (5′-CGAGTCCAAGTTGAATACACCTGA-3′). PCR products were purified by QIA quick PCR purification column (Qiagen, GmbH, Hilden, Germany) and digested with DpnI. After blunting and phosphorylation, the DNA was self-ligated. Expression and enzyme assay of the mutated proteins were performed as described above.
Amplification of A. suum arginine kinase gene
Genomic DNA was extracted from an adult worm of A. suum using Easy-DNA™ Kit (Invitrogen, Carlsbad, USA). PCR was performed with Ex Taq™ polymerase (Takara) and primers which were constructed based on the ORF. PCR conditions were as follows: initial denaturation at 94°C for 2 min, followed by 35 cycles of 94°C for 30 s, annealing at 50°C for 30 s and extension at 72°C for 3 min and a final extension at 72°C for 4 min. The PCR products were purified, cloned in T-vector, and sequenced as described above.
Sequence and phylogenetic analyses of A. suum arginine kinase
Sequences were analysed using Sequence Scanner v. 1.0 (Applied Biosystems) and a plasmid Editor v.1.11 (http://www.biology.utah.edu/jorgensen/wayned/ape/). Alignment was performed using the program Clustal W (http://align.genome.jp/clustalw/) and analysed with Gene Doc (http://www.nrbsc.org/gfx/genedoc/index.html) and BioEdit sequence alignment editor (http://www.mbio.ncsu.edu/BioEdit/BioEdit.html). The neighbour-joining tree was constructed using MEGA 4.0 (Tamura et al., Reference Tamura, Dudley, Nei and Kumar2007).
Results
Determination of cDNA sequence, alignment and phylogenetic analysis of A. suum arginine kinase
The cDNA of A. suum AK was successfully amplified using reverse transcription PCR (RT-PCR). The cDNA consists of 1260 bp with untranslated regions of 3 and 54 bp at 5′ and 3′ ends, respectively. The ORF codes for a protein consisting of 400 amino acids with a calculated molecular mass of 45,341 Da and estimated isoelectric point (pI) of 7.11. The sequence was deposited in GenBank under the accession no. FJ807773.
Figures 1 and 2 are the alignment of the deduced amino acid sequence and neighbour-joining tree of A. suum AK with other phosphagen kinases, respectively. Ascaris suum AK shares 89% sequence identity with T. canis AK, 55–68% with Caenorhabditis AKs (nematodes), 57% with Trypanosoma AKs (protozoa), 40–55% with arthropod AKs, 46–48% with molluscan AKs, 37–38% with Schistosoma mansoni TKs (platyhelminth) and 33–34% with TKs, LK, GK and CKs. Two major clusters are evident: a CK cluster comprised of CKs, GK, LK and TKs and an AK cluster, nematode representatives of which are further distributed among two subgroups in the neighbour-joining tree (fig. 2). As the typical monomeric AK, A. suum AK is closely related to T. canis AK, other phytoparasitic nematode AKs, Caenorhabditis elegans AK3 and AK4. Meanwhile, the other subgroup contains Caenorhabditis AK1 and 2. Four lineages of AK have been discovered (including Sabellastarte AK in the CK group which was used for the exon/intron organization analysis as below) (Iwanami et al., Reference Iwanami, Iseno, Uda and Suzuki2009). The differences of role of AK isoforms have not been revealed. However, somewhat individual roles, such as the obvious actions of the isoenzymes MMCK – in cytosol – and MiCK – in intermembrane space – are expected (Valdur et al., Reference Valdur, Petras, Uwe, Marko, Andre and Theo2006; Olav & Johannes, Reference Olav and Johannes2007).
Amino acid sequence alignment of A. suum arginine kinase with other phosphagen kinases (PKs). These sequences were aligned by using Multiple Sequence Alignment (http://align.genome.jp/clustalw/) and adjusted in Gene Doc (http://www.nrbsc.org/gfx/genedoc/index.html). Black blocks represent the residues conserved in all PKs and grey blocks residues conserved in 80% of the PKs. The boxed region shows the guanidino-specific (GS) region.

Neighbour-joining tree for the amino acid sequence of phosphagen kinases. The tree was constructed by using the program in MEGA version 4. Numbers at the branching points represents the bootstrap values (1000 replications). All values were more than 70% with high reliability. Accession numbers of amino acid sequences of other PKs used in this study are as follows (http://www.ncbi.nlm.nih.gov/sites/entrez?db = pubmed): Caenorhabditis elegans (NP509217, NP492714, NP507054 and NP491057), Toxocara canis (ABK76312), Caenorhabditis briggsae (XP002645008 and XP002639545), Heterodera glycines (AAO49799 and AAP41028), Bursaphelenchus xylophilus (ACF74766 and ACF74767), Trypanosoma cruzi (AAC82390), Limulus polyphemus (P51541), Homarus gammarus (P14208), Penaeus monodon (AF479772), Manduca sexta (BE015529), Periplaneta americana (EU429466), Drosophila melanogaster (NM001104086 and AAS93705), Schistosoma mansoni (XP002571445), Crassostrea gigas (BAD11950), Liolophura japonica (BAA22871), Nautilus pompilius (BAA95594), Octopus vulgaris (BAA95609), Sepioteuthis lessoniana (AB042332), Riftia pachyptila (BAE16973), Eisenia fetida (BAA22872), Neanthes diversicolor (BAA33058), Homo sapiens muscle (AAC31758), Arenicola brasiliensis (BAE16474), Homo sapiens mitochondria (AAA98744), Torpedo californica (P04414), Torpedo marmorata (P00566), Anopheles gambiae (XP315641), Apis mellifera (XP393299), Sabellastarte indica (BAE16968).

Substrate specificity and kinetic parameters of A. suum arginine kinase
The purity of recombinant A. suum AK was confirmed on SDS-PAGE (fig. 3). The substrate specificity was determined by the significant activity for the substrate l-arginine with an NADH-linked enzyme assay (table 1).
SDS-PAGE of recombinant A. suum arginine kinase expressed as a fusion protein with maltose-binding protein (MBP) at various stages of the expression and purification processes. Lanes: M, protein marker; 1, supernatant after sonication IPTG( − ); 2, supernatant after sonication IPTG(+); 3, purified supernatant after affinity chromatography (A. suum AK+MBP).

Enzyme activity of A. suum arginine kinase for each guanidino substrate.
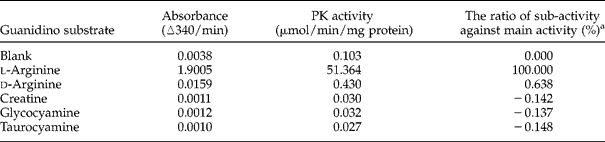
a The rate of sub-activity against main activity (%) = {[(PK activity) − 0.103]/(51.364 − 0.103)} × 100.
Table 2 shows the kinetic parameters of A. suum AK. In comparison with other AKs, the A. suum AK has the second highest affinity to l-arginine  among the available AKs (http://www.brenda-enzymes.info/) (data not shown). This value is comparable to that of T. canis AK which has the strongest affinity (0.12 mm) (Wickramasinghe et al., Reference Wickramasinghe, Uda, Nagataki, Yatawara, Rajapakse, Watanabe, Suzuki and Agatsuma2007). Ascaris suum AK also exhibits comparatively high synergism during substrate binding, as suggested by the K d/K m values (>1). There is evidence that first substrate binding (ATP) stabilizes the affinity with the second substrate (l-arginine) (Suzuki et al., Reference Suzuki, Tomoyuki and Uda2003) except for AKs in some insects (Tanaka et al., Reference Tanaka, Ichinari, Iwanami, Yoshimatsu and Suzuki2007). This structural change is correlated with hydrogen bonding between the Asp62 residue and Arg193 residue in Limulus polyphemus AK (Fujimoto et al., Reference Fujimoto, Tanaka and Suzuki2005). The
 value (0.511 mm) of A. suum AK was lower than the
 of AKs from molluscs (0.67–3.45 mm) (Suzuki et al., Reference Suzuki, Fukuta, Nagato and Umekawa2000a), arthropods (0.91–1.35 mm) (Rockstein & Kumar, Reference Rockstein and Kumar1972; Wu et al., Reference Wu, Li, Zhu and Wang2007) and annelids (0.8–4.2 mm) (Uda & Suzuki, Reference Uda and Suzuki2007), indicating that A. suum AK has high affinity for l-arginine in the absence of the second substrate, ATP. Comparison of k cat values showed that recombinant A. suum AK has lower k cat (45.9) compared to most of AKs from other sources. Excluding L. polyphemus AK (1059) (Azzi et al., Reference Azzi, Clark, Ellington and Chapman2004) and Drosophila melanogaster AK (684) (Wallimann & Eppenberger, Reference Wallimann and Eppenberger1973), A. suum AK is catalytically more efficient than other AKs, as suggested by its
 value (353).
Comparison of the kinetic properties of A. suum arginine kinase.

Comparison of kinetic constants and catalytic efficiencies of recombinant A. suum arginine kinase wild type and mutants
Substitution mutations were performed on amino acids located on the guanidino-specific (GS) regions that are found to be unique to A. suum AK based on sequence alignment (fig. 1). These mutations were A105S, S106G and AS105–106SG; the substituted amino acids are conserved in other AKs. The substrate specificity of the constructed mutants towards l-arginine did not change (data not shown).
Comparison of the affinities, activities and catalytic efficiencies are shown in fig. 4. A105S has 18.2% higher affinity for l-arginine than the wild type (WT). The k cat value of S106G mutant has decreased by only 1.7% and remained comparable to that of the WT. However, the overall catalytic efficiency values  for the said mutants were decreased either because of much lower k cat or higher
 (fig. 4). Moreover, in AS105–106SG, both of the parameters (27.8% decline in the affinity and 5.5% in the k cat) resulted in lower catalytic efficiency (32.8% decline) (fig. 4). The kinetic parameters of A. suum AK mutants indicate that the wild type remains catalytically efficient, even though the amino acids serine and glycine, proposed to be essential in binding of arginine, are not conserved.
Comparison of the kinetic parameters among A. suum arginine kinase wild type and mutants. Percentages of (a) affinity with l-arginine (1/ ), (b) arginine kinase activity (k cat) and (c) catalytic efficiency
 in A. suum AK mutants compared to the wild type, on the presumption that the wild type is 100%. WT, wild type.

Signal peptide and protein localization of A. suum arginine kinase
In order to determine if a signal-targeting peptide exists in A. suum AK which has ~50 more amino acids at the N-terminal in comparison with ordinal PKs, except for Bursaphelenchus xylophilus AK2 (fig. 1), the N-terminus sequences including the 35 PKs in fig. 2 were analysed using various independent computer programs (table 3). Signal peptides were detected only in eight PKs, such as A. suum AK, Caenorhabditis briggsae AK1, Heterodera glycines AK2 and other previously reported PKs (Uda et al., Reference Uda, Fujimoto, Akiyama, Mizuta, Tanaka, Ellington and Suzuki2006; Wickramasinghe et al., Reference Wickramasinghe, Uda, Nagataki, Yatawara, Rajapakse, Watanabe, Suzuki and Agatsuma2007). All of the programs judged A. suum AK to have a signal-targeting peptide and both SOSUI signal and SignalP programs identified the cleavage site at the twenty-third amino acid position of the N-terminal extension. Two programs predicted A. suum AK to be extracellular, and the rest suggested it to be either associated with endoplasmic reticulum or mitochondria or part of a secretory pathway. In contrast, the majority of the programs judged Caenorhabditis AKs, H. glycines AK2 and D. melanogaster AK2 to be associated with the cytoplasm and mitochondria. Interestingly, among PKs, a signal peptide is most common in nematode AKs.
Signal peptide and localization prediction of arginine kinase and selected phosphagen kinases.

ER, endoplasmic reticulum; Mi, mitochondria; Cy, cytoplasm; Ex, extracellular, including cell wall; SP, secretory pathway.
*SOSUI and SignalP 3.0 analyse the presence of signal peptide and the numbers indicate the estimated cleavage site of those amino acids from the N-terminus.
**The percentages in Mitoplot indicate the possibility for mitochondrial targeting sequence.
a SOSUI signal (http://bp.nuap.nagoya-u.ac.jp/sosui/sosuisignal/sosuisignal_submit.html) (Gomi et al., Reference Gomi, Sonoyama and Mitaku2004).
b SignalP (http://www.cbs.dtu.dk/services/SignalP/) (Bendtsen et al., Reference Bendtsen, Nielsen, Heijne and Brunak2004).
c Predotar v. 1.03 (http://urgi.versailles.inra.fr/predotar/predotar.html) (Small et al., Reference Small, Peeters, Legeai and Lurin2004).
d Mitoplot (http://ihg2.helmholtz-muenchen.de/ihg/mitoprot.html) (Claros & Vincens, Reference Claros and Vincens1996)
e PSORT2 (http://psort.ims.u-tokyo.ac.jp/form2.html) (Nakai & Horton, Reference Nakai and Horton1999).
f WoLF PSORT (http://wolfpsort.org/) (Horton et al., Reference Horton, Park, Obayashi and Nakai2006).
g TargetP 1.1 (http://www.cbs.dtu.dk/services/TargetP/) (Emanuelsson et al., Reference Emanuelsson, Nielsen, Brunak and Heijne2000).
Determination of exon/intron organization of A. suum arginine kinase and comparison with other selected phosphagen kinases
The A. suum AK gene has a 9-exon/8-intron structure. The introns are located at positions 31.0 (579 bp), 62.0 (503 bp), 99.1 (848 bp), 167.2 (896 bp), 195.0 (525 bp), 251.0 (761 bp), 342.0 (643 bp) and 373.0 (669 bp) of the amino acid sequence of A. suum AK. The introns of A. suum AK began with GT and ended with AG (GT–AG pattern) except for the intron at position 62.0 (GC–AG pattern). Two positions (99.1 and 195.0) are identical to those of other PKs (fig. 5). Surprisingly, there is not a single conserved intron position between A. suum AK and Caenorhabditis AKs, as might be expected given their phylogenetic relationship (Suzuki et al., Reference Suzuki, Uda, Adachi, Sanada, Tanaka, Mizuta, Ishida and Ellington2009). It is suggested that this is due to relatively rapid alteration of the intron positions in nematode AKs compared with those of molluscan AKs, because two intron positions (indicated as X in fig. 5) of Sabellastarte indica AK1, known as a CK-related gene (Uda & Suzuki, Reference Uda and Suzuki2007), are different from MiCK of Homo sapiens by just one amino acid, and similarly, this phenomenon was observed when intron positions 62.0 and 373.0 of A. suum AK were compared with 61.0 and 372.0 of Caenorhabditis AKs. It also appears that, in contrast to the molluscan AKs and the CK group, intron positions are less conserved in nematode AKs (99.1 and 195.0).
Intron/exon organization of A. suum arginine kinase and other phosphagen kinase genes. Black lines and split lines indicate the length of the ORF region of AKs and existence of intron positions, respectively. The numbers are based on the amino acid sequences of A. suum AK and intron phases are indicated by ‘.0’, ‘.1’ or ‘.2’ following the amino acid sequence position. Identical intron positions among those PKs are connected with a dotted line. Percentages indicate the proportion of the number of the conserved intron positions to the total number of intron positions in each PK gene. The number of conserved intron positions/number of total intron positions are shown in ( ).

Discussion
Compared to many/some other PKs, the AK of A. suum has a long N-terminal extension of ~50 amino acids (fig. 1) which corresponds to a signal-targeting peptide. An N-terminal signal peptide is a common feature of secreted and membrane proteins (Pearson et al., Reference Pearson, McManus, Smyth, Lewis and Loukas2005) and such peptides were identified in the mitochondrial AKs of Drosophila and Caenorhabditis (Uda et al., Reference Uda, Fujimoto, Akiyama, Mizuta, Tanaka, Ellington and Suzuki2006), mitochondrial TK of Arenicola brasiliensis (Uda et al., Reference Uda, Saishoji, Ichinari, Ellington and Suzuki2005), and mitochondrial CKs (Klein et al., Reference Klein, Haas, Perryman, Billadello and Strauss1991). Similarly, a putative signal peptide has been identified in the nematode T. canis AK which was suggested to target this PK either to the cytosol or endoplasmic reticulum (Wickramasinghe et al., Reference Wickramasinghe, Uda, Nagataki, Yatawara, Rajapakse, Watanabe, Suzuki and Agatsuma2007). In the case of A. suum, whether its AK is translocated or not remains to be elucidated through other methods, as the predictions made by the programs used in this study were inconclusive. Moreover, according to Harcus et al. (Reference Harcus, Parkinson, Fernández, Daub, Selkirk, Blaxter and Maizels2004), the validity of the assumption that signal sequences indicate the extracellular secretion of enzymes remains to be resolved.
The recombinant A. suum AK expressed as fusion protein with MBP showed significant activity for the substrate l-arginine and very little activity for d-arginine (table 1). In addition, the low  value obtained indicates the strong affinity of the recombinant enzyme for l-arginine (table 2). Considerable differences have been observed in the K m values of A. suum AK in comparison with that of other AKs. Arginine kinases generally exhibit synergism of substrate binding wherein the binding of one co-substrate facilitates the binding of the second substrate (Compaan & Ellington, Reference Compaan and Ellington2003). Consistently, A. suum recombinant AK exhibited positive synergism during substrate binding. Furthermore, the
 value indicates that this enzyme has relatively high catalytic efficiency compared to other AKs.
Alignment of amino acid sequence (fig. 1) showed that A. suum AK has five amino acid deletions in the guanidino specificity (GS) region, similar to other AKs. The GS region was proposed as a possible candidate for the guanidine-recognition site and the number of deletions in this region has an inverse correlation with the size of the phosphagen substrate utilized (Suzuki et al., Reference Suzuki, Kawasaki and Furukohri1997). It has been reported that the amino acids Ser105, Gly106, Val107 and Tyr110 found in the GS region are essential for arginine binding in L. polyphemus AK (Zhou et al., Reference Zhou, Somasundaram, Blanc, Parthasarathy, Ellington and Chapman1998), and mutation of these residues results in a significant decrease in the activity for arginine (Pruett et al., Reference Pruett, Azzi, Clark, Yousef, Gattis, Somasundaram, Ellington and Chapman2003; Gattis et al., Reference Gattis, Ruben, Fenley, Ellington and Chapman2004). Results of this study suggest that the mutations in Ala105 and Ser106 of A. suum AK do not cause drastic changes in the kinetic constants of A. suum AK (table 2) and, secondly, A. suum AK has greater affinity for l-arginine than do other AKs, although it does not have the conserved Ser105Gly106 in the GS region. A comparable situation was noted for the AK of Stichopus japonicus (Suzuki et al., Reference Suzuki, Yamamoto and Umekawa2000b). This could suggest that A. suum AK, like that of S. japonicus, has a unique substrate-binding mechanism. However, Tyr110, which is proposed to form a crucial hydrogen bond with the substrate, and Asp62 and Arg193 (numbering is that for L. polyphemus AK), proposed to regulate synergism (Fujimoto et al., Reference Fujimoto, Tanaka and Suzuki2005), are still conserved in A. suum AK.
As in a previous study (Klein et al., Reference Klein, Haas, Perryman, Billadello and Strauss1991), the phylogenetic tree showed the presence of the major AK and CK clusters. The tree topology and sequence identities suggest that A. suum AK is more closely related to nematode, protozoan and arthropod AKs than to molluscan AKs. To further elucidate the phylogenetic relationship we have compared the intron/exon organization of the A. suum AK gene with that of other AKs. Six out of these eight introns were found to be unique to A. suum AK and not conserved with Caenorhabditis AKs. Comparison of the intron position of the A. suum AK gene with protozoan, arthropod, platyhelminth and molluscan species (fig. 5) corroborates the assertion that although AKs are homologous, their gene organization is highly divergent and variable (Uda et al., Reference Uda, Fujimoto, Akiyama, Mizuta, Tanaka, Ellington and Suzuki2006).
In summary, we cloned the arginine kinase gene successfully from the parasitic nematode A. suum and obtained a highly purified active enzyme. The high catalytic efficiency and strong affinity for the substrate suggest that A. suum AK has a significant role in the energy metabolism of this parasite. Since AK is not present in mammals, this enzyme has the potential to be a novel chemotherapeutic target, not only against parasitic diseases such as A. suum and the closely related Ascaris lumbricoides, which infects a quarter of the world's human population (Crompton, Reference Crompton1999), but also against a kind of insect allergy (Sookrung et al., Reference Sookrung, Chaicumpa, Tungtrongchitr, Vichyanond, Bunnag, Ramasoota, Tongtawe, Sakolvaree and Tapchaisri2006).
Acknowledgements
We thank all the members of the Department of Environmental Health Sciences of Kochi Medical School for their encouragement and help.



