

Of late years women patentees have been very much to the fore, many of the more ingenious devices on the markets of the world … owing their origin to the fertile brains of the fair sex
Sunday Times (Sydney), 5 February 1905, p. 7Introduction
By the later decades of the nineteenth century, women were becoming more prominent actors in the economies of many nations, particularly as workers, entrepreneurs, investors and inventors. A large and expanding literature reflects these developments across a growing number of nations. Recent Australian scholarship has developed our understanding of female employment, entrepreneurship and investing. Our knowledge of Australian female inventors, however, is far more limited and is mostly focused on very recent experience.Footnote 1 The current paper addresses this omission by analyzing extensive data on patenting by women from the 1860s to the eve of World War One in colonial Victoria and the early years of federated Australia. We show that women were a small but diverse and growing group of inventors, and we reveal something of their characteristics and what sort of inventions they undertook. We compare our findings with recent work on female patenting in other nations, particularly the UK, USA, France, Italy, Sweden, Belgium, the Netherlands, Brazil, and Germany.Footnote 2 Our main primary source is the patent records of colonial Victoria and those covering Australia as a whole in the first decade following Federation, after which the information on individual inventors becomes much less rich.
While there has been little historical research on female patenting in Australia, Gary Magee’s important work on patenting in colonial Victoria includes some results for female patentees.Footnote 3 He reports briefly on 250 female patents in colonial Victoria, 1854–1903, concluding their share was very small, especially before changes to married women’s property rights; most women came from Melbourne and its suburbs, and their patents were mostly focused on the secondary and household industries. We build on Magee’s pioneering work in a number of important respects. Our database extends through to the decade after Federation with 673 observations that include national coverage using a wider range of sources. We draw extensive comparisons with the experience of female patenting in other countries. We calculate both the Gender Patenting Gap and Revealed Technological Advantage. The collaborative and professional behaviors of female patentees are also analyzed.
Finally, we also make a novel contribution by drawing comparisons between women as inventors and investors as sources of female economic activity in Australia. Most of the international literature on the history of women’s contribution to economic activities as a whole has focused on a specific role—be it employment, entrepreneurship, land ownership, investing or inventing. Although a much smaller group than their contemporary investors, we reveal some strong parallels between the nature and behavior of female inventors and investors in late colonial Australia, which is suggestive that common forces of change were at work. In the final section, we identify some of the broader factors that may have motivated increased female participation in the economy, which we offer as a foundation for future research on this important question.
Innovation in Colonial Australia
The rapid economic expansion of colonial Australia has been generally associated with increased factor inputs (labor, land and capital), rather than innovation-induced productivity improvements, and with new technologies that mainly came from overseas.Footnote 4 However, research on patents in colonial Victoria by Magee has revealed an active domestic market in patents. Inventors came from many walks of life, providing new technologies for a wide range of uses that included construction, chemicals, food processing, household goods, refrigeration, textiles, and transport.Footnote 5 Most innovations, however, assisted those primary industries such as mining and agriculture on which Australia drew for its main sources of economic growth. Here, settlers faced largely unfamiliar conditions, such as the challenges of gold mining, or the need to adapt agricultural practices to a different geology and climate than they were accustomed to in Europe. Notable examples included drought-resistant wheat varieties and the eponymous jump-stump plough that could be used in land-cleared fields where tree stumps remained.Footnote 6 In a complementary trade and technology system, innovations in manufacturing, a sector in which Australia had a limited presence, were mostly drawn from overseas.
Patentees were predominantly individual men, although organizations such as agricultural and pastoral associations and schools of mining facilitated the spread of ideas.Footnote 7 There was a growing contribution of institutions such as companies and governments as patentees by the eve of World War One. The foreign share of patents also began to climb as Australia increasingly became part of an international innovation market in the twentieth century.Footnote 8
These circumstances were not entirely propitious for women wishing to develop new inventions. Formal and informal networks, educational opportunities, private and public institutions, and financial resources were each dominated by men. Married women faced the same challenges as those in other walks of economic life, deferring to their husbands on the ownership and operation of economic assets. The progress of inventor Louisa Lawson was said to have been “blocked by all major institutions of the modern democratic state: unions, bureaucracy, parliament and the courts.”Footnote 9
On the other hand, much invention remained with the individual—the recourse of practical tinkerers. Women’s experience in the household and in consumer industries such as textiles linked the domestic with the commercial, providing them with the opportunity to observe where innovation was most needed. Attitudes to gender were beginning to change. For example, coverture was abolished by the colonies over the final quarter of the nineteenth century, and Australia pioneered the extension of political rights to women by giving them the right to vote and stand for Parliament in 1902.
Patenting and Patent Records
Australia was one of many places to introduce or modernize its patent laws in the nineteenth century, which included the USA, Sweden, Germany, the UK, France, Italy, Spain, the Netherlands, Belgium, and Brazil. As in many other areas of the law, patenting in Australia drew on British legislation. When the UK Patent Law Amendment Act of 1852 excluded the colonies from its jurisdiction, however, Australians prepared their own patent legislation. As separate jurisdictions, each colony passed its own Act beginning in New South Wales in 1852 and Victoria in 1854, followed in 1872 by Queensland, South Australia, Tasmania and Western Australia. Despite drawing on UK practice, each colony’s law was slightly different, thereby complicating the process of acquiring patent protection across the continent. Following the Federation of the Australian colonies in 1901, a national patent system was introduced under the 1904 Patents Act.
While there is obviously a discontinuity with the replacement of State by a Federal patent system, the Victorian colonial data provides a good proxy for Australia. Applicants wishing to protect their patent across Australia could now complete a single registration instead of up to six separate ones, thereby simplifying the process and cutting its cost. Before 1904, though, many patentees had focused on the largest markets of New South Wales and Victoria and left their inventions unprotected in the other smaller jurisdictions. Of these two major colonies, Victoria provided the more favorable and lower cost terms and attracted significantly more patent applications.Footnote 10 The Commonwealth Patent Office was established in Melbourne and began registering patents on 13 February 1904. Current State patents were recognized under the new regime and could be re-registered on expiry. As a result, the patent data in the early years were a combination of new registrations under the Federal patent system and the renewal of older State patents.Footnote 11
The patenting system in Australia, as elsewhere, drew upon a network of actors and institutions including financiers, publishers, and patent attorneys.Footnote 12 Patent agents in Australia played a central role in drafting and guiding applications through the patent office, providing legal advice, and promoting cross-jurisdictional patenting.Footnote 13 By the 1880s, Australia was part of an international patenting market in which patent agents shared information with colleagues overseas and helped to promote international technology transfer.Footnote 14
It is widely acknowledged in the innovation literature that patent research has shortcomings, particularly that it omits technological advances that were difficult to patent or where inventors were reluctant to patent. It also faces challenges accounting for heterogeneity among different patents—some led to important advances, but many others proved to be worthless. Various measures of quality have been adopted, such as the length of the patent, but this information is not without shortcomings of its own and is often not available.
Differences in their cost, access, length, and other legal requirements were among the factors likely to have influenced relative patenting rates, including by women, between nations. Several studies have looked at differences in the cost of patenting across a range of countries.Footnote 15 Khan’s study of different national systems suggests that patenting rates in New South Wales may have been affected by other factors such as distance and the small local market.Footnote 16 In general, the cost and complexity of patenting was reducing in many countries following mid-century changes to legislation. The later-nineteenth-century growth of an international system of patenting fostered a convergence of practices and cross-border agencies. The opportunities for women were also likely to have varied among nations. Overall, there was a growth of women’s economic rights across many nations in the second half of the nineteenth century, particularly as a result of the decline of coverture. However, differences in the cost of patenting affected the social composition of female patentees, with women from poorer households featuring more commonly in the USA than in France or the UK.Footnote 17
Other measures of technological change have been used, such as research and development income and evidence from exhibitions and prizes. R&D is rarely available before the mid-twentieth century. Women’s exhibitions were becoming common by the late nineteenth century, including in Australia.Footnote 18 Again, these are far from ideal measures since they were occasional events, did not include many patented inventions, and often focused mainly on household inventions and the creative arts. In their defense, patents provide wide-ranging, continuous evidence of the inventive efforts of a nation, often over long periods of time.
We have recorded all domestic and overseas female patentees from 1868 to 1910, comprising the colony of Victoria (1868-1903) and the first seven years of the Federal system (1904–1910). Our principal sources for patent applications are the Victorian Government Gazette, 1868–1904, the Commonwealth of Australia Gazette, 1904, and The Australian Official Journal of Patents, 1905–1910. The first recorded female patent was in 1868, and we stop at 1910, as from 1911 comprehensive applicant information was not published in The Australian Official Journal of Patents. The data comprises the full name, occupation, and address of the applicant, the date of the application, and a description of the patent.
We identify a female patent applicant using a first-name-based approach, as we do not have individual-unit census data in Australia to be able to use a census-linked approach.Footnote 19 As a result, we take a number of conservative steps and only count a female patentee if we have a full first name, can identify the female through a combination of first and second name, and/or can cross-check the name with an occupation that is likely female. We also assume all patentees with initials only are male.
We use the U.S. Social Security Administration (SSA) list of the top 200 female first names for the three decades 1880s, 1890s and 1900s as our dictionary of certified female names.Footnote 20 Similar lists of Australian female first names are only available from the 1940s (South Australia) and 1950s (New South Wales).Footnote 21 We counted a patentee as female if their first name was on the SSA list, or if their first name was likely feminine and their second name was on the list. For example, first/second names such as Ada, Beatrice, Eliza, Ida, Myra, and Winifred were female, together with Dorcas Daisy and Adela Elizabeth (Dorcas and Adela are not in the SSA list, but Elizabeth and Daisy are). 86 percent of first/second names in our sample were identified as female using this criterion. The remaining female patent applicants had (what we judged to be) feminine names that were not on the SSA list but had an occupation (for example, dressmaker, married woman, gentlewoman) that identified them as female. For example, Anita Adrienne Gibbs from Tasmania made three patent applications between 1906 and 1909, listing her occupation as “Married Woman” in each case.
There were 673 observations, with 623 patent applications where a woman was a named inventor, and 50 where she was an assignee from the original inventor (35) or had a legal relationship with the inventor (15). We coded the data by name, occupation, town, state and country, date of application, industry of patent, whether the patent application was made individually, jointly (with other females, males), jointly with an applicant with the same surname (isonomy), and whether the patent application involved an invention, was an assignment from the inventor to the female applicant, or other type of application (such as a woman acting as a legal representative of the inventor, or nominee of the inventor, or executrix of the deceased inventor). There are 534 unique females in the data.Footnote 22
We would expect our patent evidence to understate the true level of female inventiveness for several reasons. Before the abolition of coverture, female inventions were often patented by men.Footnote 23 As mentioned earlier, some inventions that were displayed at women’s exhibitions were not patented.Footnote 24 Thirdly, women’s inventions were sometimes patented by their employer.Footnote 25
The Gender Patenting Gap
The gender patenting gap (GPG), sometimes called the Women Inventor Rate (WIR), has been commonly used to measure the overall numerical contribution of women to patenting in each nation. This calculates either the female share of all patent applications or the female share relative to the male share. The latter takes account of institutional patents that do not name individuals, although, as we saw above, this is more significant for the twentieth than the nineteenth century. There are different ways of measuring the number of female patents, particularly distinguishing between the number of patent applications that include a woman, compared with the share of females of all patentees. Since most women in our study patented individually, the difference in results is commonly quite small. We have included in our female share all patent applications that involved a female inventor as a share of all applications. On this basis, there were 623 patent applications that included at least one female inventor across the period from a total of 40 804 patent applications, that is 1.5 percent.Footnote 26
Although the GPG remained large, it decreased (female share increased) across the period from 0.75 in the early 1870s to averaging 2.0 percent between 1904 and 1910 (Figure 1).Footnote 27 The growth trend is fairly consistent, particularly from the mid-1880s, but with a few shorter fluctuations such as nadirs in the mid-1870s and late 1880s and peaks in the mid-1880s and mid-1890s. Although Australia experienced an economic downturn in the mid-1890s and the establishment of Federation in 1901, there is no obvious cyclical or structural connection between our data and the economic trends and political developments of the period. The Australia-wide data from 1904 is not inconsistent with the prior Victorian data, and formal tests detect no structural break at the transitionFootnote 28, suggesting this is a good proxy.Footnote 29
Gender Patent Gap, Australia, 1868–1910.

Figure 1. Long description
The X-axis represents years from 1868 to 1910 in one-year increments. The Y-axis represents the percentage share, ranging from 0.0% to 3.5% in 0.5% increments.
Two data series are plotted:
1. Female share of patent applications: A solid dark blue line that is highly volatile. It begins at approximately 1.6% in 1868, drops to 0% several times (1869, 1872, 1876, 1881), and reaches its highest peak of nearly 3.0% in 1907. Other significant peaks occur in 1893 (approx. 2.5%) and 1903 (approx. 2.2%).
2. Linear trend: A dashed grey line starting at approximately 0.5% in 1868 and showing a constant linear increase to approximately 1.7% by 1910.
The overall visualization indicates that while year-to-year participation fluctuated significantly, the long-term trend for female patent applications was positive over the 42-year period.
In other countries investigated—including the UK, France, Germany, Italy, Sweden, Brazil, USA, Belgium and the Netherlands—the female share of patents in the nineteenth century was similarly small, around 1–3 percent of all patents. While the female share grew within this band in some nations (UK, USA, Sweden), for others it remained largely unchanged (France, Italy, Brazil).Footnote 30
The Community of Female Inventors
What Type of Women Invented?
The richness of our evidence enables us to go beyond counting the number of women inventors to investigate more about them and what this might imply of their motives and behaviors.
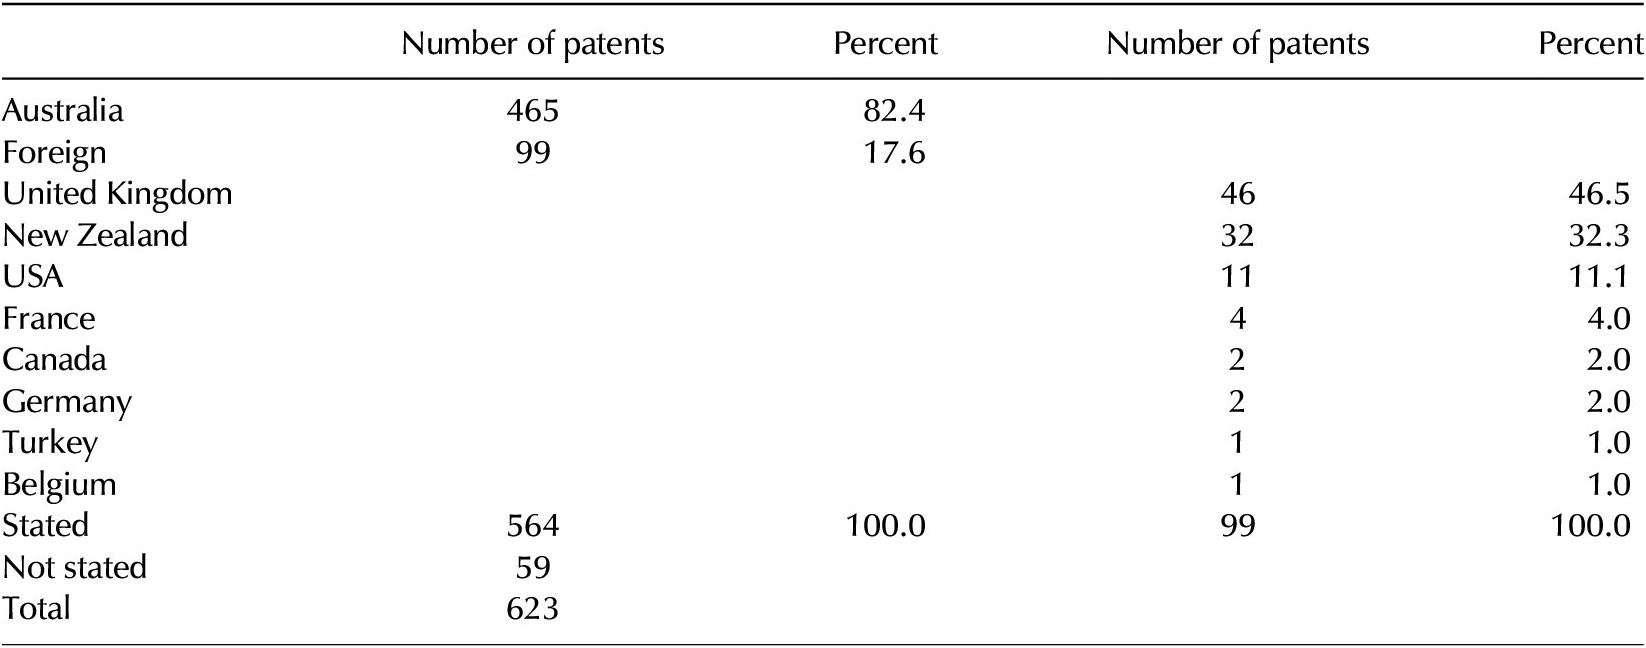
We know the national origins of 91 percent of female patent applications. Of these, 82 percent came from Australia with most of the remainder from the UK, New Zealand, and small numbers from other western nations (Table 1). The foreign female share of 18 percent is the same as for UK patenting but higher than for the US (4 percent) or France (4.5 percent).Footnote 31 Italy, by contrast, had a foreign share for women of 62 percent before 1914, reflecting the major role played by foreign inventors generally in the country.Footnote 32 Similarly, 45 percent of female patent applications in Brazil were by foreigners who often relied on local companies in Brazil to apply for the patent. Zimmerman suggests this may have sheltered them from negative attitudes toward female patenting in Brazil.Footnote 33
Nationality of female patentees

Table 1. Long description
The table is organized into five columns. The first column lists the nationality, followed by two sets of ‘Number of patents’ and ‘Percent’ columns.
* Primary Categories:
- Australia: 465 patents, representing 82.4 percent.
- Foreign: 99 patents, representing 17.6 percent.
- Stated Total: 564 patents, representing 100.0 percent.
- Not stated: 59 patents.
- Total: 623 patents.
* Breakdown of the 99 Foreign Patents (100.0 percent of the foreign subset):
- United Kingdom: 46 patents (46.5 percent).
- New Zealand: 32 patents (32.3 percent).
- U S A: 11 patents (11.1 percent).
- France: 4 patents (4.0 percent).
- Canada: 2 patents (2.0 percent).
- Germany: 2 patents (2.0 percent).
- Turkey: 1 patent (1.0 percent).
- Belgium: 1 patent (1.0 percent).
Source: See text.
Within Australia, most applications came from the large urban centers of Melbourne followed by Sydney, the other colonial capitals, and several regional centers. In other countries, including the US, France, and Sweden, most female patentees also came from urban areas, disproportionate to the country’s level of urbanization, particularly from capital cities.Footnote 34 Our data suggests that this may also have been the case for the UK, where two-thirds of patent applicants in Australia from the UK were located in London.
In order to understand more fully the geographical pattern of female patenting across Australia, we have focused on patent applications made during the first decade of the national patent system (1904–1910). We find that 75 percent of Australian female applications were from women who resided in a capital city (Melbourne, Sydney, Brisbane, Adelaide, Perth or Hobart) and 25 percent in regional towns. However, while patents originating in the regions remained in a minority, they were spread broadly across 63 different towns (Figure 2).Footnote 35
Geographical Distribution of Australian Female Patenting, 1904–10.

Figure 2. Long description
The map shows the distribution of data points across Australia using blue circles. The largest concentrations and largest circle sizes are located in the Southeast, specifically around Melbourne and Sydney.
* East Coast: A high density of small to medium circles extends from Townsville in the Northeast, down through Brisbane, Newcastle, and Sydney.
* Southeast: The highest density and largest circles are clustered around Melbourne and the surrounding region of Victoria.
* South: A small cluster of medium-sized circles is located near Adelaide.
* Southwest: A sparse cluster of small circles is located around Perth.
* Central and North: The interior and northern regions are largely empty, with only a single small point near Alice Springs and one near Darwin.
* Tasmania: Several small circles are distributed vertically along the island south of the mainland, near Hobart.
We know little about the socio-economic background of female patentees in Australia, although 12 percent classified themselves as a gentlewoman or lady. There is a general conclusion in much of the historical literature that female inventors were from educated, privileged, if not elite, backgrounds.Footnote 36 Khan, however, warns against overstating the inventive role of wealthy, middle-class urban women in America at the expense of women from more modest rural households who responded to practical needs, particularly in the frontier regions.Footnote 37
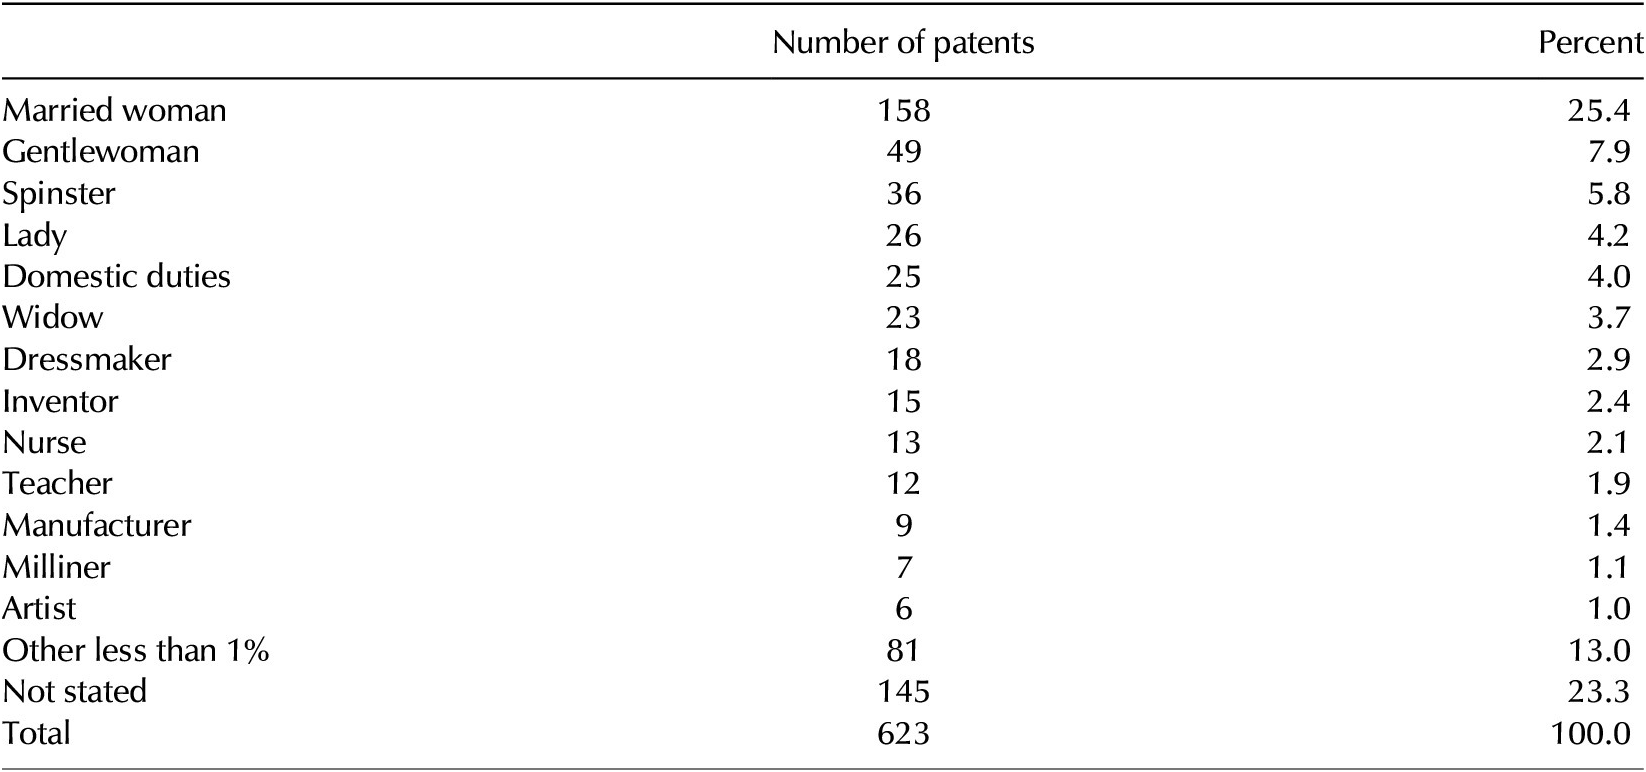
Occupational status may throw further light on the location and social standing of inventive women. Australian women provided an occupation in 77 percent of applications (Table 2). What is striking is that in 56 percent of these cases women declared their “occupation” in the form of their civil status.Footnote 38 While we assume that these women were not in the paid workforce, these returns nonetheless reflect gender norms of the period since men did not provide marital or other honorific titles in their patent applications.
Occupation of Australian female patentees, 1868–1910

Table 2. Long description
The table consists of three columns: Occupation, Number of patents, and Percent. The data is organized as follows:
* Married woman: 158 patents, 25.4 percent.
* Gentlewoman: 49 patents, 7.9 percent.
* Spinster: 36 patents, 5.8 percent.
* Lady: 26 patents, 4.2 percent.
* Domestic duties: 25 patents, 4.0 percent.
* Widow: 23 patents, 3.7 percent.
* Dressmaker: 18 patents, 2.9 percent.
* Inventor: 15 patents, 2.4 percent.
* Nurse: 13 patents, 2.1 percent.
* Teacher: 12 patents, 1.9 percent.
* Manufacturer: 9 patents, 1.4 percent.
* Milliner: 7 patents, 1.1 percent.
* Artist: 6 patents, 1.0 percent.
* Other less than 1 percent: 81 patents, 13.0 percent.
* Not stated: 145 patents, 23.3 percent.
* Total: 623 patents, 100.0 percent.
Sources: See text.
Given the obstacle of coverture, it is notable that no applications were received from Victorian married women until after the passage of the colony’s second coverture Act in 1882 and no married women from Sydney until the passage of New South Wales’s second Act in 1893. Contemporaries suspected that the ending of coverture stimulated female patenting.Footnote 39 After these dates, married women were by far the largest “occupational” group, representing 33 percent of female patents. Married women also featured at least as commonly as single or unmarried women in France, but differed in the US, where there were more widows than married women, but changes in women’s property rights increased their patenting rates.Footnote 40 The share of married relative to widowed women also increased in Italy from the 1890s to the early twentieth century, but unmarried women remained in a large majority.Footnote 41
Of the 27 percent of female patent applications (or 35 percent of those who stated an occupation) who stated an occupation outside of the home, there were many fields of work, most commonly professional or commercial roles such as nurse, teacher, dressmaker, and inventor. The largest broad occupational groupings of female patentees were elite professions and teachers, which together constituted nearly half (47 percent) of declared occupations. This reflected occupations which were heavily dominated by women in Australia, similar to their experience in many other nations.Footnote 42
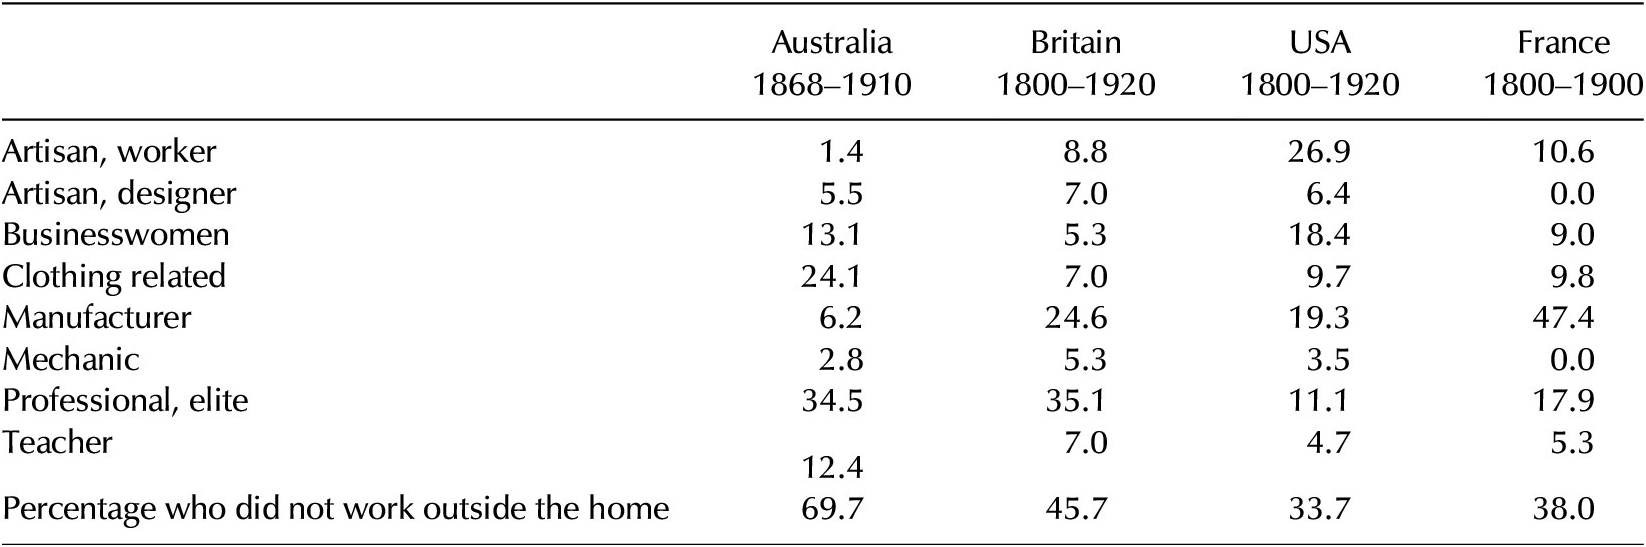
We adopt the classification system used by Khan to draw comparisons with the US, UK and France (Table 3). The occupations of Australian female inventors confirm the diversity found in other nations, while showing similarities and differences for specific sectors. The role of manufacturer was less common in Australia, but that of clothing-related greater. Artisan or production workers were very few in Australia but significantly more important in the USA and France. While definitional issues might explain some of these differences, it may also reflect variations in social and economic structures including the small local manufacturing sector. Perhaps the most unusual “occupation” was Princess of the German Empire, Anne of Lowenstein Wertheim, located in London, whose “self-levelling cots, bunks, couches and the like for use on shipboard” was designed to tackle sea-sickness. Somewhat ironically, she was a pioneer aviator who, in 1927, was the first woman to die on a trans-Atlantic flight.Footnote 43
A comparison of the occupations of female patentees in Australia, Britain, the US and France (%)

Table 3. Long description
The table compares four regions across different timeframes: Australia 1868 to 1910, Britain 1800 to 1920, U S A 1800 to 1920, and France 1800 to 1900.
Occupational data points (in percentages) are as follows:
* Artisan, worker: Australia 1.4, Britain 8.8, U S A 26.9, France 10.6.
* Artisan, designer: Australia 5.5, Britain 7.0, U S A 6.4, France 0.0.
* Businesswomen: Australia 13.1, Britain 5.3, U S A 18.4, France 9.0.
* Clothing related: Australia 24.1, Britain 7.0, U S A 9.7, France 9.8.
* Manufacturer: Australia 6.2, Britain 24.6, U S A 19.3, France 47.4.
* Mechanic: Australia 2.8, Britain 5.3, U S A 3.5, France 0.0.
* Professional, elite: Australia 34.5, Britain 35.1, U S A 11.1, France 17.9.
* Teacher: Australia 12.4, Britain 7.0, U S A 4.7, France 5.3.
The final row indicates the percentage of female patentees who did not work outside the home: Australia 69.7, Britain 45.7, U S A 33.7, and France 38.0.
Sources: Britain, USA, and France data from Khan (2024, 939). Clothing related = Khan’s category of Corset-maker.
Merouani and Perrin (2024a, 270) alternatively use the Historical International Standard Classification of Occupations (HISCO) groups for France, 1791–1900.
Professional Inventors
Anne was primarily a wealthy funder of early aviation who registered three sea-sickness patents in quick succession. Like most of the women in our database, she could not be considered a full-time or professional inventor, which might be defined as someone who makes a set of distinct inventions across a number of years. The occupation of “inventor” was attached to 15 patents, as shown above in Table 2. Half of these were by overseas inventors who may have been professionals but only recorded a single patent in Australia. Of the Australian self-titled “inventors,” most only patented once.
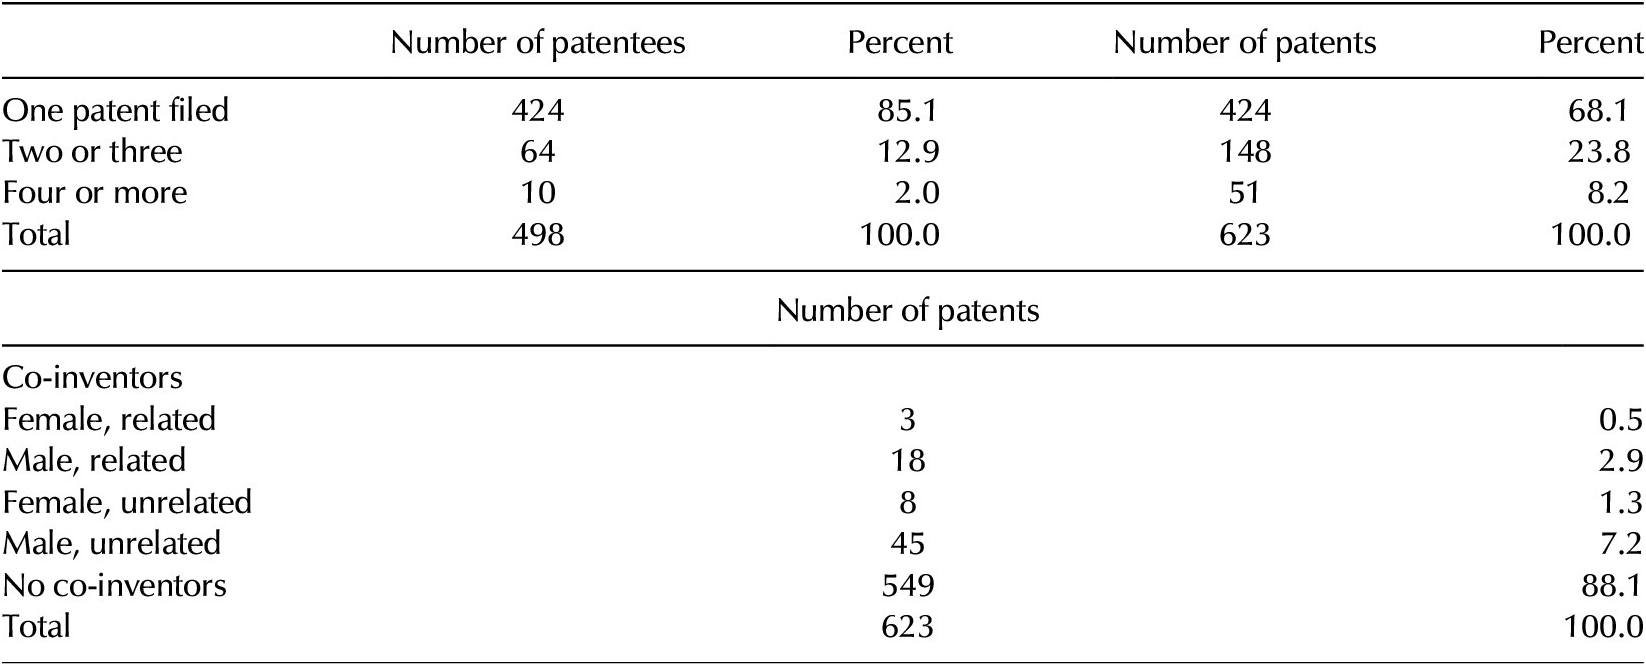
An alternative way of looking for professional inventors, therefore, is to analyze women who made a series of applications over multiple years. Table 4 shows that 85 percent of women recorded only a single patent application, 13 percent accounted for 2 or 3, and only 2 percent—10 women—had four or more.Footnote 44 Of these ten, all Australian, most modified a specific patent over just one or several years. Three have a stronger claim to professional status. Most productive was Elizabeth Parnell, a metallurgist or mining engineer of Richmond NSW, who began patenting two years after her husband’s death in 1880 but had already had “years of study” of mining gold.Footnote 45 Our database includes 14 patents by her. Overall, she took out 48 patents in Australia and then Britain, where she relocated.Footnote 46 The success of her inventions led to a syndicate funding her subsequent inventions.Footnote 47 Ellen Dugan filed 13 patents in five years and Eda Nesbitt seven across three years. Ellen was also an assignee for several inventions patented by others, suggesting, perhaps, that she combined the roles of patentee and entrepreneur. Interestingly, these three women predominantly described themselves as a gentlewoman, lady, or married woman. On one of her final patents, Parnell described herself as a mining engineer, a profession she had clearly been practicing for many years. These notable examples point to the likelihood that the economic contribution of women to the colonial Australian economy was much greater than implied by the monikers they adopted in official documentation. It also speaks to contemporary gender norms that women opted to enter the world of patenting using their civil titles even when they were clearly practicing a professional occupation. The use of socially elevated civil status—gentlewoman, lady and perhaps married woman—may have been viewed as a means of facilitating their entrance into male-dominated spheres of economic activity.
Professional and collaborative female patentees

Table 4. Long description
The first table categorizes patentees by the number of patents filed. It has four columns: Number of patentees, Percent, Number of patents, and Percent.
* One patent filed: 424 patentees (85.1 percent), 424 patents (68.1 percent).
* Two or three: 64 patentees (12.9 percent), 148 patents (23.8 percent).
* Four or more: 10 patentees (2.0 percent), 51 patents (8.2 percent).
* Total: 498 patentees (100.0 percent), 623 patents (100.0 percent).
The second table categorizes the 623 total patents by co-inventor relationship.
* Female, related: 3 patents (0.5 percent).
* Male, related: 18 patents (2.9 percent).
* Female, unrelated: 8 patents (1.3 percent).
* Male, unrelated: 45 patents (7.2 percent).
* No co-inventors: 549 patents (88.1 percent).
* Total: 623 patents (100.0 percent).
Sources: See text.
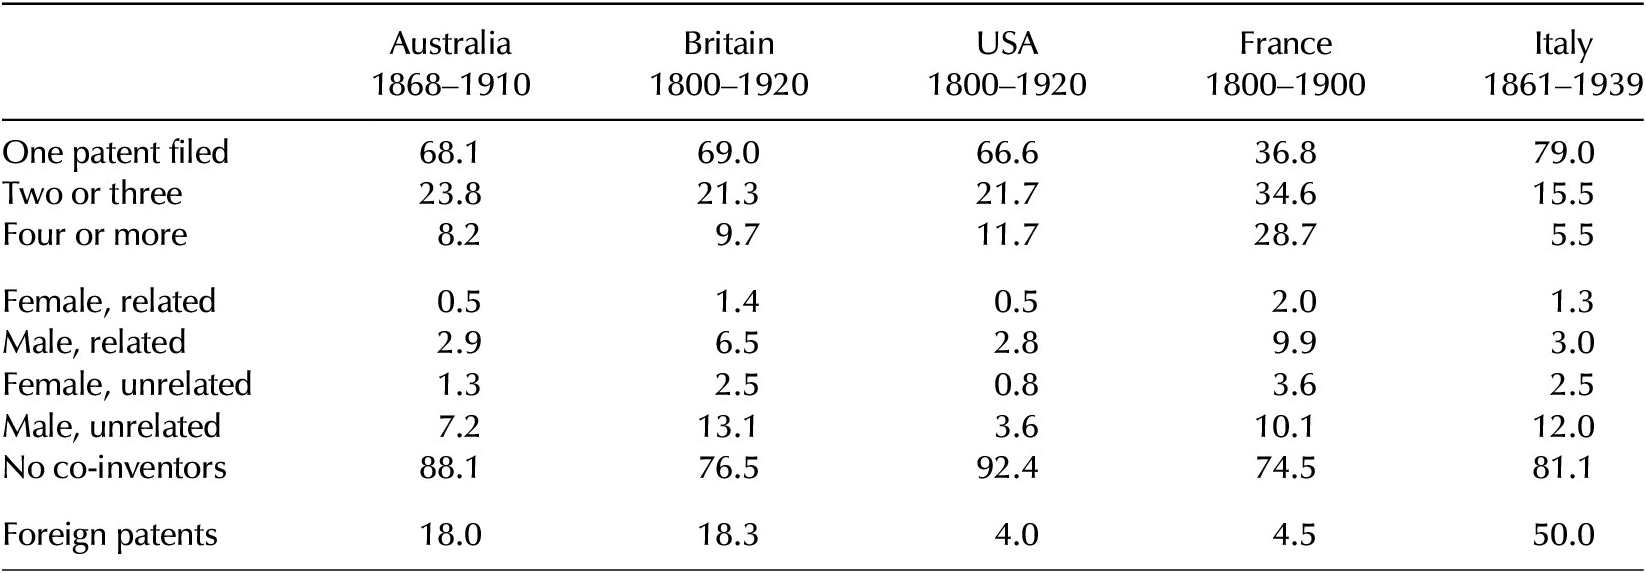
We can compare these results with other countries by focusing on patent applications (not the patentees themselves). Table 5 reveals very similar results among Britain, the USA and Australia. France, however, had a significantly larger share of patents from women who made 10 or more applications. Many of these women worked for manufacturing firms and made multiple improvements to production processes.
Professional and collaborative female patentees, international comparisons (%)

Table 5. Long description
The table contains 5 columns of data representing different countries and time periods: Australia 1868 to 1910, Britain 1800 to 1920, U S A 1800 to 1920, France 1800 to 1900, and Italy 1861 to 1939.
Row data for each country is as follows:
* One patent filed: Australia 68.1, Britain 69.0, U S A 66.6, France 36.8, Italy 79.0.
* Two or three patents: Australia 23.8, Britain 21.3, U S A 21.7, France 34.6, Italy 15.5.
* Four or more patents: Australia 8.2, Britain 9.7, U S A 11.7, France 28.7, Italy 5.5.
* Female, related co-inventors: Australia 0.5, Britain 1.4, U S A 0.5, France 2.0, Italy 1.3.
* Male, related co-inventors: Australia 2.9, Britain 6.5, U S A 2.8, France 9.9, Italy 3.0.
* Female, unrelated co-inventors: Australia 1.3, Britain 2.5, U S A 0.8, France 3.6, Italy 2.5.
* Male, unrelated co-inventors: Australia 7.2, Britain 13.1, U S A 3.6, France 10.1, Italy 12.0.
* No co-inventors: Australia 88.1, Britain 76.5, U S A 92.4, France 74.5, Italy 81.1.
* Foreign patents: Australia 18.0, Britain 18.3, U S A 4.0, France 4.5, Italy 50.0.
Collaborators or Loners?
Australian women predominantly filed patents by themselves. Table 4 indicates that 88 percent of female patent applications were made solely, with 7 percent being with unrelated (by name) males, and 3 percent with related males. While in a small number of cases unrelated males may have provided some support, probably financial, overwhelmingly, the results point to women acting independently as inventors. International comparisons in Table 5 suggest the same conclusion, although in Britain and France there were somewhat fewer sole female patents (76, 74 percent) and somewhat more with unrelated males (13, 10 percent). American patent applications were overwhelmingly by sole women (92 percent).
What Did Women Invent?
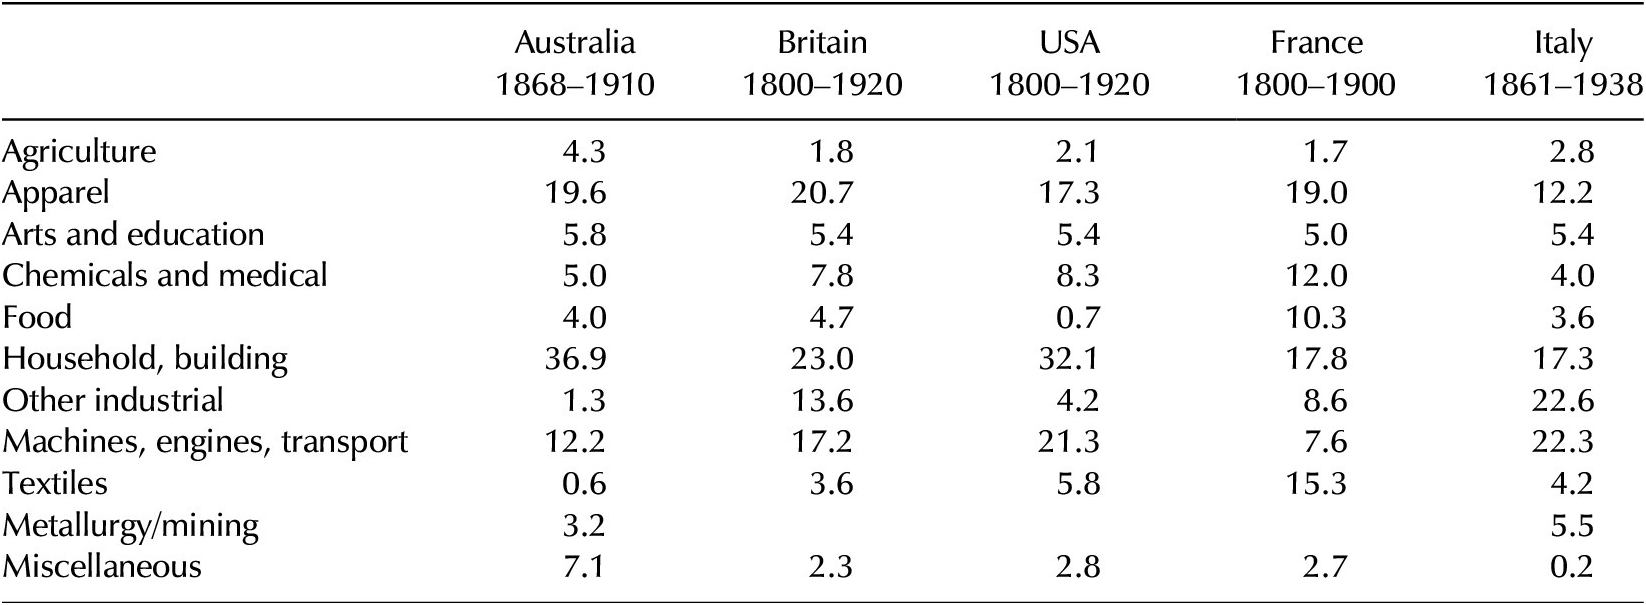
Australian women filed patents across a breadth of industries (Table 6). There is a focus (56 percent) on apparel and household inventions that might be associated with women’s traditional role in the home; other less traditional areas such as engineering, chemicals and metallurgy feature to a lesser degree in their applications.Footnote 48 The range and distribution of patenting industries is quite similar to that found in other countries (UK, US, France), although Australia has somewhat more in agriculture, metallurgy and household but less in industrial and engineering, which perhaps reflects different pathways of economic development. In Italy, transport, machinery and other industrial was the largest area of female patenting, particularly in the two decades before World War One when the country was experiencing industrialization, although the male concentration in these sectors was nonetheless greater.Footnote 49
Female patent applications by industry (%)

Table 6. Long description
The table compares female patenting across eleven industrial categories.
* Agriculture: Australia 4.3, Britain 1.8, U S A 2.1, France 1.7, Italy 2.8.
* Apparel: Australia 19.6, Britain 20.7, U S A 17.3, France 19.0, Italy 12.2.
* Arts and education: Australia 5.8, Britain 5.4, U S A 5.4, France 5.0, Italy 5.4.
* Chemicals and medical: Australia 5.0, Britain 7.8, U S A 8.3, France 12.0, Italy 4.0.
* Food: Australia 4.0, Britain 4.7, U S A 0.7, France 10.3, Italy 3.6.
* Household, building: Australia 36.9, Britain 23.0, U S A 32.1, France 17.8, Italy 17.3.
* Other industrial: Australia 1.3, Britain 13.6, U S A 4.2, France 8.6, Italy 22.6.
* Machines, engines, transport: Australia 12.2, Britain 17.2, U S A 21.3, France 7.6, Italy 22.3.
* Textiles: Australia 0.6, Britain 3.6, U S A 5.8, France 15.3, Italy 4.2.
* Metallurgy/mining: Australia 3.2, Italy 5.5 (other countries blank).
* Miscellaneous: Australia 7.1, Britain 2.3, U S A 2.8, France 2.7, Italy 0.2.
Time periods covered: Australia 1868 to 1910, Britain 1800 to 1920, U S A 1800 to 1920, France 1800 to 1900, and Italy 1861 to 1938.
Source: Britain, USA, and France data from Khan (2024, 941). Italian data kindly provided by Marco Martinez.
The distribution of female patent applications by technology in Australia can be measured and analyzed by the Revealed Technological Advantage (RTA) index, which enables a closer look at each female inventor nation’s innovativeness than is possible by evaluating the raw patent data. Here, Female RTA is defined as the female nationality’s share (percent) of patents in a particular sector or technology class divided by its share (percent) of total female patents. Specifically, RTAij is defined as follows:

where Pij is the number of patents registered by females from country i in technology field j. The RTA is used in technology studies because it normalizes the number of patents for cross-sectoral and cross-national group variations, and variations over time.Footnote 50
In Table 7, we examine Australia and the three countries that constituted 98 percent of foreign female patents in Australia whose geographic origins are known (England, New Zealand and the USA). An RTA greater than 1 indicates that females from that country have an RTA, or competitive advantage, in that area of technology.
Female patents revealed technological advantage, 1868–1910

Table 7. Long description
The table lists R T A values for eleven technological categories across Australia, England, New Zealand, and the U S A, with a final row for the total number of patents.
* Agriculture: Australia 1.13, England 0.00, New Zealand 2.34, U S A 0.00.
* Apparel: Australia 1.17, England 0.91, New Zealand 0.89, U S A 0.52.
* Arts and education: Australia 1.04, England 1.83, New Zealand 1.26, U S A 1.83.
* Chemicals and medical: Australia 0.92, England 0.49, New Zealand 3.36, U S A 1.95.
* Food: Australia 1.05, England 0.62, New Zealand 2.54, U S A 0.00.
* Household, building: Australia 1.17, England 0.61, New Zealand 1.22, U S A 1.09.
* Other industrial: Australia 0.84, England 5.31, New Zealand 0.00, U S A 0.00.
* Machines, engines, transport: Australia 1.01, England 2.05, New Zealand 0.28, U S A 2.46.
* Metallurgy: Australia 1.04, England 2.36, New Zealand 0.00, U S A 0.00.
* Textiles: Australia 0.67, England 3.54, New Zealand 0.00, U S A 0.00.
* Miscellaneous: Australia 1.13, England 1.82, New Zealand 0.00, U S A 1.45.
* Number of patents: Australia 465, England 44, New Zealand 32, U S A 11.
Note: R T A values greater than 1 indicate a technological advantage. Total sample size N equals 563.
Note: All calculations based on data where location of patentee is known (N = 563). RTA > 1 denoted by green.
The results confirm that Australian female patentees held their strongest advantage in household, building and apparel. This would appear to conform to what Khan (2024, p. 942) has called women’s “comparative advantage in household activities and consumer-oriented products.” The relatively high RTA in agriculture reflects the particular adaptive needs of this industry to Australian geography and geology. By contrast, Australian females were proportionally less likely to apply for patents in the chemicals and medical, industrial, and textiles sectors. English patent applications (7 percent of all patents and 47 percent of overseas patents) were disproportionately in four industries, with RTAs greater than one in industrials (5.3), textiles (3.5), machines, engines and transport (2.0), and arts and education (1.8). This perhaps indicates that English applicants chose to patent their highest value inventions in these industries, as opposed to household, building or apparel where local variations might dominate.Footnote 51 For example, Mary and George Walker, manufacturers from Staffordshire, applied for a patent in 1886 for “A process of producing lithographic or zincographic copies of photographic or other designs” while Rose and Samuel Basch filed two patents in Australia for improvements in, and relating to, elastic tires for the wheels of vehicles (1905 and 1907). In 1906, Countess Sponeck-Mayr, Angelica Maria Anna, applied for a patent for “Improvements in elastic fluid engines of the revolving cylinder type.”
Comparing our results on female occupation with industry sectors in which they patented might offer some assessment of whether women did patent in areas of expertise. However, given the different types of classification and that many women provided “occupations” (marital) unrelated to a form of vocation, this is difficult. Reference back to our original individual-level patent data, though, suggests that women who declared a workforce occupation often filed patents relevant to their work. For example, 28 percent of patents in the apparel industry were filed by females stating their occupation as costumier, dress cutter, dressmaker, machinist, milliner, seamstress or teacher of dress cutting. Interestingly, 53 percent were by married women, spinsters, ladies, gentlewomen or widows. The thirteen patent applications by nurses were predominantly in household and building for inventions relating to improved ventilation, better water heating, or bed apparatus and mattresses. Ninety percent of patents by teachers were in the apparel and arts and education industries. Many who stated their marital status are associated with domestic innovations. This would appear to confirm Khan’s assertion that the “majority of patentees tended to produce job-related inventions” and Merouani and Perrin’s that the “concept of learning by doing played a significant role in fostering women’s innovation skills.”Footnote 52 This may also suggest that women were conscious of the potential commercial benefits of their inventions, as other writers have noted, particularly Khan.Footnote 53 Overall, the sectoral distribution of women’s patenting was shaped by a nation’s economic structure, female employment categories, and the traditional domestic role of many women.
Comparing the Inventing and Investing Communities
Women in the Colonial Australian Economy
The women of colonial Australia, like their sisters in other geographies, faced many challenges to participation in public life, including that of economics and business. Legal and social prejudices took various forms. Coverture, which subsumed a married woman’s legal rights into those of her husband, was a notable constraint on their economic freedom of action in many nations.Footnote 54 They also faced barriers to education and suffered from limited financial and informational networks compared with men. In the workforce, they encountered obstacles to employment in a range of sectors, or they had to resign from employment if they married due to the so-called marriage bar.Footnote 55 Australian women also faced particular forms of disadvantage. Conservative British attitudes toward their gender’s position in the economy and society were imported by migrants from the imperial power. An ostensibly more mobile and egalitarian society in Australia might have assisted the status of women, while the strong gender imbalance in favor of men increased women’s bargaining power in the marriage market.Footnote 56 However, it often meant more focus on female reproduction than production and, it has been argued, led to higher leisure rates among women and more conservative attitudes toward their economic role.Footnote 57 In addition, the physically demanding labor of “masculine” industries common in Australia, such as mining and agriculture, militated against female participation in these sectors.
These observations might, therefore, lend support in Australia to the separate spheres ideology that women’s work was mostly confined to the household. But the reality of colonial Australia was quite different. There is a growing body of evidence that points to female involvement in the workforce, business management, land ownership, and company investment. In the commercial centers like Sydney, women ran a range of retail enterprises, particularly groceries, millineries, and draperies.Footnote 58 In the mining communities of Victoria, they were increasingly to be found acting as innkeepers.Footnote 59 Women were thought to constitute around a half of property landlords in Melbourne at the time of Federation.Footnote 60 The female share of the overall workforce was growing slowly; by 1911 only 18 percent of women were employed, 90 percent of whom were unmarried, but they were strongly represented in professional and service industries, such as nursing and teaching.Footnote 61
Recent research has particularly brought to the fore the growth of women investors in Australia in the half century to World War One. One estimate, based on an extensive sample of firms, reveals that the female share of investments rose from 6.5 percent in the third quarter of the nineteenth century to “equity” with men by the interwar period, and that women were particularly attracted to low-risk utilities companies like Australian Gaslight Company (AGL) that paid stable dividends.Footnote 62 A closer look at a large collection of Victorian goldmining companies has revealed more detail about the nature and behavior of female investors.Footnote 63
We are interested to know if these different economic roles were filled by similar or overlapping groups of women or, at least, if they behaved similarly. The international literature largely looks at these groups in isolation from each other. However, Martinez emphasizes that in Italy patentees were effectively entrepreneurs because of their risk-taking in experimenting with new unproved methods and their interest in exploiting the profits that successful innovation would yield.Footnote 64 Our database of female patentees includes a small number (35) of women to whom patents were assigned, presumably acting in an entrepreneurial role to exploit the opportunities of another person’s invention. Khan draws attention to similar overlaps in France by showing that women often patented as part of their role in family firms, although we do not find Australian evidence of this.Footnote 65
Investors and Inventors
The communities of female investors and inventors in Australia were growing rapidly in the second half of the nineteenth and early twentieth centuries, although on very different scales. 5394 female share investments (initial subscriptions) were identified in 2536 Victorian gold mining companies between 1857 and 1886.Footnote 66 This represented 3.1 percent of the total number of mining investments but 6.3 percent of investors, since they made smaller investments on average. As we saw above, the total number of Victorian (and Federal from 1904) patent applications from 1868 to 1910 that included a woman was 623, or 1.5 percent of applications. Using more comparable time periods, the number of female investors in one of Australia’s largest utilities companies, AGL, grew more than four-fold from 92 to 406 between 1881 and 1901.Footnote 67 The number of Victorian patent applications that included a woman grew more than 12-fold from 2 in 1880 to 25 in 1903. Significantly, though, the share of female investments in AGL over this period grew from 23 to 38 percent.Footnote 68 Women’s economic participation was growing rapidly in these years, and they were particularly attracted to a firm like AGL that paid stable and regular dividends.
AGL was only one of many companies in which women invested at this time.Footnote 69 The time and resources needed to develop a new invention, however, would normally be far greater than making a share investment, and therefore it is not surprising to find far fewer inventors generally, both male and female. Further, the obstacles they faced in accessing time and resources made invention for women a more challenging pursuit than for most men.
We compared our lists of inventors and mining investors to see if the same women were involved in both investment and invention. Our main lists are both taken from Victoria but with somewhat different dates. We find almost no evidence of identical names, which suggests that these were probably two distinct groups of women. While it would have been interesting to identify women involved in both activities, their separation adds to the potential count of women conducting business activities.
In spite of differences in the number of female investors and inventors and the fact that they appear to have been distinct groups, both endeavors were attracting growing numbers of women into economic society around the same time, and we can find many similarities between the two in terms of their background and their behavior.
As we saw earlier, female patentees were predominantly from Australia—at least 80 percent—a pattern that appears similar among investors. Where overseas women participated as inventors or investors, they were largely from the UK. 25 percent of AGL’s earliest female investors in the 1840s were from the UK, though by later in the century they were overwhelmingly Australian.Footnote 70 Several of the British banks established in mid-nineteenth-century Australia as free-standing multinational companies had significant numbers of British women on their share registers. However, locally registered companies had few at all.
Within Australia, we saw that most female patentees came from the major capital cities. Women investors tended to favor localization to the company’s activities; hence, many mining investors (67 percent of female investments) were located in the goldfield communities of Victoria, with fewer from Melbourne.Footnote 71 Observing their operations and seeking out local opinions in the pubs, which women often managed, provided sources of information for less-well-networked females. It may be that localized information networks were less important for patenting than was personal experience in the household or at other forms of workplace.
Married women participated in both investing and inventing in the mid-nineteenth century despite the existence of coverture practices. However, their relative contribution compared to unmarried women seems to have risen sharply from the final decades of the nineteenth century, pointing perhaps to the impact of the end of coverture and changing attitudes toward women more generally. While there were more widowed than married women investors in the gold mining companies, by the early decades of the twentieth century the situation was sharply reversed in corporate Australia with married women outweighing widows and spinsters.Footnote 72
We know less about women’s employment than their marital status until the early twentieth century, with most inventors and investors declaring nothing or their marital status or home duties as their occupation. From the information we do have, it is clear that both female investors and inventors came from a broad range of backgrounds and occupations, particularly professions such as teaching and nursing but also retail, hospitality and textiles, which is consistent with those professions in which women were most commonly employed.Footnote 73 Neither group featured artisan and factory workers to the extent indicated for several other nations. Discerning the social standing of either group is probably more difficult again. Our limited knowledge of out-of-home occupations and the periodic use of terms like lady and gentlewoman point to a predominantly middle-class core. Both inventors and investors needed time and resources that were unlikely to be available to most working-class women.
It seems likely that, with the exception of a small group, most female inventors or investors did not regard this activity as a full-time or professional pursuit. While we do not have the full account of all of the business activities of our female investors and inventors, in both fields the great majority appear only occasionally on the historical records we have unearthed. 83 percent of female mining investors completed only one share subscription, while 85 percent of female inventors filed only a single patent (Table 8). While some widows and spinsters may have relied at least in part on the financial returns of their modest investments for their living, an active involvement in financial and technology markets in Australia was restricted to a very small number of women.
Independent amateurs. Female patentee and investor practices (%)

Table 8. Long description
The table consists of three columns and three data rows. The columns are categorized as Patentees 1868 to 1910 and Investors 1857 to 1886.
* The first row, labeled One, shows 85.1 percent for Patentees and 83.1 percent for Investors.
* The second row, labeled Two or three, shows 12.9 percent for Patentees and 14.0 percent for Investors.
* The third row, labeled Four or more, shows 2.0 percent for Patentees and 2.9 percent for Investors.
The data indicates that the vast majority of independent amateur women in both categories held only one patent or investment.
We find that only 3 percent of female mining investors made four or more investments, while just 2 percent of female inventors filed four or more patents (Table 8). Most of these professional inventors had forms of employment including nurse, milliner, dressmaker and landed proprietor. Of the others, who described themselves as gentlewoman and lady, for example, the nature of their inventions points strongly to specialist knowledge associated with employment. The professional investors also appear to have had employment including as hotelkeepers and storekeepers.
The isolation of most women from mainstream financial and technology markets may be reaffirmed by the fact that they largely invested and invented by themselves. As we saw in Table 4, only 12 percent of female patent applications were made jointly with other people, while female investors very rarely invested jointly. Maybe women looked to family networks for support and advice on their occasional patents or investments? However, where women patented jointly with others, it was normally with men of a different name. In mining, women invested alongside (not jointly) family members in the same company in 37 percent of cases, substantially below similar rates in the US.Footnote 74 In the case of AGL, women did not draw notably on family members for their investments—family played minor roles in share transfers and were infrequently investors in the same company.Footnote 75
However, supposed isolation might alternatively be interpreted as independence; in other words, that women took their own decisions in relation to investing and inventing. The literature on female inventing, as discussed earlier, points increasingly to women leveraging their on-the-job experience to identify omissions and initiate inventions. The growing role of women scientists in Australia in the late nineteenth and early twentieth centuries may also point to self-determination through increased human capital.Footnote 76 The investing world was increasingly infused with financial advice, both written and in person, some of which was specifically targeted at women including the Australian Housewives Manual and the Australian Woman’s Mirror.
Motivating the Growth of Female Inventing and Investing
While it is not within the remit of this paper to provide an explanation for the growth of female economic activity such as inventing and investing, we provide some pointers for future work that might address this broader question.
The similar experiences of female inventors and investors in this period have been noted, including their absolute and relative increase, the growing role of married women, and their independent but occasional involvement in financial and technology markets. Some of the explanations for these patterns lie with specific factors in the investment (new forms of investment and changing company law) and technology (lower cost and more convenient patenting) sectors. However, the common patterns of female experience in technology and financial markets and the relatively broad range of women involved suggest more general forces were also at work.
Widely discussed in the literature on women’s economic and business role is the constraint of coverture. Khan and Gozen et al have both pointed to the importance of coverture and other improvements in women’s rights in facilitating female invention in the US.Footnote 77 We saw earlier in the paper that the role of married women both as inventors and investors increased relative to the unmarried in the final decades of the nineteenth century, by which time one or several rounds of legislation outlawing coverture had passed into law in Victoria. Australian scholars have formed differing opinions on the importance of coverture to the changing role of women.Footnote 78 Of course, alterations in practice sometimes precede legal change, and we can observe a small number of married female investors in Australian companies already in the middle of the nineteenth century.
Writers on several other nations have emphasized the importance of increased female human capital accumulation in their growing economic and business participation.Footnote 79 In Australia, the introduction of compulsory elementary education began in Victoria in 1872, which may have increased the time married women had available to focus on learning and upskilling rather than child minding. The evolution of time-saving household appliances may also have pointed in the same direction by the early years of the twentieth century. This would have given women, particularly those from the middle classes whose education levels were also increasing in this period, greater opportunity to read about investment opportunities that were becoming available from an expanding specialist press. For budding inventors, this would have enabled them to reflect more closely on improvements in household work, which in turn were likely to be time-saving. The Australian Housewives Manual from 1883, for example, offered both financial advice and household management tips.
Relatedly, Australia experienced the demographic transition of the second half of the nineteenth century, common in other parts of the world, including Europe. Fertility rates, family size, and marriage rates all fell quickly.Footnote 80 This would also have provided women with greater opportunities to build their human capital and participate in economic and business activities.
Both of these issues—independent economic rights for married women and greater opportunities for human capital accumulation—were indicative of broader changes occurring in attitudes toward the public role of women, which also manifested in areas such as political representation, as we noted earlier.
Conclusion
There is a recent and developing literature on the growing role of inventive women in the nineteenth and early twentieth centuries. Much of it relates to their role in major industrial economies of the Northern Hemisphere. We provide an in-depth analysis from a very different context in Australia. Here adaption of primary industries to local conditions was a key consideration for inventors. As elsewhere, women played an important role in household and consumer industries, drawing on their direct experience of both. But there were also exceptional figures like Elizabeth Parnell, an accomplished mining engineer with extensive innovations in ore extraction.
We find that women’s relative contribution to invention, as proxied by patents, while remaining small, grew through the period under study. Most female patentees were Australian and came from the major cities. The share of patentees that were married increased, possibly under the impact of the ending of coverture. While it is difficult to be precise about the social background of female patentees, information on their occupations points to a mainly professional middle class. Most were only occasional patentees, perhaps responding to a significant need they identified during a long career in the home, professional, or consumer sectors. Only a handful might be considered professional inventors. In general, these patterns and practices of female inventing bear out evidence from overseas, although perhaps closer to UK experience than some other nations such as Italy. Future Australian research might investigate the role of women inventors participating at exhibitions, particularly in receiving awards, areas where some overseas research suggests they were important participants.
The growing quantitative literature on the role of women has brought to light much more about the nature and extent of their economic and business roles than was previously assumed in qualitative and case study approaches. It nonetheless remains likely that their contributions are understated due to such issues as the legacies of coverture, employer patenting, unpatented or acknowledged advances, and the cost and access to the patenting process.
We were also interested in comparing Australian women inventors with other fields of female economic endeavor, an approach that has received limited attention in either the Australian or overseas literature. There were some personnel overlaps in the economic roles of some women, most obviously investor-entrepreneurs and patentee-professional workers. We were particularly interested in comparing inventors with investors since Australian research has analyzed a distinct community of named individuals in both cases. We can see very limited overlap of the individuals we have so far identified but, nonetheless, similarities emerged in behavior that reflect the common environmental triggers to which they responded. These include the occasional nature of most investing and inventing, the independent—or isolated—nature of their activities, and the growing role of married women by the end of the century. We would encourage further holistic work on the economic role of women in these different guises.
These similarities across different economic fields of endeavor are particularly important for what they tell us about the so-called new woman and the growth of modernity. Australia may not have been particularly modern at Federation—it retained traditional industries and developed a very limited form of national unification. In some respects, this was in tension with women’s aspirations of seeking to do well, which came at a cost to pioneer innovators like Louisa Lawson. Civil status still defined most women, and employment rates remained low, especially among married women. However, women had the vote, were involved in a widening range of economic activities, and looked increasingly to the United States as a symbol of modernness.Footnote 81
Acknowledgments
We are very grateful to Marco Martinez for providing the data for Italy in Table 6 and to Alexander Donges and Ruveyda Nur Gozen for sharing a copy of their jointly authored working papers cited in our references. We would also like to thank participants at the 2025 World Economic History Conference in Lund for their helpful comments on our presentation and to Faustine Perrin, in particular, for her feedback on the draft paper.





 Open access

