The rise in cases of overweight among schoolchildren is considered a serious health problem worldwide(Reference Lee and Yoon1). In developed countries, it is estimated that the prevalence of overweight among schoolchildren has increased by a factor of two to five over the last three decades(Reference Farias, Moreira and Santos2). Furthermore, data from the World Obesity Atlas and the World Health Organization (WHO) predict that by 2030, Brazil will rank 5th in the list of countries with the highest number of schoolchildren with obesity, with approximately 7 million children aged 5–19(3).
The etiology of overweight is considered multifactorial(Reference Aggarwal and Jain4) and the study of chrononutrition has gained prominence. This area assesses the interaction between the body’s biological rhythms and nutrition, that is, the relationship between these two factors and human health(Reference Flanagan, Bechtold and Pot5). This reflects the idea that, in addition to the quantity and quality food, the time of day it is consumed influences biological rhythms and, consequently, weight and other health conditions(Reference Asher and Sassone-Corsi6).
Thompson et al.(Reference Thompson, Ballew and Resnicow7), in a longitudinal study with girls initiated in 1990 by the Clinical Research Center at the Massachusetts Institute of Technology, showed that higher energy intake in the afternoon and evening, compared to the morning period, was positively associated with changes in the Body Mass Index (BMI) Z-score at the age of 15 (P = 0·039). Vilela et al.(Reference Vilela, Oliveira and Severo8), When evaluating children aged between 4 and 7 years in Porto (Portugal), it was observed that higher energy intake at lunch and supper, or at the afternoon snack, was positively associated with a higher BMI (OR: 1·19; 95 % CI: 1·05, 1·34; OR: 1·18; 95 % CI: 1·05, 1·34, respectively), additionally, higher fat intake at lunch was associated with an increased risk of overweight at the age of 7 (OR: 1·17; 95 % CI: 1·03, 1·32).
In the city of Alabama (USA), a study with schoolchildren aged 6 to 10 years found that shoes who had dinner after 19.00 had a significantly higher BMI Z-score (P < 0·026) compared to those who dinner earlier(Reference Venkatapoorna, Ayine and Selvaraju9). A systematic review and meta-analysis conducted by Zou et al.(Reference Zou, Northstone and Perry10), suggested that children and adolescents with higher energy intake close to bedtime, as well as those who skipped the main evening meal, were more likely to be overweight (OR: 1·19; 95 % CI: 1·06, 1·33; OR: 1·30; 95 % CI: 1·14, 1·48, respectively) in comparison with those children and adolescents who did not have these habits.
The consequences associated with the increasing prevalence of overweight among school-aged children end up being shared by society as a whole, therefore, the rise in cases represents not only an individual health problem but also a public health challenge(Reference Se and Guo11). Addressing overweight in children and adolescents is also in line with public policy strategies, such as, at the national level, the Dietary Guidelines for the Brazilian Population(12) and the National Food and Nutrition Policy (PNAN)(13), both of which emphasise the promotion of healthy eating habits. Therefore, understanding the relationship between food consumption in specific meals and overweight in children may contribute to actions aimed at these objectives.
Most of the existing studies assess the association between the energy contribution of dinner and evening snack meals and overweight, however, studies that individually assess the association of the food items/food groups that make up the dinner and evening snack with overweight are still scarce, the present study aimed to verify whether a higher percentage contribution of food items/food groups consumed at dinner and the evening snack is associated with overweight in schoolchildren aged 7 to 14 years from a city in southern Brazil. Our hypothesis is that a higher percentage contribution of consumption from the food groups sweets and treats, snacks and ultra-processed foods, and sugary drinks are positively associated with overweight.
Methods
Design
This is a cross-sectional study that used data from the latest survey (2018/2019) of the Prevalence Study of Obesity in Children and Adolescents (EPOCA). EPOCA is a study of cross-sectional panels, aimed at analysing the trend in the prevalence of obesity and associated factors in schoolchildren aged 7 to 14 years, regularly enrolled the 2nd and 9th grades of primary school, in the morning and afternoon shifts of public (municipal and state) and private schools in Florianopolis(Reference Pereira, Vieira and Belchor14).
Florianopolis is the capital of the state of Santa Catarina (SC) and is located in the southern region of Brazil. The population of the municipality is 537 211 inhabitants. It has the 3rd highest Human Development Index in Brazil (0·847) and an infant mortality rate of 7·73/1000(15).
This study was conducted in accordance with the guidelines established in the Declaration of Helsinki, and all procedures involving human participants were approved by the Research Ethics Committee of the Federal University of Santa Catarina (CAAE: 63089016.9.0000·0121). For the structuring of the manuscript, the checklist Strengthening the Reporting of Observational Studies in Epidemiology – Nutritional Epidemiology (STROBE-nut) for cross-sectional studies was adopted.
Sample selection
The sample size calculation for the EPOCA study was obtained considering an overweight prevalence of 39 %(Reference Corrêa, Rossi and Das Neves16,Reference Luciano, Benedet and De Abreu17) , with a margin of error of 3·5 % and a 95 % confidence interval, requiring 730 schoolchildren. A design effect of 1·8 was considered, along with a 10 % increase in this value to account for losses and refusals, resulting in a final sample size of 2891 schoolchildren. A total of 6133 schoolchildren were invited to participate in the study, however, with the exclusion of those who did not meet the inclusion criteria or had missing data for analysis, the final sample consisted of 1379 schoolchildren. Further details of the sample can be found in online Supplementary Figure 1.
The sampling process was carried out by clusters, and 30 schools were randomly selected, including 19 public and 11 private schools. For the selection of classes (2nd to 9th grade), a random draw was used to select eight classes per school from both shifts, based on the list of available classes at each school. Other details regarding the sampling process and methodology are described in Pereira et al. (Reference Pereira, Vieira and Belchor14).
All students from the selected classes were invited to participate in the research. The inclusion criteria considered schoolchildren who were enrolled between the 2nd and 9th grades of primary school and who had parental and/or guardian consent through the signing of the Informed Consent Form (ICF) and who agreed to participate in the study by signing the Informed Assent Form (IAF). The exclusion criteria considered schoolchildren who did not have a signed authorisation or who refused to participate in any stage of the study. Schoolchildren who, according to reports from parents or teachers, had some type of cognitive impairment that made it impossible to accurately record dietary intake and/or physical activity, or any type of physical disability that prevented the assessment of nutritional status, were not included in the data analyses. Additionally, participants were considered outliers in terms of consumption and excluded from the analysis if they reported a total daily food intake frequency of three or fewer food items or a frequency of food and/or beverage consumption exceeding three times the standard deviation of the average intake(Reference Pereira, Hinnig and Di Pietro18).
Data collection took place between November 2018 and December 2019 and was carried out by a team of previously trained evaluators. Further details about the data collection procedures are described in Pereira et al.(Reference Pereira, Vieira and Belchor14).
Investigated variables
Weight status
All anthropometric data were measured in a private area of the school according to the protocol of the International Society for the Advancement of Kinanthropometry (ISAK)(Reference Marfell-Jones, Stewart and Olds19). Height and body weight were measured using a stadiometer (AlturExata®) and portable digital scale (Marte® model LS200P), respectively. Weight status was assessed using BMI-for-age and classified by Z–score according to the WHO growth curves for ages 5 to 19 years(Reference De Onis, Onyango and Borghi20), using the WHO Anthro Plus software(21). Schoolchildren were classified as overweight When the BMI-for-age Z-scores were > +1, and as underweight or eutrophic when the BMI-for-age Z-scores were ≤ +1.
Food consumption
Data on food consumption were collected through the schoolchildren’s dietary intake and physical activity monitoring system (Web-CAAFE). The Web-CAAFE is a short online self-reported questionnaire regarding the previous day’s intake. The student accesses the questionnaire at school using computers or tablets, through a unique login and password for each survey, school, and time slot, by visiting the website www.caafe.ufsc.br. Throughout the completion of the information, the student is guided and assisted by the Cafito avatar(Reference Da Costa, Schmoelz and Davies22). The questionnaire was evaluated for its validity and reproducibility in two studies, and the results showed that the instrument is precise and accurate(Reference Davies, Kupek and De Assis23–Reference Perazi, Kupek and Assis26).
The Web-CAAFE consists of six meals (breakfast, morning snack, lunch, afternoon snack, dinner, and evening snack) and presents a list of 31 food item icons for each meal, these items were selected based on the dietary patterns of children in this age group and the foods recommended in the guidelines for the Brazilian population, such as the Dietary Guidelines for the Brazilian Population(12,Reference Da Costa, Schmoelz and Davies22) . In this study, the focus was on the dinner and evening snack meals.
From the present study, the 31 food items were grouped into nine categories based on nutritional properties, ingredient similarity, and previous groupings from Web-CAAFE(Reference Pereira, Hinnig and Di Pietro18,Reference Jesus, Assis and Kupek24) , as presented in Chart 1.

It was considered that the dinner and evening snack consumption included any student who had consumed at least one food item during these meals, excluding water. Each food item can be selected only once per meal, with responses for each item being either ‘ate’ (code 1: when the item was selected) or ‘did not eat’ (code 0: when the item was not selected).
The questionnaire was administered in computerised classrooms at the schools, both in the morning and afternoon sessions, and throughout the completion process, trained nutritionists and researchers were present in the room. The data collection took place on weekdays (Monday to Friday), allowing for the acquisition of data from Sunday (representing the weekend) and school days (Monday to Thursday)(Reference Pereira, Vieira and Belchor14).
The Web-CAAFE is a qualitative tool based on the frequency of food consumption from the previous day, and it is not possible to obtain the portion sizes or quantities consumed. Furthermore, it does not allow for the inclusion of the time at which meals were consumed, with the meals being pre-determined in chronological order. Other details about the instrument used can be found on the website www.caafe.ufsc.br.
Potential confounding factors
Maternal education and sleep habits
Socioeconomic and demographic data were provided by the parents/guardians of the students. In this study, the mother’s level of education was used as one of the socioeconomic proxies and was categorized, in years of schooling, as: 0–8, 9–11, and ≥ 12 years.
The questions regarding sleep habits were adapted from the School Sleep Habits Survey (SSHS), developed by Bradley Hospital of Brown University in 1994(Reference Shahid, Wilkinson and Marcu27), and were categorized as adequate (≥ 9 h daily) or inadequate (< 9 h daily)(Reference Hirshkowitz, Whiton and Albert28).
Physical activity and screen use
The data collection regarding these variables was carried out at the same time as the data collection on food consumption using the Web-CAAFE questionnaire. Subsequently to completing the food consumption section, students were presented with 32 items corresponding to physical activity, sedentary, and screen-related activities, consisting of: Basketball/volleyball, tag, football, running, martial arts, tennis, dancing, table tennis, marbles, hopscotch, jumping rope, gymnastics/stretching, playing on the playground, activities in the sea/pool, cycling, rollerblading/scooting, skateboarding, surfing, flying a kite, dodgeball, hide-and-seek, playing with the dog, washing/drying dishes, sweeping the floor, studying/reading and drawing, board games, playing with dolls, playing with cars, listening to music, watching television, using a mobile phone/tablet, using a computer, and playing video games.
After collecting this data, metabolic equivalent (MET) values were assigned to each of the 28 physical activities from the Web-CAAFE according to the Youth Compendium of Physical Activities(Reference Butte, Watson and Ridley29). The energy expenditure was calculated for each activity by multiplying the MET values by the daily frequency (0–3). Total physical activity scores were determined by summing the products of all activities and classified into MET score tertiles. As with the collection of food consumption data, it was not possible to collect information regarding the number of minutes or hours spent on each activity.
For activities involving screen use, such as watching television, using a mobile phone/tablet, using the computer, and playing video games, a specific variable was created to record the frequency of engagement throughout the day, and they were categorised as: Does not use, uses once a day, uses twice a day, uses three or more times a day.
Other adjustment variables used in the present study were sex (male and female), school shift (morning and afternoon), day of consumption report (weekday or weekend), age (categorized as 7–10 years and 11–14 years), and type of school (public and private), which was also used in this study as a socioeconomic proxy.
Statiscal analyses
The analyses were conducted using the Statistical Software for Professionals (Stata®) version 18.0.
The data related to the qualitative variables were described using relative frequency, absolute frequency, and 95 % confidence intervals. The data for the quantitative variables were described as mean and standard error, even if the variable showed asymmetry in the Shapiro-Wilk test, due to the episodic nature of the consumption frequency.
To identify the distribution of food items in each meal, we calculated the percentage contribution of each item to the meal. This contribution was calculated by taking the average frequency of the item’s consumption in the meal, divided by the average consumption of the food item throughout the day by the students who had the meal, and then multiplying by 100 %.
To assess the percentage concentration of a specific food group in dinner and evening snack (nighttime period), the sum of the frequency of consumption of that food group in these meals was calculated, divided by the total consumption of the same group throughout the day. Differences in the concentrations of food groups during the nighttime period between students with and without overweight were assessed using univariate logistic regression.
To assess the association between the percentage contribution of food groups (independent variable) in dinner, evening snack, and both meals combined, with overweight (dependent variable), multivariate logistic regression was performed for each of the meals, with variables introduced sequentially using a forward selection procedure to evaluate their independent effects. The percentage contribution of consumption was classified as below and above the median of dinner, evening snack, and the combined dinner and evening snack. The percentage contribution was also assessed as below and above 50 % for the combined dinner and evening snack to check whether the associations changed when the consumption was greater than 50 % of the total consumption during the nighttime period.
The analyses were adjusted for sex, age, school shift, type of school, mother’s education, sleep duration, physical activity, screen time usage, and the day of the week the Web-CAAFE was reported. The percentage contribution of the food group during the rest of the day was also added as an adjustment to verify whether there is an association independent of the consumption of the food group during other periods of the day. For example, when evaluating the percentage contribution of the food group in the dinner meal, we used as an adjustment the variable composed of the percentage contribution of that group during the other meals of the day (breakfast, morning snack, lunch, afternoon snack, and evening snack), excluding the dinner meal.
Additionally, an interaction analysis was conducted between the percentage contribution of food group consumption in these meals and the students’ age to assess whether the association changes depending on the students’ age.
Given the complexity of the study’s sampling, the sample weight was used in the analysis using the ‘svy’ command. We used a P-value of < 0·05 for statistical decision-making.
Results
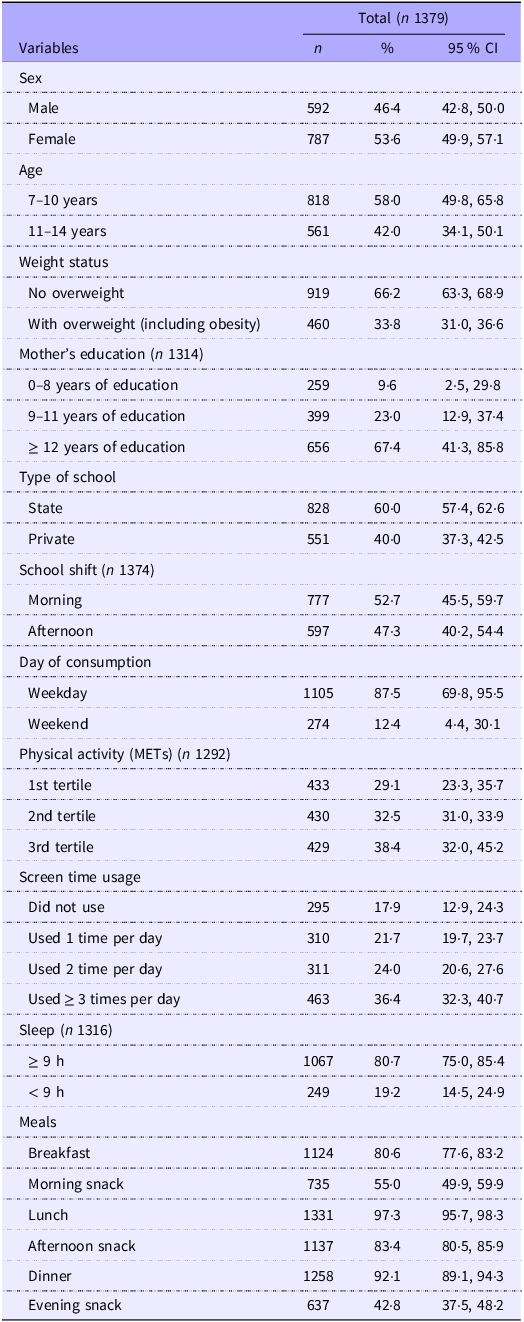
In the present study, we evaluated 1379 schoolchildren, the majority of whom were female (53·6 %), were aged between 7 and 10 years (58 %), and had a prevalence of overweight of 33·8 %. Regarding growth indicators, the mean height-for-age Z-score was 0·31 (95 % CI: 0·21, 0·41; standard error: 0·43), and the mean BMI-for-age Z-score was 0·48 (95 % CI: 0·42, 0·54; standard error: 0·027), these data are not presented in a table. Regarding the mother’s education, 67·4 % had 12 years or more of schooling, and the majority of the schoolchildren attended public schools (60 %) and were in the morning shift (52·7 %). The majority of the schoolchildren (87·5 %) reported food consumption on weekdays, and when screen time use was assessed, 36·4 % used screens three or more times a day.
Regarding sleep, 80·7 % of the schoolchildren had an adequate sleep duration (≥ 9 h). When the meals consumed were assessed, the highest consumption was reported for lunch (97·3 %), followed by dinner (92·1 %) and breakfast (83·4 %). In relation to snacks, a higher percentage of schoolchildren had an afternoon snack (83·4 %), followed by a morning snack (55 %) and an evening snack (42·8 %) (Table 1).
Description of schoolchildren aged 7 to 14 years according to their sociodemographic and behavioural characteristics from the EPOCA study 2018/2019. Florianópolis, Santa Catarina

Table 1 Long description
A table with 13 rows and 5 columns summarizing sociodemographic and behavioral characteristics of schoolchildren aged 7 to 14 years. The columns are labeled Variables, n, percent, and 95 percent CI. The table includes data on sex, age, weight status, mother's education, type of school, school shift, day of consumption, physical activity, screen time usage, sleep, and meals. Each row provides specific details under these categories. For example, the sex row shows 592 males (46.4 percent) and 787 females (53.6 percent). The age row indicates 818 children aged 7-10 years (58.0 percent) and 561 children aged 11-14 years (42.0 percent). The weight status row shows 919 children with no overweight (66.2 percent) and 460 with overweight (33.8 percent). The mother's education row includes 259 mothers with 0-8 years of education (9.6 percent), 399 with 9-11 years (23.0 percent), and 656 with 12 or more years (67.4 percent). The type of school row shows 828 children in state schools (60.0 percent) and 551 in private schools (40.0 percent). The school shift row indicates 777 children in the morning shift (52.7 percent) and 597 in the afternoon shift (47.3 percent). The day of consumption row shows 1105 children consuming on weekdays (87.5 percent) and 274 on weekends (12.4 percent). The physical activity row includes 433 children in the 1st tertile (29.1 percent), 430 in the 2nd tertile (32.5 percent), and 429 in the 3rd tertile (38.4 percent). The screen time usage row shows 295 children not using screens (17.9 percent), 310 using screens once per day (21.7 percent), 311 using screens twice per day (24.0 percent), and 463 using screens three or more times per day (36.4 percent). The sleep row indicates 1067 children sleeping 9 or more hours (80.7 percent) and 249 sleeping less than 9 hours (19.2 percent). The meals row shows 1124 children eating breakfast (80.6 percent), 735 eating a morning snack (55.0 percent), 1331 eating lunch (97.3 percent), 1137 eating an afternoon snack (83.4 percent), 1258 eating dinner (92.1 percent), and 637 eating an evening snack (42.8 percent).
95 % CI, 95 % Confidence Interval; METs, Metabolic Equivalent of Task.
Food consumption and contribution in dinner and evening snack
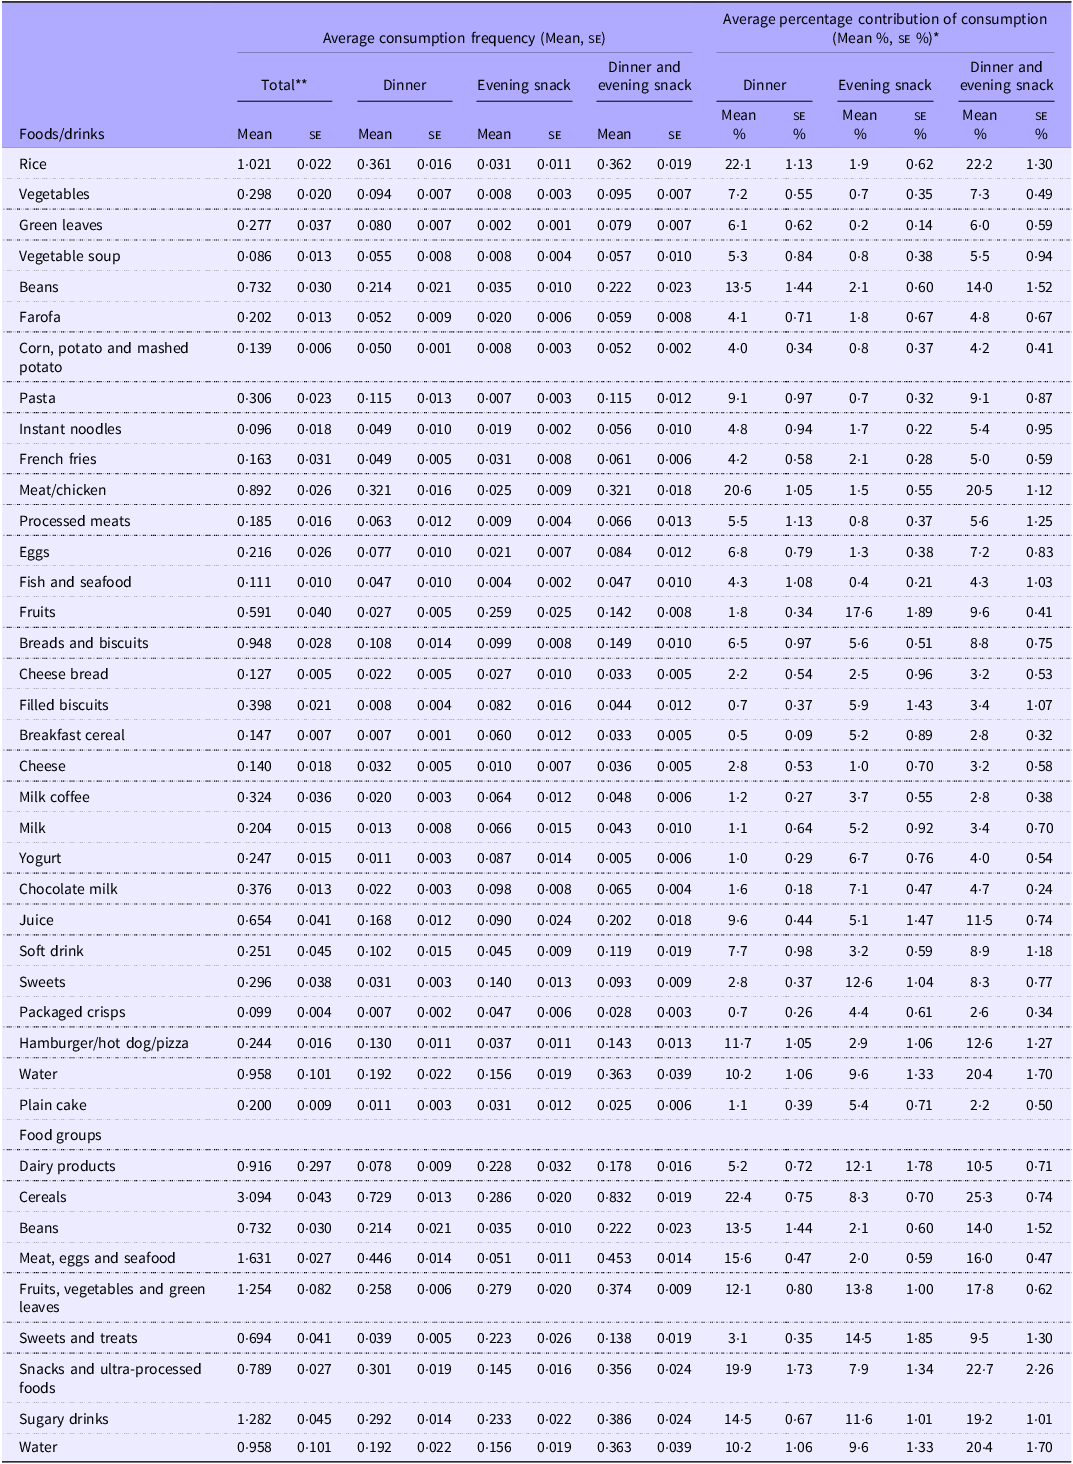
Regarding the dinner meal, the three food items with the highest average consumption frequency and highest average percentage contribution were rice (μ = 0·361; μ = 22·1 %), meat/chicken (μ = 0·321; μ = 20·6 %) and beans (μ = 0·214; μ = 13·5 %); for the evening snack, fruits (μ = 0·259; μ = 17·6 %), water (μ = 0,156; μ = 9·6 %) and sweets (μ = 0·140; μ = 12·6 %); and for the combined dinner and evening snack, they were water (μ = 0·363; μ = 20·4 %), rice (μ = 0·362; μ = 22·2 %), and meat/chicken (μ = 0·321; μ = 20·5 %).
Regarding the food groups, cereals were the group with the highest average consumption frequency for dinner, evening snack, and the combined dinner and evening snack (μ = 0·729; μ = 0·286; μ = 0·832, respectively). The highest average percentage contributions were for cereals (μ = 22·4 %) at dinner, sweets and treats (μ = 14·5 %) at the evening snack, and again cereals (μ = 25·3 %) for the combined dinner and evening snack (Table 2).
Description of the average consumption frequency and the average percentage contribution of consumption of food items and food groups in dinner, evening snack, and combined dinner and evening snack, of schoolchildren aged 7 to 14 years from the EPOCA study 2018/2019. Florianopolis, Santa Catarina

*Percentage contribution calculated by the average consumption of each item or food group at dinner, evening snack, and the combined dinner and evening snack, divided by the average consumption of the item or food group throughout the day, multiplied by 100; **Average consumption frequency of food items and food groups throughout the day.
Additionally, we highlight that, compared to the other food groups, snacks and ultra processed foods at dinner (μ = 19·9 %) and the combined dinner and evening snack (μ = 22·7 %) and sugary drinks in the dinner and evening snack combined meal (μ = 19·2 %) also showed high average percentage contributions to consumption.
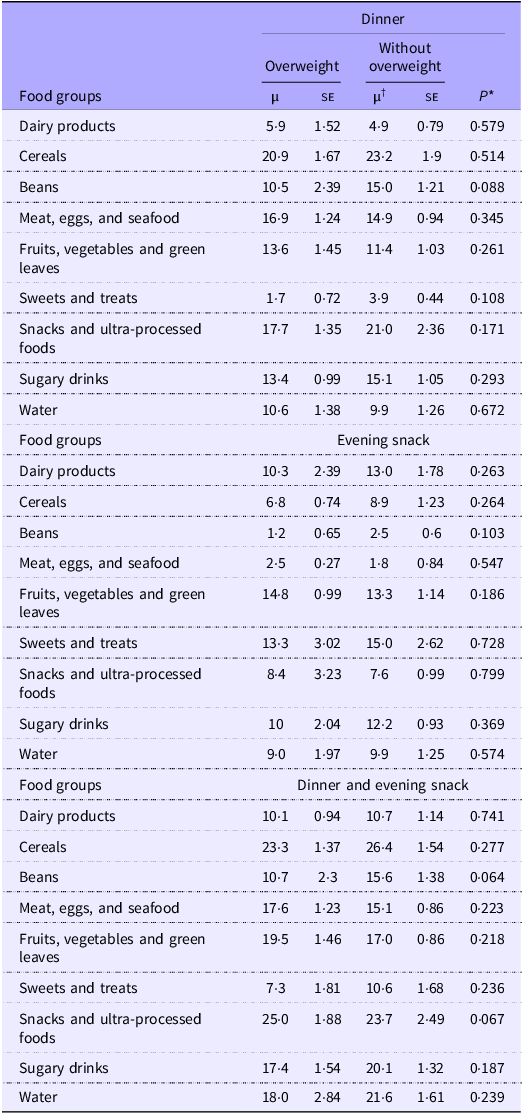
Table 3 describes the average percentage contribution of food groups at dinner, evening snack, and combined dinner and evening snack, stratified by overweight. Despite the higher percentage contribution of meat, eggs, and seafood, as well as fruits, vegetables, and legumes at dinner and at the evening snack, and of snacks and ultra-processed foods in the combined dinner and evening snack among overweight schoolchildren, no significant differences were found compared to those without overweight.
Description of the average percentage (%) contribution of food group consumption at dinner, evening snack, and combined dinner and evening snack, stratified by overweight, among schoolchildren aged 7 to 14 years from the EPOCA study 2018/2019. Florianopolis, Santa Catarina

Table 3 Long description
The table presents the average percentage contribution of various food groups consumed at dinner, evening snack, and combined dinner and evening snack, stratified by overweight status among schoolchildren aged 7 to 14 years. The table has 11 rows and 8 columns. The columns are labeled as follows: Food groups, Dinner Overweight (μ, SE), Dinner Without overweight (μ†, SE), P*, Evening snack Overweight (μ, SE), Evening snack Without overweight (μ†, SE), P*, Dinner and evening snack Overweight (μ, SE), Dinner and evening snack Without overweight (μ†, SE), P*. The food groups listed include Dairy products, Cereals, Beans, Meat, eggs, and seafood, Fruits, vegetables and green leaves, Sweets and treats, Snacks and ultra-processed foods, Sugary drinks, and Water. Each row provides the average percentage contribution (μ) and standard error (SE) for overweight and without overweight categories, along with P-values indicating statistical significance. Notable trends include higher percentages of meat, eggs, and seafood, as well as fruits, vegetables, and legumes at dinner and evening snack, and snacks and ultra-processed foods in the combined dinner and evening snack among overweight schoolchildren, though no significant differences were found compared to those without overweight.
*Univariate logistic regression test performed.
†Sample mean.
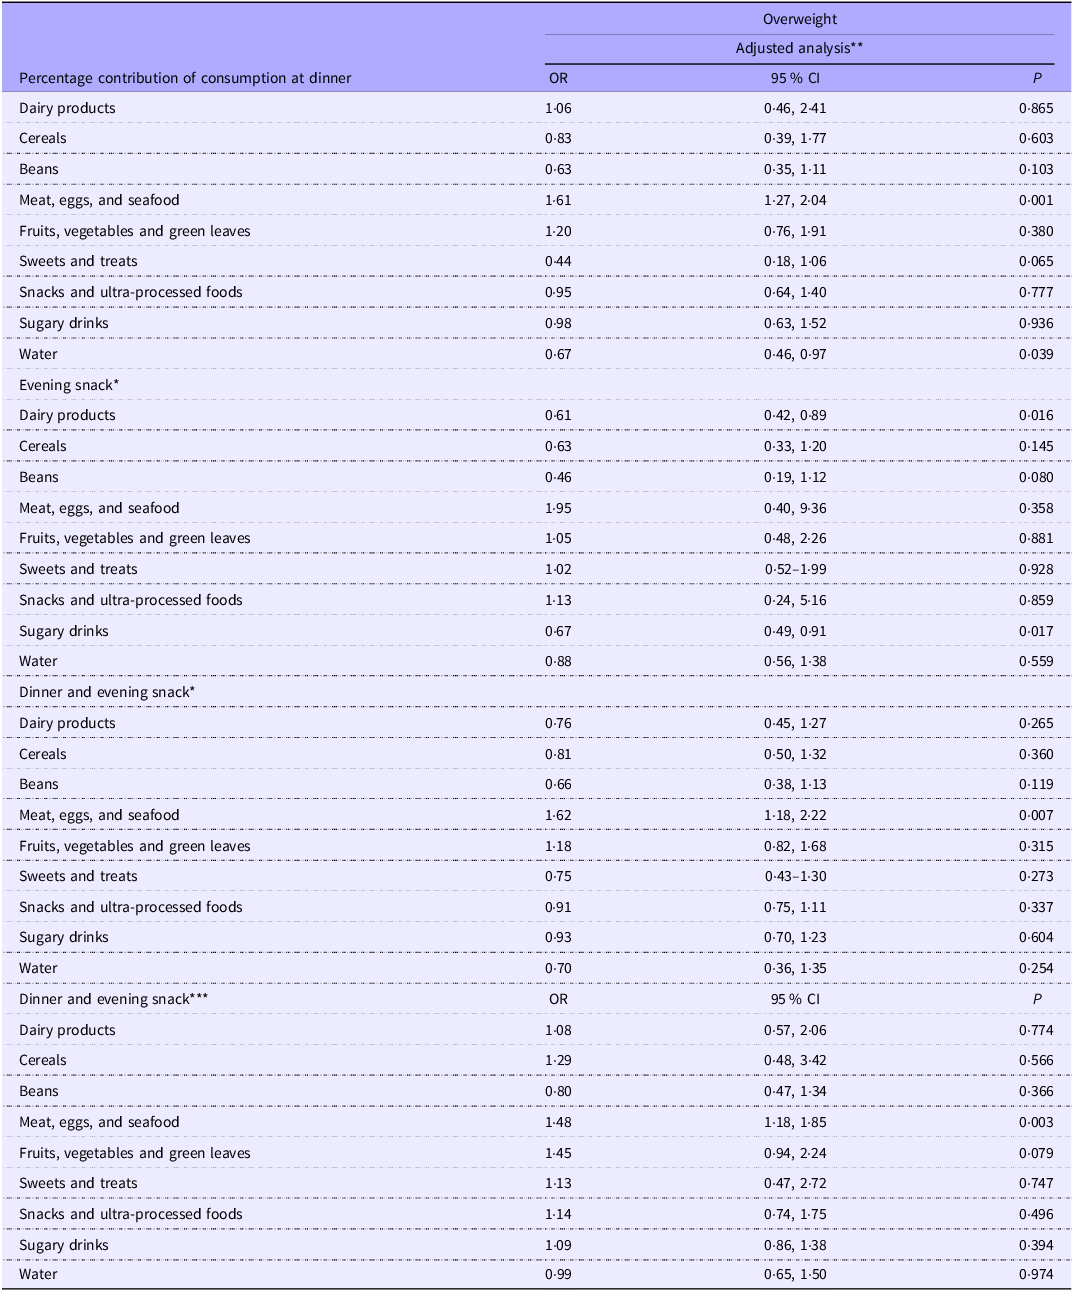
Performing the multivariate logistic regression, we found a significantly positive association between the consumption of meat, eggs, and seafood above the median percentage contribution at dinner (P = 0·001) and overweight, compared to the percentage contribution below the median at this meal. When analysing the percentage contribution of consumption for the combined dinner and evening snack, we observed a higher likelihood of overweight in schoolchildren with a percentage contribution greater than 50 % in the meat, eggs, and seafood group, compared to those with a lower contribution (P = 0·003).
Negative associations were observed between water consumption (P = 0·039) at dinner, and dairy products consumption (P = 0·016) and sugary drinks consumption (P = 0·017) at the evening snack, with overweight (Table 4).
Association of the percentage contribution of food group consumption at dinner, evening snack, and combined dinner and evening snack with overweight in schoolchildren aged 7 to 14 years, Florianopolis, Santa Catarina, 2018/2019

Table 4 Long description
The table presents the association of the percentage contribution of food group consumption at dinner, evening snack, and combined dinner and evening snack with overweight in schoolchildren aged 7 to 14 years. It has 12 rows and 6 columns. The columns are labeled as Percentage contribution of consumption at dinner, OR, 95 % CI, and P. The rows are labeled with different food groups: Dairy products, Cereals, Beans, Meat, eggs, and seafood, Fruits, vegetables and green leaves, Sweets and treats, Snacks and ultra-processed foods, Sugary drinks, and Water. The table is divided into three sections: Dinner, Evening snack, and Dinner and evening snack. Each section shows the odds ratio (OR), 95 percent confidence interval (CI), and P-value for each food group. Notable trends include negative associations observed between water consumption at dinner, and dairy products and sugary drinks consumption at the evening snack, with overweight.
OR, Odds ratio; 95 % CI, 95 % Confidence interval; *Percentage contribution assessed as below or above the median, with the reference group being below the median; **Adjusted for the percentage contribution of the food group for the rest of the day, sex, age, weight status, mother’s education level, day of consumption, physical activity tertile, screen time, sleep, type of school, and school shift; ***Percentage contribution assessed as below or above 50 %, with the reference group being below 50 %.
After performing the interaction analysis between the percentage contribution of food groups at dinner, evening snack, and combined dinner and evening snack, with the age of the schoolchildren, a higher likelihood of overweight was observed in girls with a greater contribution of fruits, vegetables and green leaves at dinner compared to boys with a lower contribution of this food groups (OR: 1·43; P = 0·048) (data not shown in tables).
Discussion
To the best of our knowledge, this is the first study to evaluate whether the percentage contribution of food items/groups at dinner and evening snack is associated with overweight in Brazilian schoolchildren aged 7 to 14 years. Key findings include: (1) the highest average percentage contributions of food items at dinner were rice, meat/chicken, and beans; at the evening snack, they were fruits, sweets and water; and for the combined dinner and evening snack, they were rice, meat/chicken, and water. For food groups, cereals had the highest contributions at dinner and combined dinner and evening snack; while sweets and treats were the highest at the evening snack; (2) a positive association was found between the consumption of meat, eggs, and seafood and overweight at dinner and combined dinner and evening snack, while a negative association was observed between water consumption at dinner and dairy products and sugary drink consumption at the evening snack with overweight.
In the present study, the highest average percentage contributions of food items to the evening meals were rice, meat/chicken, water, beans, fruits, and sweets. Corroborating our findings, research conducted in Florianopolis/SC with schoolchildren aged 7–13 years also found that rice, beans, and meat/chicken were among the food items most frequently mentioned as being consumed at dinner(Reference Cezimbra, Assis and De Oliveira30,Reference Kupek, Lobo and Leal31) . For the evening snack, Taillie et al.(Reference Taillie, Afeiche and Eldridge32), in a study conducted in Mexico, also found a higher frequency of sweet consumption at this meal among children and adolescents aged 2–13 years, and a higher frequency of sweet and fruits among children and adolescents aged 6–13 years.
Higher average percentage contributions of consumption in food groups such as cereals at dinner and combined dinner and evening snack, and sweets and treats at the evening snack were also observed. In a study with schoolchildren aged 7–12 years in Florianopolis, southern Brazil, some of the dietary patterns identified for dinner included the ‘Traditional Brazilian’ and the ‘Mixed’ patterns, which consisted of foods such as rice, manioc flour, corn/potatoes, pasta and cheese bread(Reference Roberto, Kupek and De Assis33). It is worth noting that the food items mentioned are part of the cereal food group in our study, corroborating the results found. For the evening snack, a study conducted in the USA with preschoolers and schoolchildren aged 4–13 years showed that the most consumed food group was ‘snacks and sweets’, consisting of food items such as sweets, other desserts, and biscuits, for example(Reference Wang, Van Der Horst and Jacquier34).
Our findings suggest that the consumption of meat, eggs, and seafood at dinner and combined dinner and evening snack is positively associated with overweight, and that the consumption of water at dinner, and dairy products and sugary drinks at the evening snack are negatively associated with overweight. However, comparing our findings with the literature is challenging due to the lack of studies linking the consumption of these food groups at dinner and evening snack with overweight. Studies have observed this association for overall daily food consumption. A study conducted with preschoolers under the age of 5 in Egypt observed that the provision of foods such as meat and eggs throughout the day was positively associated with overweight(Reference Osei Bonsu and Addo35). Additionally, Fogelholm et al.(Reference Fogelholm, Anderssen and Gunnarsdottir36), in a systematic review, showed that a higher intake of meat, poultry, and processed meats was associated with an increase in weight and/or waist circumference in adults.
Food items such as meat are considered energy-dense foods, so a higher consumption of this food group may increase the energy intake of individuals(Reference Vergnaud, Norat and Romaguera37). Additionally, studies show that meals consumed after 15.00, and a later bedtime, are associated with higher energy intake during the evening(Reference Mahdi, Dickerson and Infield Solar38–Reference Spaeth, Hawley and Raynor40), which may result in greater fat storage, potentially being one of the interconnected factors in the development of overweight(Reference Garaulet and Gómez-Abellán41).
It should be noted that the consumption of meat and eggs, frequently combined with foods such as beans and rice, characterises a habitual dietary pattern among the Brazilian population(12). Accordingly, the portion sizes of meat, eggs, and seafood consumed may have influenced the associations observed with overweight in the present study. However, the Web-CAAFE questionnaire does not allow for the collection of information on the quantities consumed, providing only data on consumption frequency.
Some studies have found results similar to ours regarding the consumption of dairy products and water. A study conducted with data from adolescent schoolchildren in the Healthy Lifestyle in Europe by Nutrition in Adolescence study found that higher overall dairy consumption was associated with a lower BMI, reduced skinfold thickness, and smaller waist circumference(Reference Moreno, Bel-Serrat and Santaliestra-Pasías42). Feng et al.(Reference Feng, Zhao and Liu43), in a systematic review and meta-analysis, presented studies where an increase of 200g/day in total dairy and milk respectively reduced the risk of overweight by 27 % and 12 %. Another systematic review and meta-analysis found that an increase of 1 serving of dairy per day reduced the risk of overweight in the child population by 13 % (OR: 0·87)(Reference Lu, Xun and Wan44).
Some micronutrients such as calcium, vitamin D, magnesium, potassium, and even whey protein have been investigated as components that have a favourable impact on the prevention of overweight. Studies show that they may increase insulin secretion and sensibility and reduce resistance to this hormone, additionally, calcium also plays an important role in reducing lipogenesis(Reference Moreno, Bel-Serrat and Santaliestra-Pasías42–Reference Babio, Becerra-Tomás and Nishi45).
Regarding water consumption, Muckelbauer et al.(Reference Muckelbauer, Libuda and Clausen46), in a randomised clinical trial conducted with schoolchildren in schools in Germany, with the primary objective of promoting water consumption, found that the risk of overweight in the follow-up assessment was significantly reduced in the intervention group (the group in which water consumption was encouraged) compared to the control group (OR: 0·69).
As a possible explanation for the inverse or negative association between water consumption and overweight, studies show that its intake throughout the day may indicate a long-term reducing effect on energy intake(Reference Andersen, Arnberg and Trolle47), it may act as a substitute for the consumption of other beverages with higher energy density. Furthermore, water consumption could also contribute to weight maintenance by increasing energy expenditure through induced thermogenesis(Reference Dubnov-Raz, Constantini and Yariv48). Therefore, in our study, a higher average water consumption during the dinner meal may be associated with a lower energy intake from other foods.
Considering the findings in the literature, where the consumption of sugary drinks is positively associated with overweight among children and adolescents(Reference Dubois, Farmer and Girard49,Reference Bleich and Vercammen50) , it would be expected to observe results in line with other studies, however, a contrary result was observed, showing a negative association. A possible explanation for this finding may be related to the fact that, among the three food items that make up the ‘sugary drinks’ food group, juice was the one that showed the highest average percentage contribution to dinner and to the combined dinner and evening snack (9·6 % and 11·5 %, respectively). As it is not possible to obtain data on the food processing through the Web-CAAFE, we were unable to distinguish between the consumption of fresh juices and processed or ultra processed juices, which may influence the observed results. Moreover, it should be emphasised that, although the present study identified similar associations between water and sugary drinks intake in relation to overweight, the two exhibit distinct nutritional and metabolic effects within the body.
The observed findings may also reflect reverse causality due to the cross-sectional design of the study, as children with overweight may already be receiving specific dietary guidance, which could be similar to the result observed regarding the higher likelihood of overweight among girls who have a higher contribution of fruit, vegetable, and green leaves consumption at dinner.
Accordingly, it is recommended that future longitudinal studies differentiate sugary drinks by their degree of processing, in order to clarify whether the inverse associations observed persist.
In addition, metabolic mechanisms related to chrononutrition and circadian rhythms may influence the findings of this study. Evidence indicates that the circardian system, regulated by central and peripheral clocks, responds to stimuli such as food intake, sleep and physical activity, modulating behaviours and metabolic processes, including energy metabolism. In this context, meal timing and food composition may promote circadian misalignment, which has been associated with an increased risk of overweight, even in the absence of changes in total energy intake(Reference Cedernaes, Waldeck and Bass51–Reference Jiang and Turek53). Changes in the circadian timing of food intake may affect hormonal rhythmicity, such as reduced glucose tolerance and increased insulin resistance during the night-time period(Reference Morris, Aeschbach and Scheer54), as well as alterations in leptin and ghrelin levels, impacting the regulation of energy intake and expenditure(Reference Bo, Fadda and Castiglione55). Thus, studies suggest that energy metabolism is less efficient at night, reinforcing that body weight is influenced not only by the quantity of food consumed, but also by the timing of food intake(Reference Jiang and Turek53,Reference Bo, Fadda and Castiglione55) .
The present study has some limitations, including the cross-sectional nature of the study, the low prevalence of schoolchildren who had the evening snack meal, which may have contributed to the findings, and the use of data related to food consumption from only one day, which may not reflect habitual intake and could represent an atypical day of meals, but the Web-CAAFE was applied on different days of the week to minimise bias and reflect the variation in the diet in terms of the collective. However, this method is widely accepted for assessing dietary intake and the frequency of meals/snacks at the population level(Reference Lobo, De Assis and Leal56).
Moreover, through the Web-CAAFE questionnaire, it is only possible to obtain data on the frequency of consumption of a particular food, making it impossible to assess the quantity consumed, which limited the evaluation of the energy contribution per meal and for the entire day. It is also not possible to obtain data regarding the preparation method of foods and the level of processing of some foods, limiting the ability to assess whether the preparation method of a particular item/food group could influence the overweight of schoolchildren, or even the possibility of classifying the consumed item/food groups based on their degree of processing, such as the case with meats, sugary drinks, and dairy products, for example. Additionally, it is also not possible to estimate the time at which the meals were consumed.
The strengths of the study include the representativeness of the sample in terms of sex and school type, the use of a validated instrument for data collection, the anthropometric assessment being carried out by properly trained and standardized researchers, and the association being made with adjustment for confounding variables.
The findings suggest association between the percentage contribution of evening meals that contribute to overweight, such as the higher percentage contribution of meat, eggs, and seafood consumption at dinner, and associations that contributed inversely, such as the percentage contribution of dairy products and water. The inverse association between the percentage contribution of sugary drinks in the evening snack and overweight observed was contrary to our hypothesis and warrants caution, as studies have shown a positive association with overweight. Therefore, the importance of guidance on limiting the consumption of sugary drinks, especially ultra-processed ones, is emphasised(12). It is important to assess the overall context of schoolchildren’s diet throughout the day for more comprehensive conclusions, and we suggest conducting further studies on this topic, particularly with an emphasis on the foods that make up evening meals. Furthermore, the findings of this study may support strategies that promote healthy eating, both within schools and at home, as well as guide public policies aimed at preventing childhood overweight and promoting food and nutrition education, contributing to clinical practice and the planning of health interventions, taking into account the timing of meals.
Supplementary material
For supplementary material/s referred to in this article, please visit https://doi.org/10.1017/S0007114526106436
Acknowledgements
The authors would like to thank all the parents and/or guardians and school authorities for agreeing to participate and contribute to the development of this study.
This study received financial support from the Foundation for Support of Research and Innovation of Santa Catarina (FAPESC), Brazil, under process number 2017TR1759.
M. L. V. G: Conducted to research, formal analysis and prepared this manuscript; L. J. P. e F. G. K. V: Contributed to the preparation of this manuscript; P. F. H: Contributed to the supervision of the research, the preparation of this manuscript and assisted in the data analysis of the study.
The authors declare that they have no conflicts of interest.