Introduction
In many traditional human societies, which are often polygynous hunter–gatherers and herders, but also in monogamous pre-industrial societies, male status is positively associated with reproduction (Irons, Reference Irons1979; Mealey, Reference Mealey1985; Borgerhoff Mulder, Reference Borgerhoff Mulder1988; Changnon, Reference Chagnon1988; Cronk, Reference Cronk1989; Voland, Reference Voland1990). In modern Western societies as well, it has recently been demonstrated that socioeconomic status, as measured by personal income and education, is positively associated with reproduction in male individuals (Fieder et al., Reference Fieder, Huber, Bookstein, Iber, Schäfer, Winckler and Wallner2005; Fieder & Huber, Reference Fieder and Huber2007a; Hopcroft, Reference Hopcroft2006, Reference Hopcroft2015; Nettle & Pollet, Reference Nettle and Pollet2008). This relationship is primarily caused by a higher number of childless individuals among men of low status (Fieder et al., Reference Fieder, Huber, Bookstein, Iber, Schäfer, Winckler and Wallner2005, Reference Fieder, Huber and Bookstein2011; Fieder & Huber Reference Fieder and Huber2007a; Nettle & Pollet Reference Nettle and Pollet2008).
In women, the relationship between income, education and reproduction appears to be null or negative (Fieder et al., Reference Fieder, Huber, Bookstein, Iber, Schäfer, Winckler and Wallner2005, Fieder & Huber, Reference Fieder and Huber2007a; Hopcroft, Reference Hopcroft2006, Reference Hopcroft2015; Nettle & Pollet, Reference Nettle and Pollet2008). Nonetheless, in the most highly educated US women, the association between women’s number of children and their husbands’ incomes is positive. In all US women, there is also an increase in childlessness with decreasing husband income, irrespective of educational level (Huber et al., Reference Huber, Bookstein and Fieder2010). Accordingly, it pays off, reproductively, for a woman to choose a man of higher socioeconomic status (SES).
Also cross-culturally, the association between male SES mating and reproductive success can be explained by women’s preference for high-status men, as has been demonstrated for such diverse countries as Brazil, Mexico, Panama, South Africa and Venezuela. Again, in these samples, men of low SES remain significantly more often unmarried and childless (Fieder et al., Reference Fieder, Huber and Bookstein2011).
What is less clear is how the traditions of monogamy versus polygyny affect the association between status and reproductive success in males as well as in females. Most studies on the association between male SES, mating success and reproduction in modern societies are based on data from Western societies. In these countries, monogamy is mostly strictly enforced by law. In addition, most individuals adhere to Christianity where monogamy is obligatory. On the other hand, data on polygyny are missing for most countries. Yet the distinction along religious cultures may provide at least a crude proxy for monogamous vs polygynous traditions as Muslims in contrast to the overwhelming majority of Christians have a tradition of polygyny: Quran verse 3, Sura 4: ‘a man having adequate resources may marry up to 4 wives, that should be treated equally’. Accordingly, although in many Muslim countries polygyny is official banned or strongly limited (for instance in Turkey and Indonesia; Sigman, Reference Sigman2006), polygyny still exists although valid data on the frequency of polygyny for a reasonable number of countries worldwide are rare. Chamie (Reference Chamie1986) reported a frequency of polygynous men of between 3% and 12% in Arabic countries, with a higher frequency of polygynous marriages found by Obermeyer (Reference Obermeyer1992) among the rural population. Even in Turkey, where polygyny is prohibited by law, polygyny still exists in some of the eastern, more rural parts of the country (Ilkkaracan, Reference Ilkkaracan2001). Also, in southern Jordan, Sueyoshi and Ohtsuka (Reference Sueyoshi and Ohtsuka2003) found a polygynous marriage prevalence of 28%. In line with Henrich et al. (Reference Henrich, Boyd and Richerson2012), a quite small prevalence of polygyny will have a dramatic effect on the marriage probability of men. It can therefore be expected that the principal allowance of polygyny in Muslims should have a considerable effect on their marital patterns.
Certainly, the distinction by religion is only rough and some overlap is inevitable, as there are, for instance, some exceptions to Christian monogamy. For example, in Africa, with its long tradition of polygyny, some parts of the Christian population practise polygyny (Caldwell & Caldwell, Reference Caldwell and Caldwell1987; Falen, Reference Falen2008). Also, some fundamentalist Mormon churches still adhere to polygyny (Flake, Reference Flake2005), even though most Mormon communities have abolished polygyny since the end of the 19th century and now practise monogamy.
As data on polygyny are either missing or, if they exist, are incomplete for most countries, in this study religion (i.e. Christian vs Muslim) was used as an indicator for a tradition of monogamy vs polygyny, keeping in mind that the distinction between Christians and Muslims may only provide a rough proxy. On the basis of census data from 39 different countries the study investigated i) whether these religious traditions may affect marriage patterns (i.e. remaining unmarried vs being married at least once) of men and women, and ii) how these relate to socioeconomic status. In addition, whether a person was married or not at a certain age was analysed (separately for sex and religion) by SES (according to education and employment) and region (rural vs urban). Cross-cultural data were used as longitudinal data were not available in sufficient quality and quantity.
In a society with a tradition of polygyny, a lower proportion of men compared with women who are married in a certain age group would be expected. In addition, a positive association between SES and marriage probability would be expected in men, with higher SES prerequisites for entering marriage expected for Muslim vs Christian men (Gibson & Mace, Reference Gibson and Mace2007; Pollet & Nettle, Reference Pollet and Nettle2009; Henrich et al., Reference Henrich, Boyd and Richerson2012). In women, a negative association between SES and marriage would be expected, with stronger negative effects expected for Muslim vs Christian women due to the patriarchal political traditions in Muslim societies (Henrich et al., Reference Henrich, Boyd and Richerson2012).
Methods
Census data from 39 countries provided by IPUMS International (https://international.ipums.org/international/) were used to investigate the association between sex, religion (Muslim vs Christian) and progression into marriage. The general categorization of religion as ‘Christian’ as well as ‘Muslim’ provided by IPUMS International was used. The most recent census data set available for each country was analysed, but due to reasons of comparability only if the data were from the 21th century.
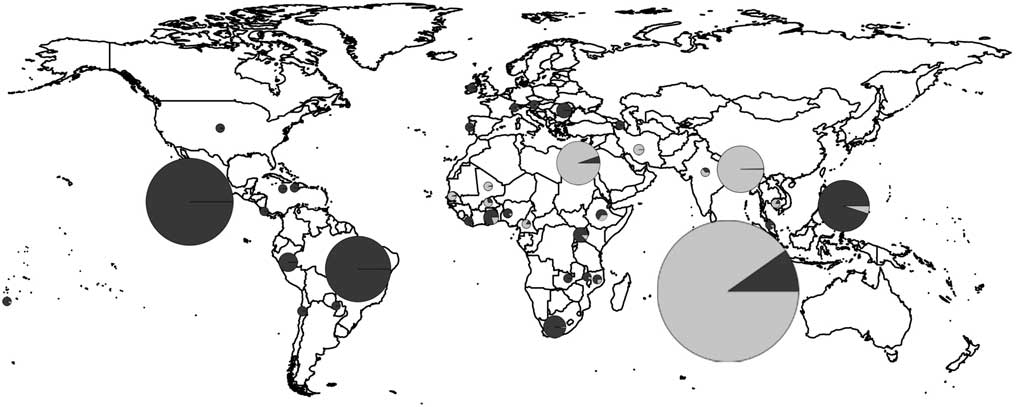
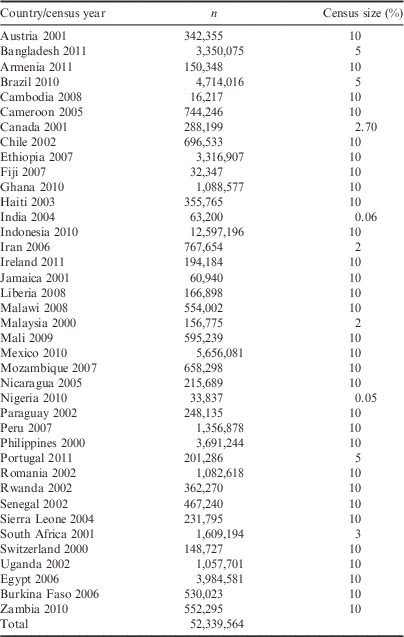
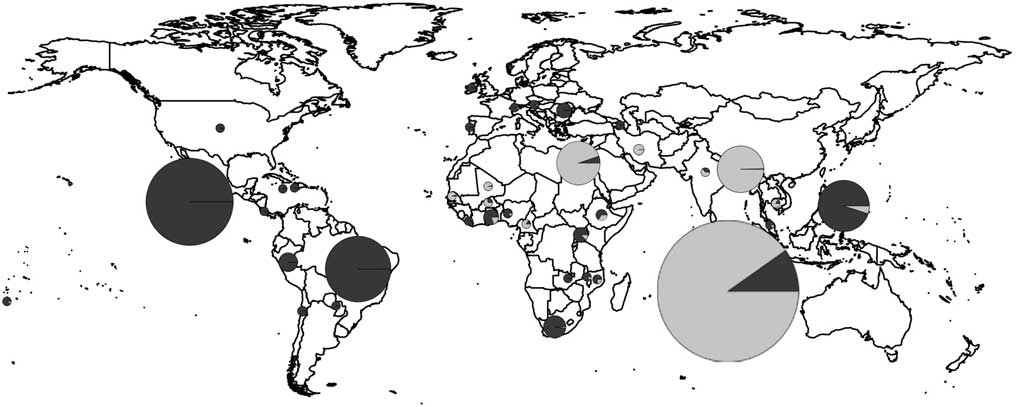
The whole data set, encompassing 14,068,864 Christian men, 15,014,365 Christian women, 11,560,985 Muslim men and 11,695,350 Muslim women (in total 52,339,564 individuals) aged from 15 to 49 years, was divided into seven age groups (1: 15–19, 2: 20–24, 3: 25–29, 4: 30–34, 5: 35–39, 6: 40–44, 7: 45–49). Table 1 and Fig. 1 show the number of cases and proportion of Christians vs Muslims. To ensure only small fluctuations in the frequencies of religious denominations, analyses were limited to censuses from 2000 to 2011, as in most countries the relative frequency of religious denominations is rather stable for a time frame of about 10 years. For instance, by comparing the relative frequency of religious denominations between a 2000 census and a census approximately 10 years earlier, the fluctuation is usually less than 5%.
Proportion of Christians vs Muslims in the countries included (Christians=black, Muslims=grey). The radius of each pie chart reflects the size of the sample scaled by the largest sample (Indonesia – largest pie chart). To improve visibility, samples smaller that 10% of Indonesia have been rounded up to 10% of Indonesia.
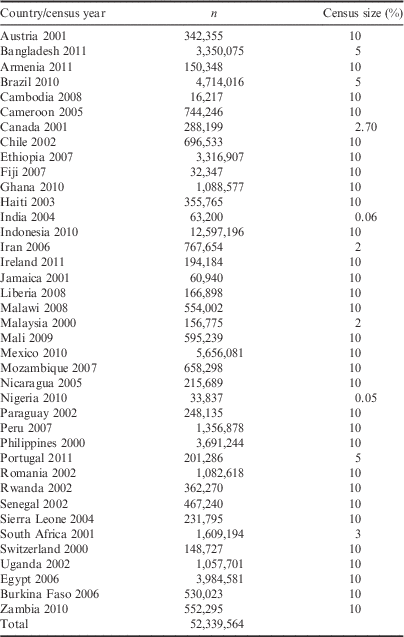
Country and census year, number of cases (n) and original census sample size as a percentage of total population
Analyses included: age in years at the time of the census survey; highest education encoded by IPUMS International as 1=less than primary school completed, 2=primary school completed, 3=secondary school completed, 4=university completed; sex and religion encoded as 1=Christian men, 2=Muslim men, 3=Christian women, 4=Muslim women; living area encoded as 0=rural, 1=urban, provided by IPUMS International, noting that the definition of ‘urban’ varies significantly among countries; in some cases, the definition is based on a population threshold or other measurable criteria, and in other cases the categorization is a consequence of administrative classification; employment at the time of the census survey encoded as 0=not employed, 1=employed; marital status encoded as 0=never married, 1=married at some point (this includes currently married, separated, divorced and widowed); migration within the last 5 years encoded as 0=the person did not migrate or only within a country, 1=the person migrated from a foreign country in the last 5 years; and sex ratio (men/(men+women)) separately for each country and each of the seven age groups. To avoid multicollinearity in the model (it was checked in R, by calculating the Variance Inflation Factor, provided by the library car), the continuous variables age and sex ratio were scaled: each value was transformed by subtracting the overall mean and dividing it by the overall standard deviation.
All analyses were done using R version 3.2.3 (R Development Core Team: http://www.R-project.org). The percentage of unmarried individuals for each year of age was plotted by sex and religious affiliation. As the progression into marriage with increasing age is clearly non-linear (Fig. 2) and linearization (Zuur et al., Reference Zuur, Ieno, Walker, Saveliev and Smith2009) would have led to a loss of relevant information, as well as the residuals of age clearly behaving non-linearly (data not shown), a generalized additive mixed model was calculated using the R-library ‘mgcv’ and the function ‘bam’ (the function ‘bam’ was used as this is able to handle large data sets) of education, sex and religion, employment, migration status, living in a rural vs urban area, age grouped by sex and religion (first additive non-linear term), as well as sex ratio grouped by sex and religion (second additive non-linear term), regressing on marital status encoded as 0=never married and 1=ever been married, based on a binomial error structure, with sample number, year of census and detailed encoding of religious denomination (Table 3) as random factors (sample number and religion nominal scaled).
Percentage of ever-married individuals between the ages of 15 and 49 years, by religion and sex.

The one-way interactions of sex and religion with education and employment, respectively, were included in a first full model. It was decided to keep the full model because all interactions were significant, and the model with all interactions included (full model) had a lower Akaike Information Criterion (AIC=22,063,910) compared with the model without interactions (AIC=22,5310,80). In addition, all interactions in the full model were significant if the model was checked with the function ‘anova.gam’ (p<0.0001). Further, the comparison using the function ‘anova.gam’ of the full model and the model without interactions revealed a significant difference between both models (df deviance=−467,209, p<0.0001). For age grouped by sex and religion, and sex ratio grouped by sex and religion, the smoothed curved (local regression) was plotted with age on the x-axis and a measure of the probability of marriage at a certain age.
Results
The progression into marriage with increasing age is non-linear and differs considerably both between men and women as well as between Christians and Muslims (Fig. 2). Almost 100% of Muslims but only about 90% of Christians are married by the age of 40. Generally, women start progression into marriage at a younger age than men, with a steeper increase in the percentage of married individuals among Muslims than Christians. As a result, young Muslim women are the first to progress into marriage, followed by Christian women, and both Muslim and Christian men. Owing to the steeper increase in Muslims, from the age of 30 years a higher percentage of Muslim men than Christian women are married (Fig. 2).
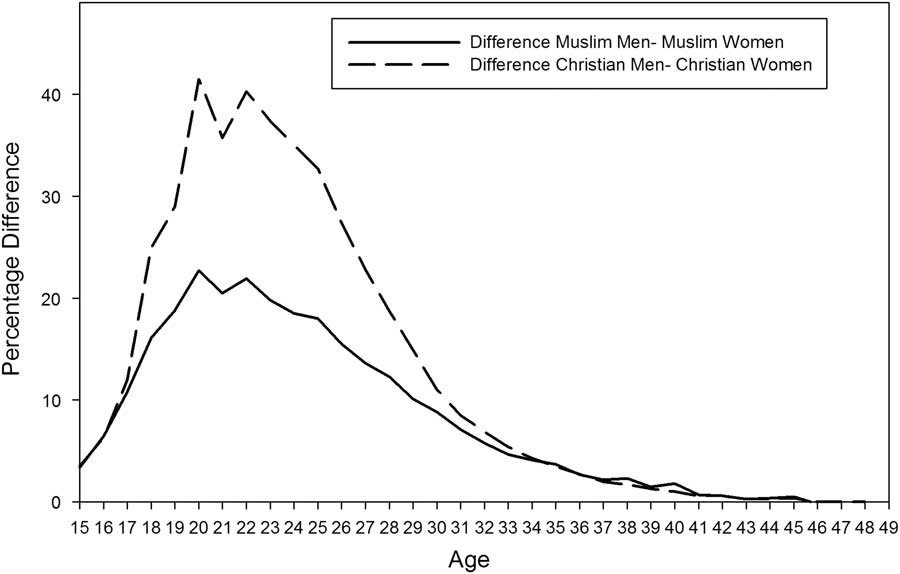
Figures 2 and 3 show that, up to the age of ~30 years, in Muslims the proportion of married individuals differs more strongly between men and women than in Christians. As a result, a substantially higher proportion of Muslim than Christian men remains unmarried between the ages of 17 and 31 years. In both Muslims and Christians, the proportions of married men and women match each other around the age of 40 years.
Difference in the percentage of unmarried men and unmarried women between the ages of 15 and 49 years, for Christians (dashed line) and Muslims (solid line).
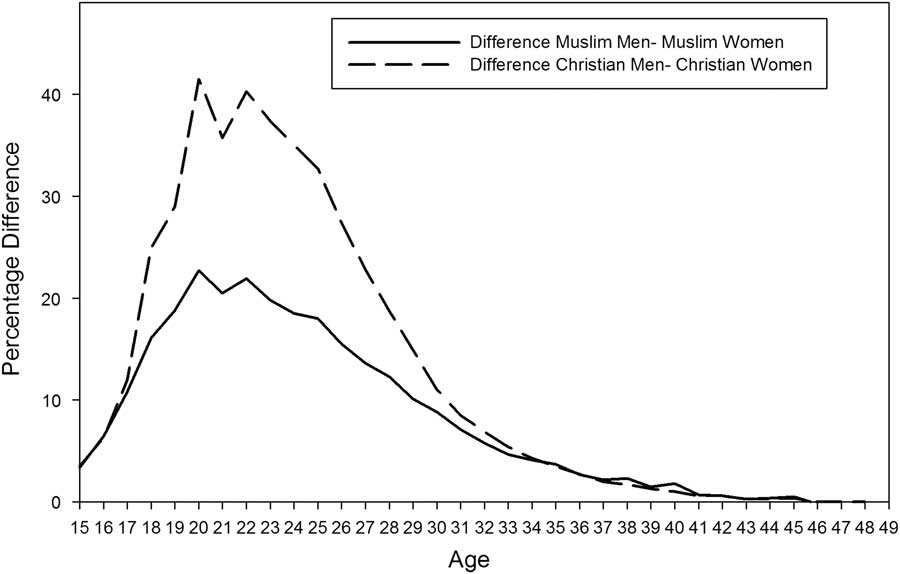
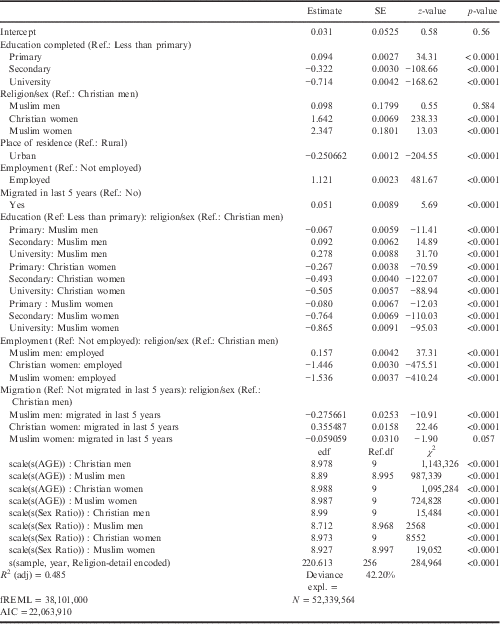
In the generalized additive mixed model (Table 2), compared with the reference group (Christian men), being a Christian woman or a Muslim woman is significantly positively associated with being married. Compared with the reference education level group (less than primary completed), attending primary school is significantly positively, whereas secondary education and university completed are significantly negatively associated with being married. Being employed is significantly positively, and living in an urban area significantly negatively associated with being married. Migration in the last 5 years is significantly positively associated with being married. The significant negative interaction between primary school completed and Muslim men reveals that primary educated Muslim men have a lower chance of being married than the reference group (Christian men, less than primary educated), the chance increasing with increasing education (Table 2). Compared with Christian men, Muslim men have a significantly higher, whereas both Christian and Muslim women have a significantly lower probability of being married if they are employed. The estimates further indicate that the chances of marrying increase more strongly with higher education and employment in Muslim than in Christian men, and decrease more strongly in Muslim than in Christian women. Also, again compared with Christian men, both Muslim men and Muslim women face a lower probability (only marginally significant in Muslim men) but Christian women face a higher probability of being married if they had migrated within the last 5 years. All smooth terms are significant and the generalized additive mixed model estimates the variance explained as 42.2% of the total variance (Table 2). If the non-linearity of the association between age and marriage is not taken into account (general linear mixed model; data not shown), R 2 is estimated as 0.17 (according to Finch et al., Reference Finch, Bolin and Kelley2014). Hence the non-linearity in the association between age and marriage seems to explain a reasonable proportion of the variance.
Generalized additive mixed model of individual characteristics regressed on marital status
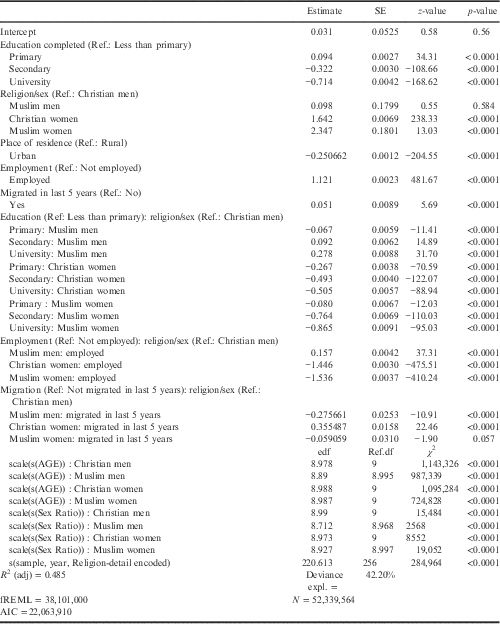
Marital status encoded as 0=never married and 1=ever been married. Sample number, census year and detailed encoding of religion (see Table 3) are random factors, based on a binomial error structure. Abbreviations: edf=estimated degrees of freedom; Ref.df=edf that accounts for smoothing parameter uncertainty by the restricted maximum likelihood function; χ 2=chi squared value; AIC=Akaike Information Criterion; fREML=fast restricted maximum likelihood; scale=value transformed by subtracting the overall mean and dividing it by the overall standard deviation.
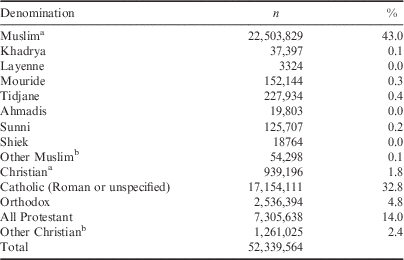
Prevalence of religious denominations in study sample
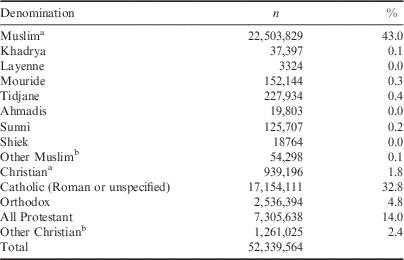
a Denomination not specified.
b Denomination specified.
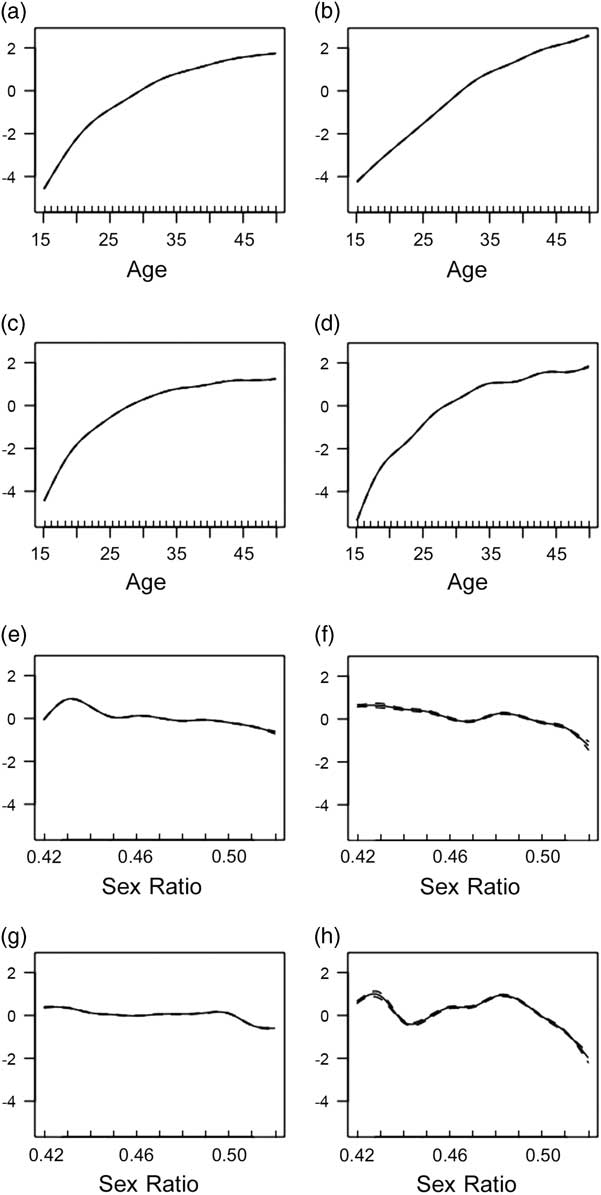
The different progression into marriage of Muslim and Christian men and women is apparent in Fig. 4a–d, which shows the smoothed curves of the generalized additive model for age group by sex and religion, corrected for highest education, living area, migration status and employment. Again, the probability of ever being married shows the steepest increase in Muslim women, followed by Christian women, Christian men and Muslim men. In contrast to the other three groups, in Muslim men progression is linear rather than curvilinear, indicating both a later as well as longer progression into marriage, particularly compared with Muslim women. Moreover, only in Muslim men does the curve increase substantially until the age of 49, indicating later marriage in Muslim men.
Smooth curves (local regression) generated by the generalized additive model for age group by sex and religion, based on a binomial error structure, with sample number as random factor for a) Christian men, b) Muslim men, c) Christian women and d) Muslim women; and for sex ratio by sex and religion, based on a binomial error structure, with sample number as random factor for e) Christian men, f) Muslim men, g) Christian women and h) Muslim women. The x-axis scale is linear and the y-axis scale is in logits (log (odds p/(1−p), i.e. the values are centred on 0 (50/50 odds)). The solid line shows local regression corrected for sex, religion, education, employment and living in a rural vs urban area, and the dotted line shows confidence intervals (standard errors).
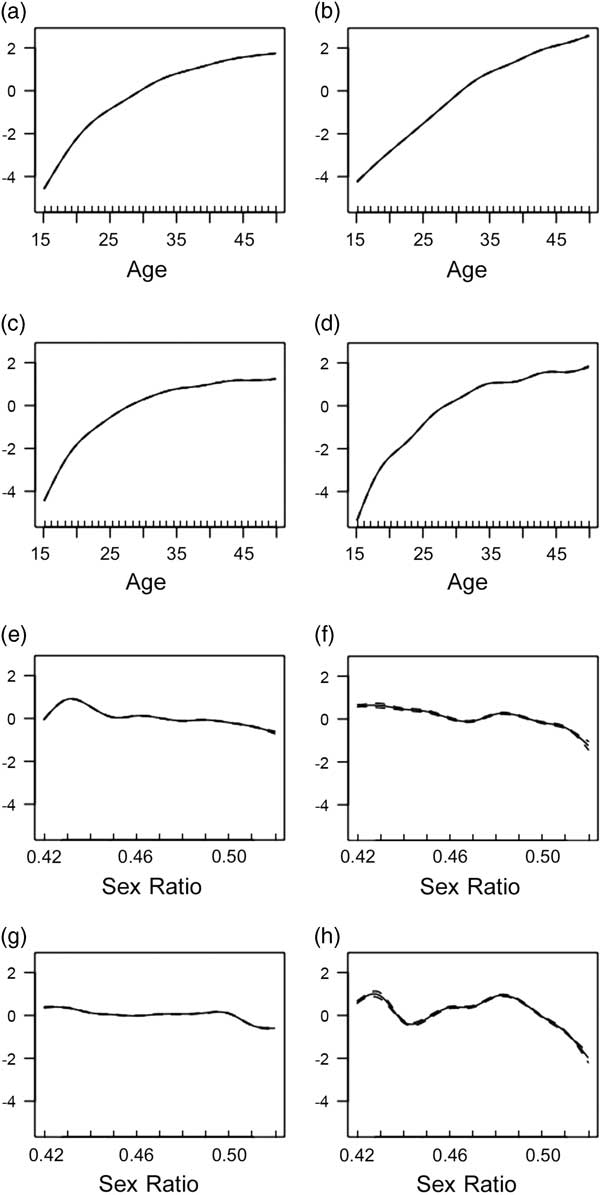
The smoothed curves of sex ratio grouped by sex and religion show expected patterns in both Christian men and Christian women: with increasing sex ratio, the probability of being married decreases in Christian men (Fig. 4e), but, with the exception of the fringe zones, increases very slightly in Christian women (Fig. 4g). In Muslim men as well as Muslim women, the pattern is more complex. Overall, also in Muslim men, the probability of being married decreases with increasing sex ratio, but the relationship seems to ‘oscillate’, showing a local summit at a sex ratio of 0.49 and a local valley at a sex ratio of 0.47 (Fig. 4f). In Muslim women, also an oscillation, but with a higher amplitude, is visible: the probability of being married decreases with increasing sex ratio until sex ratio 0.44, increases again until sex ratio 0.49 and decreases afterwards (Fig. 4h). The finding is at first glance counterintuitive, but it should be noted that the majority of individuals (65%) are found at sex ratios of between 0.46 and 0.51 (13.5% of individuals are found at sex ratios lower than 0.46, and 21.5% of individuals at sex ratios higher than 0.51).
Discussion
In accordance with the higher prevalence of marriage in the Muslim than Christian world (data from the World Value Survey: http://www.worldvaluessurvey.org/WVSPublicationsBooks.jsp), this study found a higher proportion of ever-married individuals in Muslims compared with Christians. The general lower frequency of married individuals among Christians can be attributed to the more secular nature of many Christian countries. It was further found that, in general, men marry at an older age than women. The age difference at progression into marriage between women and men is much more pronounced in Muslims than Christians. As a result, up to the age of 31 years, a substantially higher proportion of Muslim than Christian men remain unmarried. This finding is in line with the prediction that sexual selection may act more strongly in populations with a tradition of polygyny (Henrich et al., Reference Henrich, Boyd and Richerson2012). Such a tradition can also be expected to increase the importance of social status as a prerequisite for marriage (Gibson & Mace, Reference Gibson and Mace2007; Pollet & Nettle, Reference Pollet and Nettle2009; Henrich et al., Reference Henrich, Boyd and Richerson2012). Indeed, this study found that employment and higher level of education are stronger prerequisites for marriage in Muslim men, who have a tradition of polygyny, than in Christian men with a tradition of monogamy. The direct effects of polygyny, however, could not be investigated due to a lack of sufficient data on polygyny in the data set.
In both Muslims and Christian, the gap in the proportions of married men and women closes at around the age of 40 years. In Christian men, this can probably be explained by the higher average age at marriage in men than in women. In Muslim men, the higher age at marriage probably contributes to closing this gap. In particular, Muslim men continue to progress into marriage up to an older age than both Muslim and Christian women as well as Christian men (see linearity of the smoothed estimates in Fig. 3). This finding agrees with common reports on a greater marital age gap (older spouses) between Muslim women and their spouses (Carmichael, Reference Carmichael2011).
In Muslims, however, this ‘marriage gap’ seems to be too wide to be explained just by the age difference at marriage between men and women (Fig. 2). Although it is not possible to draw any conclusions about why the gap eventually closes, further possible, mutually but not exclusive explanations can be speculated about. First, as the data did not provide longitudinal information, the possibility that the gap reflects differences in the proportion of married men and/or average age at marriage between older and younger cohorts cannot be excluded. Further, although Buunk et al. (Reference Buunk, Dijkstra, Fetchenhauer and Kenrick2002) and Schwartz and Hassebrauck (Reference Schwarz and Hassebrauck2012) found consistent mate preferences regardless of age at marriage, in the case of a ‘shortage’ on the marriage market, mate preferences may broaden, and hence reduce the probability of a marriage squeeze (Ní Bhrochláin, Reference Ní Bhrolcháin2001). This has been shown, for instance, in the case of wars, when individuals tend to shift partner preferences (Ní Bhrochláin, Reference Ní Bhrolcháin2001). Thus, it is possible that older, still unmarried men may marry older, divorced or widowed women, thereby closing the marriage gap. Also, in women, studies have shown that mate availability affects partner choice. The typical age preference (for instance, women usually prefer a spouse who is older than themselves) is weakened in older women as well as women of lower education and income (Darroch et al., Reference Darroch, Landry and Oslak1999; Boyd & Li, Reference Boyd and Li2003; Caron & Levesque, Reference Caron and Levesque2004; Fieder & Huber; Reference Fieder and Huber2007b; Alarie & Carmichael, Reference Alarie and Carmichael2015). The present finding might also be in line with Kruger et al. (Reference Kruger, Fitzgerald and Peterson2010), who found that if women are scarce they marry earlier on average and the variance in male marital age increases with female scarcity. However, on the basis of this study’s data, it was not possible to test this hypothesis, as age of marriage was only available for a limited number of samples.
Finally, as the sample included many developing countries, it was assumed that mortality and/or migration may be disproportionately high among unmarried young Muslim men, leaving predominantly married ones in the older cohorts. Accordingly, Seidler (Reference Seidler1985) reported that unmarried men die earlier. Furthermore, in line with Fieder et al. (Reference Fieder, Huber and Bookstein2011), who showed that low-status men tend to be less frequently recruited into marriage, particularly in Muslim men, both unemployment and low education greatly increases the odds of remaining unmarried. This in itself may also affect mortality risk.
In contrast to men, the marriage probability in Christian and Muslim women decreases both with employment and increasing education. As indicated by the higher estimates in the general additive mixed model, this pattern is much more pronounced among Muslim than Christian women. The strong negative effect in Muslim women probably reflects the patriarchal traditions and politics prevailing in Muslim societies. It may also be a consequence of strong intra-sexual competition among men (Henrich et al., Reference Henrich, Boyd and Richerson2012). As lower educated and unemployed Muslim women have a higher chance of being married (and therefore reproducing), this pattern may contribute to the dramatic fertility increase in many Muslim countries observed in the last 20 years (Hackett et al., Reference Hackett, Connor, Stonawski, Skirbekk, Potancoko and Abel2015; Müller et al., Reference Müller, Sievert and Kingholz2016).
A high proportion of unmarried men may mean trouble: it increases the risk of violence, war and crime (Henrich et al., Reference Henrich, Boyd and Richerson2012; Economist, 2016). Marriage is the best prevention of becoming violent and criminal (Horney et al., Reference Horney, Osgood and Marshall1995; Farrington & West Reference Farrington and West1995). Data from the US, for instance, have revealed that marriage reduces the likelihood of committing a crime by 35% (Sampson et al., Reference Sampson, Laub and Wimer2006). Thus, in countries with a biased sex ratio resulting in a high portion of unmarried young men who often lack any prospect of ever finding a mate, violence and crime rates increase (Hudson & Den Boer, Reference Hudson and Den Boer2004; Edlund et al., Reference Edlund, Hongbin, Junjian and Junsen2007; Henrich et al., Reference Henrich, Boyd and Richerson2012). An example is China, where an excess of unmarried young men owing to the ‘one child policy’, combined with a traditional preference for sons, resulted in a nearly doubling in crime rates (Hudson & Den Boer, Reference Hudson and Den Boer2004; Edlund et al., Reference Edlund, Hongbin, Junjian and Junsen2007; Henrich et al., Reference Henrich, Boyd and Richerson2012). One assumption therefore is that, in populations in which a considerable proportion of men are excluded from the marriage market because available women are lacking or because those men do not meet marriage requirements such as social status, education or employment, the risk for violence and crime is higher (Daly & Wilson, Reference Daly and Wilson1988; Sampson & Laub, Reference Sampson and Laub1995; Sampson et al., Reference Sampson, Laub and Wimer2006). However, very recently Schacht et al. (Reference Schacht, Tharp and Smith2016) found the opposite effect on the basis of county data from the US: countries with more men have lower rates of crime and violent behaviour. These findings challenge the usual claim of male excess leading to elevated levels of violence, but support mating market predictions (Schacht et al., Reference Schacht, Tharp and Smith2016). Also, the findings of Schacht and Borgerhoff Mulder (Reference Schacht and Borgerhoff Mulder2015) on mating efforts support mating market models.
The association between sex ratio and marriage probability shows the expected pattern in Christian women, with the proportion of married women increasing with higher sex ratio (i.e. more men compared with women). In addition, for both Christian and Muslim men the proportion of married men decreases with increasing sex ratio. Only in Muslim women is the pattern counterintuitive, with a lower probability of marriage as the sex ratio increases. It should be noted, however, that in Muslims the association is not straightforward but oscillates, more strongly in men than in women. Also, the sex ratio varies from 0.43 to only slightly above 0.51, so the observed sex ratio variation actually takes place between a highly female biased sex ratio and a slightly male biased sex ratio. In addition, the obvious non-linearity of the interaction renders the interpretation of the results difficult and therefore purely speculative. It is suggested that at higher sex ratios, intra-sexual competition among men is greater, which should probably decrease marriage chances for all but the high-status individuals. If this effect is strong enough, it can be assumed that this might even affect marriage probability in women, as seems to be the case in Muslim but not Christian women. However, the results on sex ratio should not be over-interpreted, as the number of individuals was small in the case of the more extreme sex ratios.
The study has some limitations. The total sample included samples from countries of different population sizes and different census size in percentage total population (from 0.05% in Nigeria up to 10% for most of the censuses; see Table 1). All IPUMS international samples were at least implicitly stratified in some way, so stratification cannot be equal among samples (for a detailed description see: https://international.ipums.org/international/variance_estimation.shtml). Hence the total sample pooled from all samples cannot be equally stratified. However, as no other data exist on such a broad basis, the only way to account for these problems and the overall problems of differences between samples was to calculate a ‘mixed’ model, including sample and religious denomination (to account for general differences among denominations) as random factors.
In addition, this study faced limitations and restrictions as is generally the case with comparative approaches to cultures (Mace et al., Reference Mace, Pagel, Bowen, Otterbein, Ridley, Schweizer and Voland1994). According to ‘Galton’s problem’, due to interdependences within samples, there will be some auto-correlations. In the case of religions, despite existing differences, countries with the same religion are not independent as religious traditions are ‘similar by descent’ rather than ‘similar by state’. Nonetheless, although Christianity and Islam, as monotheistic traditions, have similarities by descent (for instance, the Abrahamic tradition), they also show dissimilarities by descent – for instance, the tribal heritage of Islam and the influence of the Roman Empire on Christianity. Furthermore, although both religions frequently interacted in their history, they developed rather independently over large periods of time. Hence, this justifies treating both traditions as at most independent, even though complete independence of data points cannot be assumed. This may also hold true for cohort effects that may influence the analysis. As the analysis was based on census data, however, it was not possible to disentangle cohort effects. This also holds true for the definition and comparability of marital status (definition by IPUMS: describes the person’s current marital status according to law or custom) and ‘religion’ across samples, where National Census Bureau and IPUMS international had to be relied upon to make the data comparable across censuses (for a detailed description see: https://international.ipums.org/international-action/variables/RELIGION#comparability_section).
In conclusion, this study found that, although overall a higher proportion of Muslims are married compared with Christians, the difference in the fraction of married men compared with married women at a certain age (the ‘marriage gap’) is much more pronounced in Muslims than in Christians. Additionally, the socioeconomic threshold for entering marriage is also higher for Muslim than Christian men, and Muslim women in particular face a negative effect of SES on the probability of ever being married. This finding is in line with the assumption that religion may indicate the prevalence of polygyny, and therefore could be used as a proxy for polygyny. The findings are in accordance with what would be expected for a tradition of polygyny, i.e. that polygyny removes a certain proportion of women from the marriage market. This leads to problems finding a spouse, particularly for young men low on status, resulting in a high number of married women and unmarried young men, thereby putting polygenic societies under pressure.
Acknowledgments
The authors thank the Minnesota Population Center for access to the Integrated Public Use Microdata Series, International: Version 6.3 [Machine-readable database], University of Minnesota, Minneapolis, 2014, as well as the National Statistical Offices for providing data. The National Statistical Offices are listed at the following URL: https://international.ipums.org/international/citation_stats_offices.shtml (accessed15th February 2017). The authors thank the anonymous referees.