I. INTRODUCTION
The raw data from a quasistatic nanoindentation test consist of continuous load versus displacement data obtained during the loading of an indenter with known geometry into a specimen, followed by data obtained during unloading. Oliver and PharrReference Oliver and Pharr1 applied Sneddon’s solution for elastic indentation to analyze the initial portion of the unloading process and developed a relation between the slope of the unloading curve and the area of contact. This enabled measurement of the hardness and the elastic modulus of specimens by nanoindentation.
When indenting into a homogeneous bulk of material with a sharp pyramidal indenter, it is expected that both the hardness and modulus would be independent of the depth of penetration; however, if the sample were not a semi-infinite, homogeneous, isotropic, scale-independent continuum with uniform mechanical properties, the measured properties would be a function of depth of penetration, as observed in nanoindentation on thin film systems. There are numerous articles that address the mechanics of nanoindentation on thin films.
For measurement of the hardness of thin films, the ‘10% rule’ is typically used, i.e., the maximum depth of penetration is kept below 10% of the thickness of the film; however, “for measurement of elastic modulus, influence from the substrate is unavoidable”.Reference Fischer-Cripps2 Lichinchi et al.Reference Lichinchi, Lenardi, Haupt and Vitali3 carried out 3D simulation of nanoindentation of hard films on a soft substrate using a Berkovich indenter. They concluded for the titanium nitride-coated high speed steels (TiN/HSS) system, the critical depth at which the substrate begins to deform is 15% of the thickness of the film. Their simulations showed that a soft substrate could begin to plasticize at the interface region even before the plastic region in the film reaches the substrate. Bressan et al.Reference Bressan, Tramontin and Rosa4 presented some experimental and finite element analysis (FEA) work on the nanoindentation of bulk and thin films which used the ‘10% of thin film’ rule of thumb.
Chen and VlassakReference Chen and Vlassak5 reported the results of their numerical study on the measurement of thin film mechanical properties by means of nanoindentation. They performed numerous simulations to study the effect of the substrate on the measured properties of the film for large ranges of combinations of indentation depth, strength ratio and modulus ratio. They found that the influence of the substrate is very different for different cases. For instance, if the thin film is much harder and stiffer than the substrate, the results are dominated by substrate properties. More recent FEA studies of thin film/substrate problem are presented by other researchers, with similar conclusions for various material types and simulation conditions.Reference Chen and Bull6–Reference Wang, Fang and Lin8
Saha and NixReference Saha and Nix9 experimentally studied the effect of the substrate on the determination of thin film mechanical properties by nanoindentation on the same thin film, deposited on four different substrates. Their experimental results support the findings of Chen and VlassakReference Chen and Vlassak5 qualitatively. They also presented an extension of King’s solutionReference King10 to account for the influence of substrate compliance by including a term due to the substrate effect in the reduced modulus equation for conical indentation

where α is a numerically determined scaling parameter, h is the indenter displacement, a is the indentation contact radius, t is the film thickness, E is the elastic modulus, and ν is Poisson’s ratio. Subscripts r, i, f and s stand for “reduced”, “indenter”, “film” and “specimen,” respectively. TheyReference Saha and Nix9 showed that Eq. (1) predicts the expected film modulus reasonably well for indentation depths less than 50% of the film thickness.
Han et al.Reference Han, Shah, Banerjee, Viswanathan, Clemens and Nix11 used the reduced modulus given by Eq. (1) to estimate the resultant hardness as a function of depth. They used the relationship presented by Joslin and OliverReference Joslin and Oliver12 to estimate hardness H as long as the modulus estimation is valid:
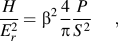
where P is the load, S the stiffness and β is a constant dependent only on the indenter geometry.
Yu et al.Reference Yu, Sanday and Rath13 presented an elastic solution of the axisymmetric Boussinesq problem for indentation on a film/substrate system. “The results are obtained by solving a Fredholm integral equation of the second kind with a continuous symmetrical kernel which depends on the bonding conditions.” Numerical results are given for several combinations of film and substrate elastic moduli and film thicknesses. Later Chen and VlassakReference Chen and Vlassak5 showed that Yu’s elastic solution agrees well with finite element simulations and can be used for estimation of elastic modulus of the composite where the elastic properties of film and substrate are known. Han et al.Reference Han, Saha and Nix14 used Yu’s elastic solution to calculate a relationship between the reduced contact stiffness and contact radius. Thus, they used this analysis to determine contact areas during indentation and to calculate the hardness as a function of indentation depth. Their experimental results show applicability of this method for several elastic mismatch ratios up to indentation depths of more than 80% of the film thickness. They showed that since the method is based on the contact radius, pile-up is accounted for and the method would be applicable to elastic-plastic indentation as well as elastic indention.
SakaiReference Sakai15 also used Yu’s elastic solution along with finite element (FE) simulations to define a spatially graded modulus and spatially graded yield stress (Y) and showed these two parameters perfectly lie on his Maxwellian relation for compliance factor (H/Y) as a function of plastic index (Er tan β/Y, where β is the complementary angle of the semi-cone angle θ of the indenter). He showed that the analytical model matches with FEA results very well. He also presented some relations that can be used to simplify the application of Yu’s solution.
Li and VlassakReference Li and Vlassak16 used Yu’s method and other work to simplify the use of this elastic solution for thin film/substrate systems instead of Sneddon’s equation that is developed for indentation into homogeneous materials. Their proposed procedure, which is similar to the widely accepted procedure of Oliver and Pharr,Reference Oliver and Pharr1 is applicable over a much larger range of indentation depths.
Durst et al.Reference Durst, Goken and Vehoff17 included the thin film configuration as one among three different configurations characteristic of dual phase systems. Their categories are based on the ratio of height to thickness of the second phase: thin film, columnar second phase, and a cylindrical particle: none of these include a hemispherical particle, which more closely follows the shape of the subsurface plastic zone. They showed how the load curve for the dual phase system changes from that of the phase being indented to that of the second phase as the conical indenter goes deeper into the phase being indented.
It can be recognized that the transition from the properties of the phase being indented to those of the substrate occur due to progressive increase in the volume over which the properties are sampled by the indenter. In fact, a careful study of this transition can lead to understanding of the volume that is sampled for determining each of the measured mechanical properties. Knowing this, educated guesses can be made about the size of the indents that would be best for any specific study, providing maximum information about the phase of interest with minimal noise. In addition, for the case of indenting on a second phase grain,Reference Sun, Liang, Xu, Wang and Li18 or for measuring gradients in properties over a small region,Reference Saket Kashani and Madhavan19 tracking the changes with depth of penetration will help to understand the influence of the material around the region of indentation on the results.
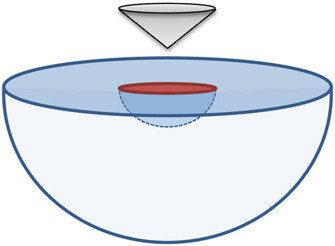
In this article, we present some dual phase studies using FEA to determine the extent of the material beneath the indenter that is sampled for measurement of hardness and modulus. For the first time, a hemispherical particle (Fig. 1) is used, with slightly different properties compared with those of the matrix. This allows understanding the volume sampled in a bulk material since the behaviors of the two materials are not significantly different. However, this requires an accurate FEA simulation, with low noise, to detect small changes in hardness and modulus that occur with change in penetration depth.
Schematic sketch of a hemispherical particle in a hemispherical matrix.

II. FINITE ELEMENT MODEL
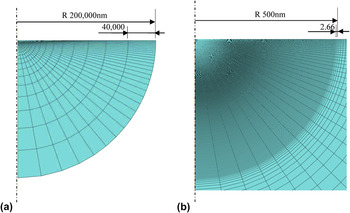
The nanoindentation test is simulated within ABAQUS/Standard using an axisymmetric finite element model with linear fully integrated (CAX4) elements. The specimen is modeled as a hemisphere of radius 200 μm. The mesh is designed with a constant gradient in element size in the radial direction, to keep the error in contact area measurement below 1%. Even though there are many sources of error in FEA of nanoindentation, the error due to discretization of the contact area is the main source of noise in the hardness values. Discrete jumps in contact area occur as each additional surface element comes into contact, while the indentation force increases gradually, leading to significant, periodic error in the hardness. Using a graded mesh, with element size increasing linearly with radius, the ratio of jump in contact area to the total contact area can be kept constant, independent of the penetration depth.Reference Saket Kashani and Madhavan20 This ratio is nearly equal to the maximum error in FEA results, and is kept below 1% in the simulations used here. This small noise limit allows changes in hardness due to penetration depth to be resolved clearly.
The geometry of the specimen and details of the mesh are shown in Fig. 2. This leads to self-similar deformation for contact radii between 10 nm and 500 nm, as discussed in detail in another work on the accuracy of FEA of nanoindentation.Reference Saket Kashani and Madhavan20 Two different indenters, one with semi-cone angle θ of 70.3° (with area function equivalent to that of a Berkovich indenter), and another with semi-cone angle of 42.28° (with area function equivalent to that of a cube corner), are modeled as rigid cones. As is commonly done, frictionless contact is modeled between the indenter and the surface of the specimen and fixed displacement boundary conditions are applied to the outer radius of the specimen.
Mesh designed for 1% error (units in nm). (a) Axisymmetric model of hemispherical matrix, (b) close up at the contact region with 1% error, gradient mesh.

Poon et al.Reference Poon, Rittel and Ravichandran21 have shown that if the height of the specimen is more than 100 times larger than the maximum depth of penetration, the elastic results would not be affected by the boundary conditions. In this work the maximum depth of penetration is only 100 nm while the radius of the hemispheric model is 200 μm. Even though the 2000 times larger specimen is very conservative for avoiding boundary effects, by comparing with a simulation using infinite elements it is shown that there is still a slight effect of the boundary on the modulus calculated.
The specimen is modeled as an elastic-perfectly plastic material, using two sets of properties, one that causes sink-in and another that causes pile-up around the indenter. These materials approximate the properties of glass (Y = 2662 MPa, ν = 0.25, E = 70 GPa) and aluminum (Y = 228.5 MPa, ν = 0.25, E = 70 GPa) with E/Y ratios of 26 and 306 respectively.Reference Bolshakov22 It is known that glass exhibits sink-in while aluminum displays pile-up around the 70.3° cone (equivalent to the Berkovich indenter).Reference Bolshakov and Pharr23 As discussed later, it is observed from the results that even glass exhibits pile-up for the 42.28° cone.
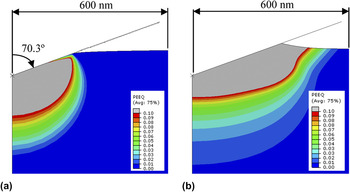
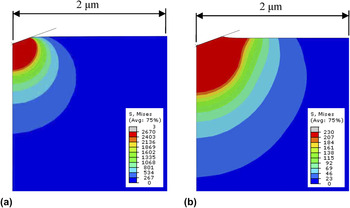
The equivalent plastic strain distributions beneath the indenter are shown for these two materials in Fig. 3, for the same depth of penetration. It is clear that the shapes and sizes of the plastic zone are different for these two materials. The fringe plots in Fig. 4 also depict clear differences in the distribution of von Mises stress in these two representative materials. It can be concluded that the volumes sampled for hardness and modulus measurements could be dependent on material properties and need to be studied for a range of materials.
Equivalent plastic strain distribution at maximum depth of penetration, 100 nm (a) for glass (b) for aluminum.

Von Mises stress distribution at maximum depth of penetration, 100 nm, in MPa (a) for glass (b) for aluminum.

III. VOLUME SAMPLED FOR HARDNESS
For determining the volume that influences the hardness measured by nanoindentation, the hemispherical particle is modeled as a material with either 10% larger or 10% smaller yield strength with respect to that of the bulk phase (substrate). All other properties of the particle and the substrate are equal.
Nanoindentation simulations are performed on the bulk (single phase, substrate) material to obtain the hardness corresponding to each set of properties. Single-phase materials with yield strength equal to the baseline value Y, as well as 0.9Y and 1.1Y are simulated for both glass and aluminum. Indentation is simulated by linear displacement of the indenter to a maximum penetration of 100 nm into the particle. Using the instantaneous load P and the contact area Ac directly obtained from FEA (CAREA output parameter), the instantaneous hardness can be determined as
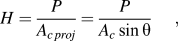
where Ac proj is the instantaneous projected contact area perpendicular to the indentation direction.
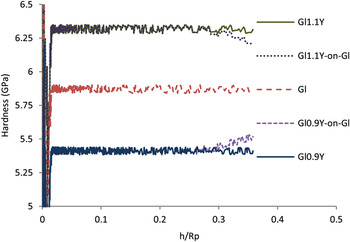
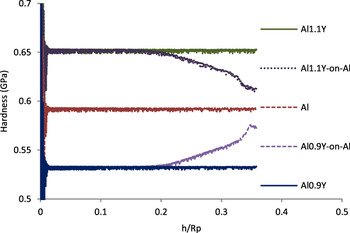
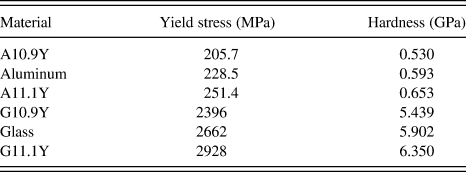
Figures 5 and 6 show the instantaneous hardness as a function of depth of penetration (normalized with respect to the radius of the particle) for the glass and aluminum families, respectively. It can be seen that the hardness value stabilizes once a sufficient number of elements is used for discretizing the contact area and the plastic zone. It is shown in another workReference Saket Kashani and Madhavan20 that the noise in hardness in the stabilized region comes from area measurement noise and the best estimate of hardness is the maximum value in that region. Peak values of hardness extracted from the hardness versus penetration curves for each material are listed in Table I. It can be seen that a 10% change in yield strength leads to approximately 10% change in hardness.
Hardness versus normalized depth of penetration for glass material system.

Hardness versus normalized depth of penetration for aluminum material system.

Material properties used for the simulations with different yield strengths used to identify the volume sampled for hardness, and the hardness values obtained.
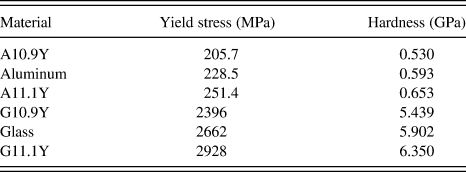
Two dual phase simulations have been performed for each material family by assuming hemispherical particles embedded in the matrix. In these simulations the matrix has yield strength equal to the baseline value (Y), but the yield strength of the particle is altered to be either 0.9Y or 1.1Y. The four dual phase simulations are labeled Gl0.9Y-on-Gl, Gl1.1Y-on-Gl, Al0.9Y-on-Al, and Al1.1Y-on-Al. The second phase particle, of radius 279 nm, is modeled by simply assigning new material properties to the elements inside this radius. Since the boundary between the particle and matrix consists of only one set of nodes shared between the two phases, perfect bonding is modeled between them, with continuous displacements across the boundary.
Figures 5 and 6 also show continuous plots of the hardness versus normalized depth of penetration for the dual phase simulations. It can be observed that beyond a critical normalized depth of penetration, the hardness of the dual phase system begins to deviate from that of the particle. The critical depth can be seen to be nearly independent of whether the yield strength of the particle is lower or higher than that of the matrix.
The deviation of the hardness measured, from the true hardness of the particle, increases with increasing depth of penetration due to the increasing effect of the matrix. This deviation is termed as “error”, since the intention is to establish the maximum depth of penetration for which the correct hardness of the particle can be measured (without error). In this manner, the volume of material sampled for the hardness reading, by indentation tests on single-phase systems, can be identified.
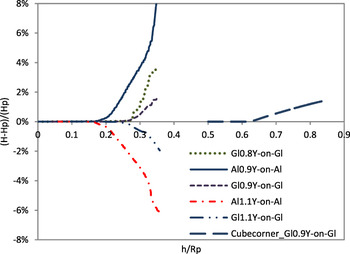
The hardness measurement error relative to the expected value for the particle is plotted as a function of normalized depth of penetration (Fig. 7). In obtaining Fig. 7, the “noise” in the hardness measurements in Figs. 5 and 6 has been locally filtered, retaining only the peak values that represent the maximally loaded condition, and discarding the other values. It can be noted that the deviations for 10% higher and lower hardness are symmetric about the x-axis, which implies that second order effects due to different yield strengths of the particle and the matrix are negligible. The measured hardness begins to deviate from the hardness of the particle for penetrations greater than 25% of particle radius for the case of glass and for penetrations greater than 15% of particle radius for aluminum. This shows that recommendation of a constant percentage penetration for all materials is not valid.
Hardness error versus normalized depth of penetration.

For studying other parameters that may affect the critical depth of penetration, one more case was modeled within the glass material family, wherein the particle has yield strength of 80% of that of glass. It can be seen from the Gl0.8Y-on-Gl curve in Fig. 7 that the hardness begins to be affected by the substrate at the same depth of penetration as observed in the other glass simulations, which is 25% of the particle size. This implies that the volume influencing the measured hardness is not affected by the small difference in the yield strength of the matrix as compared with that of the particle.
Additionally, cube corner indentation into a particle having yield strength equal to 90% of glass was simulated, to study the effect of cone angle. The corresponding curve in Fig. 7 shows negligible error in hardness measurement until the depth of penetration reaches 58% of the particle radius. This implies that the cube corner indenter samples a smaller volume when compared with the Berkovich indenter, for the same depth of penetration. Another interesting observation was that, the indentation process showed a “cutting” type behavior resulting in pile-up even for glass. All the nodes on the surface other than the center node, continued to remain on the surface, without ever coming into contact with the indenter.
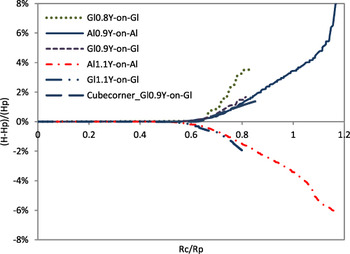
It is well known that the amount of sink-in and pile-up changes as a function of the plastic index Er tan β/Y, Reference Bolshakov and Pharr23, Reference Cheng and Cheng24 which is different for the aluminum and glass materials studied. Pile-up will cause the contact radius to be higher for the same depth of penetration, as can be noted from Fig. 3. Since Fig. 7 shows that the deviation in hardness of the particle begins at a smaller penetration for aluminum, it is of interest to study the deviation as a function of the contact radius.
Figure 8 shows the hardness error as a function of the contact radius observed in the simulations, normalized with respect to the particle radius. It can be seen that the hardness measured begins to be affected by the matrix when the contact radius exceeds 50% of the radius of particle. As will be shown below, this is a good rule of thumb that can be considered to be broadly applicable, for different materials and indenter equivalent cone angles, for all elastic-perfectly plastic materials.
Hardness error versus normalized contact radius.

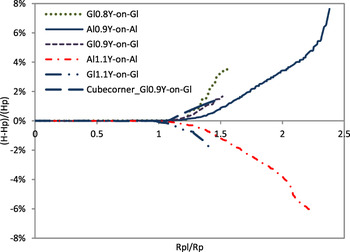
To help understand the reason for the above, the hardness error is plotted as a function of the normalized radius of the plastic zone in Fig. 9. The radius of the plastic zone is calculated using

Hardness error versus normalized radius of plastic zone.

Equation (4) was developed by Harvey et al.Reference Harvey, Huang, Venkataraman and Gerberich25 for estimation of the size of the plastic zone for elastic-perfectly plastic materials, based on Johnson’s expanding cavity model.Reference Johnson26 The radius of the plastic zone obtained by this formula is found to closely match that observed in FEA. It is very interesting to note that the hardness measured starts to deviate from that of the particle’s hardness when the plastic zone spreads into the matrix.
Since the hardness of the particle can be written as:
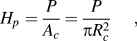
a relation for Rc/Rpl can be obtained by eliminating force from Eqs. (4) and (5) by use of the definition of the constraint factor (Cp=Hp/Yp). The resulting relation can be written as
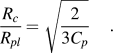
From the results given in Table I, it should be noted that the constraint factor of the materials used in this article ranges from 2.2 to 2.6. Further simulations show that 2.6 is the maximum value of Cp attainable for frictionless simulations, which results in a minimum possible value of 0.51 for Rc/Rpl. Therefore one can conclude that for any elastic-perfectly plastic material, the intrinsic hardness of particle will be measured until the contact radius exceeds one-half of the radius of particle, since the plastic region would be still within the particle. This is valid as long as the cavity expansion model can be used for modeling the indentation of the composite system. This conclusion is not valid for very hard particles in soft matrices for reasons noted in several thin film studies available in the literature.Reference Chen and Vlassak5, Reference Sakai15 For other cases of large mismatch between the elastic modulus or the yield strength of the two materials, the validity of this conclusion remains to be verified.
It has been found that friction does not have much influence on the results in most cases.Reference Mata and Alcala27 In cases where there is a large amount of pile-up, friction reduces the pile-up and increases the hardness. It has been found that the increase in hardness causes an increase in the size of the plastic zoneReference Mata and Alcala27 in line with Harvey’s relationship in Eq. (4), relating the plastic zone size to the load applied. Note that changes due to friction would not affect the key conclusion, that the hardness measured changes when the plastic zone extends into the second phase, based on which it can be concluded that the volume of material which influences the hardness measured is limited to the plastically deformed zone.
IV. VOLUME SAMPLED FOR MEASUREMENT OF ELASTIC MODULUS
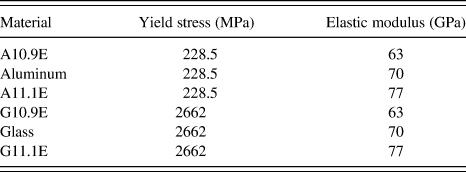
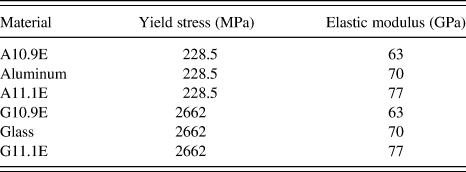
Hemispherical particles of radius 1083 nm, with moduli different from that of the matrix, are used to study the volume sampled for measurement of elastic modulus. The yield strength and Poisson’s ratio of the particle are retained at the same values as that of the matrix, while the elastic modulus of the particle is chosen to be either 10% higher or 10% lower than that of the matrix. Two families of materials are designed around the baseline properties of glass and aluminum. The material properties used in the simulations are listed in Table II.
Material properties for materials with altered modulus of elasticity used for modulus studies.
To study the change in modulus measured, as a function of depth of penetration, the indentation simulations are performed in displacement mode and stopped every 10 nm for a 0.1 nm unloading step. The slope of the unloading curve is used to calculate the modulus of elasticity at each unloading step. This results in 10 data points for each simulation since the maximum depth of penetration is 100 nm. Performing a simulation with only one unloading step at 100 nm confirmed that the small unloading steps do not affect the measurements in subsequent steps, as is expected based on the previous observationReference Saket Kashani and Madhavan20 that the unloading process is entirely elastic.
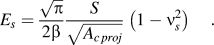
The specimen’s modulus of elasticity Es can be obtained from Eq. (7) for the case of indentation with a rigid indenter where S is the stiffness of the unloading curve, νs is the Poisson’s ratio of the specimen, and β is a constant that depends primarily on the geometry of the indenter.Reference Oliver and Pharr1
A. Single-phase simulations
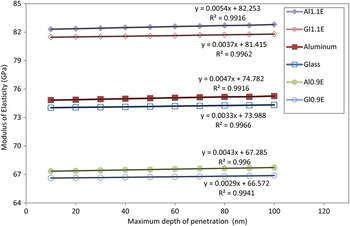
Simulations are done for bulk (single phase) aluminum and glass for each set of values listed in Table II to determine the reference values. As can be seen in Fig. 10, the modulus values obtained for glass and aluminum are not exactly the same, even though they have the same input elastic modulus. This implies that the β correction factor is slightly different for these two materials, likely arising from the difference in the shape of the free surface caused by pile-up.
The elastic modulus obtained from indentation into a homogeneous material increases slightly as depth of penetration increases. (β = 1 is assumed).

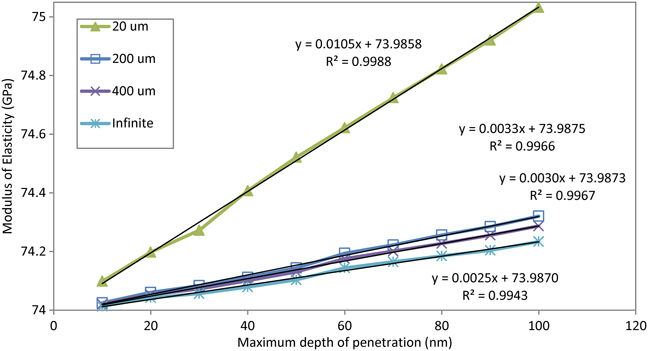
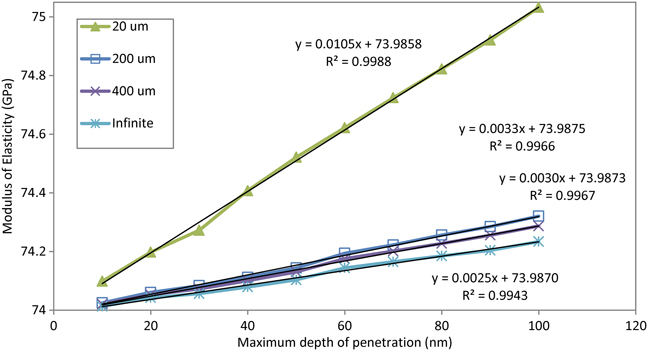
It is also interesting to note that even though a constant modulus value is expected for bulk material simulations, there is a slight linear increase in measured modulus as the depth of penetration increases. For understanding whether this is due to the effect of fixed displacement boundary condition at the outer radius of the matrix, three other simulations were performed on glass with matrix radii of 20 μm, 400 μm, and infinity [simulated using axisymmetric fully integrated continuum infinite elements (CINAX4) at the outer radius of a 200 μm model]. Note that all previous simulations used a model with outer radius of 200 μm. Figure 11 shows that the elastic modulus increases linearly as a function of depth of penetration with a specific slope that depends on model size. It can be seen that all the lines intersect the vertical axis at the same value, E 0, which is related to the true elastic modulus independent of depth of penetration. The modulus reported in Fig. 11 has been calculated assuming that β = 1, to make it easier to find out what the actual value of β is. Noting that the Y-intercept for all the curves in Fig. 11 is 73.987, it can be concluded that β = 73.987/70 = 1.057 for glass. It can be also seen that even for the infinite model, the modulus increases slightly. This suggests that the stiffness increase is not only because of the fixed boundary conditions in the far field, but also because of other sources such as the lack of self similarity of the innermost elements at radius <10 nm, or due to increase in the distortion of these elements, or due to lack of self similarity of the mesh beyond a radius of 500 nm.
The elastic modulus obtained from indentation on bulk glass increases linearly as depth of penetration increases, the increase being faster for smaller model sizes. (β = 1 is assumed).
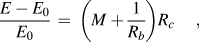
As noted during the hardness study, if the changes in modulus are normalized with respect to their values at zero penetration (i.e., the intercept of the lines with the vertical axis), and plotted as a function of the contact radius, all the data points for the model size of 200 μm fall along one line, as shown in Fig. 12. This shows the error in modulus increases in the same manner for all simulations performed on same model size. Note that the slight difference in slope pointed out in Fig. 10 that arises from pile-up is eliminated by the use of the contact radius instead of the depth of penetration. The general form of the straight line equations given within Fig. 12 can be written as
The error in elastic modulus with respect to its value at zero penetration versus contact radius. Results of the 200 μm model fall along a single line, for all the materials considered. Also shown are three other lines for indentation into glass with various model sizes, showing that the error in modulus measurement increases faster for smaller model sizes.

where E 0 is the modulus at zero depth of penetration (which is determined by extrapolation as shown in Fig. 11, and is dependent on the material properties), Rb is the outer radius of the model, and M is a constant that represents the increasing error for the case of infinite model where Rb = ∞. As can be seen in Fig. 12, this constant value is equal to 0.000015 for the mesh used in this study. The slope of each line therefore is a function of mesh configuration and the model size (M + 1/Rb).
B. Dual phase simulations
Dual phase simulations are performed with a particle of size 1083 nm, with modulus either 10% lower or 10% higher than that of the matrix (of size 200 μm) in which it is embedded. The reason for assuming a larger particle radius in the modulus study as compared with that used in hardness study is to be sure that the plastic zone remains within the particle, even at the maximum depth of penetration of 100 nm.
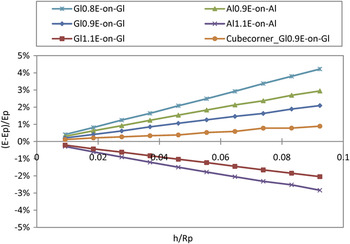
The modulus E measured from each of the unloading steps of the dual phase simulations is compared to the modulus, Ep, measured from the corresponding unloading step of the single-phase simulation in which the properties of particle were also used for the bulk. Since the same mesh is used for the single and dual phase simulations, this completely eliminates the slope (M + 1/Rb), observed earlier. Figure 13 shows the plot of modulus error (E–Ep)/Ep versus the normalized depth of penetration for different amounts of mismatch in moduli of the particle and the matrix. It can be seen that for all cases the measured modulus is influenced by the matrix properties even at the very first data point where the penetration depth is less than 1% of the particle radius. This clearly shows that it is not possible to identify a finite volume that is sampled beneath the indenter. The modulus measured by nanoindentation actually represents the cumulative effect of the entire specimen in determining the stiffness at the indentation point, which is a function of the elastic modulus of the entire volume, weighted by some function of the distance from the indentation point.
Modulus error compared to the corresponding single-phase simulation, as a function of normalized depth of penetration, for aluminum and glass two-phase systems with different amounts of moduli mismatch.

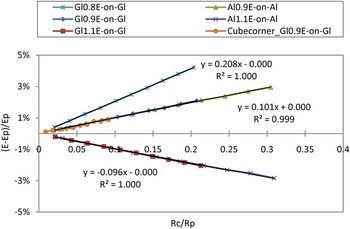
Figure 14 shows that if the errors are plotted versus normalized contact radius, the curves for glass and aluminum (Gl0.9E on glass, Al0.9E on aluminum) as well as the curves for different cone angles (cubecorner-Gl0.9E on glass) merge together. This implies that for all systems with the same ratio of particle to matrix modulus, the slope of the modulus error versus normalized contact radius curve is constant, even independent of cone angle. [i.e., slope ∝ (1−Ep/Em)].
Modulus error compared with the corresponding single-phase simulation, as a function of normalized contact radius. Note that in this case the slope of the modulus error is the same for different material systems and cone angles, and is only a function of the amount of modulus mismatch.

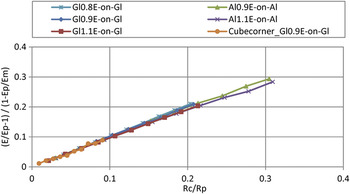
Furthermore, if the error is normalized with respect to the relative difference between the particle and matrix properties, a single relationship that relates the deviations of the measured modulus of the particle to Rc/Rp and Ep/Em is obtained, as shown in Fig. 15. In Fig. 15 the vertical axis is the normalized modulus error (E/Ep–1)/(1–Ep/Em), which is found to make the slopes of all curves equal to unity. This relationship can be written as:

Modulus error normalized with respect to modulus mismatch, as a function of normalized contact radius, for all cases.

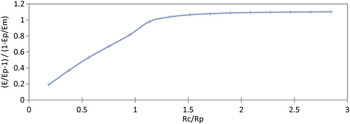
Notice that the data in Figs. 14 and 15 are shown for contact radii only up to 30% of the particle radius. Considering that much deeper indents ( ) should result in measurement of the modulus of the matrix without much effect of the particle, the linear behavior shown in Fig. 15 can be inferred to be valid only for small Rc/Rp ratios. To study the transition between these two regimes, indentation into a particle of Gl0.9E on glass has been simulated to higher Rc/Rp ratios. Figure 16 shows a linear increase of the modulus measured, with unit slope, until the contact radius reaches one-half of the particle radius. This means that Eq. (9) can be suggested as a model for the measured modulus only within this range, and can be rewritten as shown below to make the dependence of the measured modulus on contact radius explicit.

Normalized modulus error versus normalized contact radius for the case of Gl0.9E-on-Glass, showing that the modulus of the matrix is correctly measured when the contact radius reaches 1.5x the particle radius.

V. DISCUSSION
To summarize the understanding gained, the hardness measured is identical to that of the particle so long as the plastic zone is confined within the particle. Using this, contact height and load limits can be formulated for maximum penetration before the matrix influences the hardness measurement for any elastic-perfectly plastic material. Equation (6) can be used to obtain the contact height limit
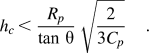
This supports the common knowledge that sharper indents can go deeper on a film/substrate system without the measurements being influenced by the substrate properties. Equation (4) also can be used to come up with a maximum limit on the load if the hardness of particle needs to be measured without any influence from the matrix:
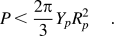
The force limit, as can be seen in Eq. (12) above, is a function of yield strength of particle Yp and its radius Rp. These conclusions are valid only so long as the hardness of the particle and the matrix are similar and the plastic region is confined to the particle. For cases where the particle is significantly harder than the matrix, another condition should also be satisfied, to avoid indentation of the matrix by the particle. This condition can be simply expressed as:
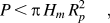
or simply

If the yield strength of the particle is more than 1.5 times the hardness of the matrix, the maximum permissible contact radius would be smaller, due to indentation of the matrix by the particle. A conservative rule of thumb is that the intrinsic hardness of particle is measured by nanoindentation until the contact radius reaches half of particle radius, as long as condition given in Eq. (13) holds true.
Note that the conclusion above assumes that the contact radius can be accurately determined by nanoindentation, which is the case when the elastic modulus of the particle is close to that of the matrix. If the moduli are significantly different, correct estimation of both the hardness and modulus is more challenging.
For the case of modulus measurement, it is observed that fixed boundary conditions in the far field affect the measured modulus even for very shallow indents. The effect of the fixed boundary on measured modulus of bulk materials is well represented by Eq. (8). The effect of matrix properties on the measured modulus of a particle within a matrix is also well modeled using Eq. (10). It is again pointed out that in the data used to develop Eq. (10), the effects of the constant M, and of the model size (1/Rb), are eliminated by comparing the modulus measured in each unloading step to the modulus measured in the corresponding unloading step of the single-phase system.
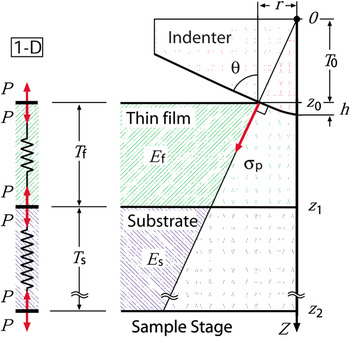
Equation (10) is similar to the form of the relation developed by Nagao et al.Reference Nagao, Fujikane, Tymiak and Nowak28 for determination of Young’s modulus for pyramidal indentation into a thin film/substrate system. They used a one-dimensional linear analysis which models the system as a set of linear springs. Other work in the literature also shows the spring model to result in good agreement with experiments.Reference Bec, Tonck and Loubet29
Figure 17 shows the geometry of the axisymmetric model proposed by Nagao et al.Reference Nagao, Fujikane, Tymiak and Nowak28 They defined the parameter τ as the parameter describing the substrate effect, considering that the displacement of the indenter can be expressed as a summation of the displacement of the film and that of the substrate.

Geometry of the axisymmetric model of pyramidal indentation into thin film/substrate system and analogous 1D representation of a linear set of springs.Reference Nagao, Fujikane, Tymiak and Nowak28 Reprinted with permission from S. Nagao, M. Fujikane, N. Tymiak, and R. Nowak, Journal Applied Physics, 105, 106104, (2009). © 2009, American Institute of Physics.

which can be used for  to obtain a relation between the measured modulus and the moduli of the film and substrate.

They showed that for a practical system in which the film thickness is very small compared to that of the substrate, i.e.,  , (T 0 defined in Fig. 17) the parameter τ would be

which results in

Equation (18) relates the measured modulus of the thin film system to the modulus of the film and matrix and also the penetration ratio. Comparing this to Eq. (10), τ, the parameter describing the matrix effect for a hemispherical particle within a matrix is:
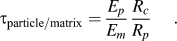
Comparing Eqs. (19) and (17), and noting that Rc = h tan θ, it can be seen that the equivalent particle size for a film of thickness Tf is being considered to be Tf/tan θ. Our findings show that the modulus measured by indentation into a particle of radius Rp = Tf/tan θ will be influenced by the matrix to the same extent as claimed by Nagao et al.Reference Nagao, Fujikane, Tymiak and Nowak28 for a film of thickness Tf. For commonly used indenters such as the Berkovich with θ > 45°, the above implies that equivalent particle size would be less than the film thickness. This is contrary to intuition, based on which it would be expected that the matrix has less influence on the modulus measured by indenting into a film of a given thickness, than into a hemispherical particle of radius equal to the film thickness. Equation (19), obtained from clear trends observed in FEA results for a wide range of material properties and indenter geometries, indicates that the actual contribution of the matrix would be smaller than that proposed by Nagao et al.Reference Nagao, Fujikane, Tymiak and Nowak28
Since it is well known that only the reduced modulus is involved in Sneddon’s equations and in O&P type analysis of indentation data, it is standard practice in FEA simulations of indentation to assume that the indenter is rigid, and use the reduced modulus of the material-indenter pair for the material. This allows one to match all the results with experiments, while simplifying the computations. When an elastic indenter is used the conclusions presented above will be applicable to the reduced modulus.
VI. CONCLUSIONS
In this article, the sizes of the volumes sampled for hardness and modulus measurement by nanoindentation testing have been identified. This has been accomplished using FEA simulations of nanoindentation testing on a hemispherical particle embedded in a matrix using particle properties that are only slightly different from those of the matrix. The hardness and modulus are measured as a function of penetration depth and the deviation of these curves from those obtained by indentation into a bulk material with the properties of the particle is used to identify the size of the zone that influences the results. It is found that for elastic-perfectly plastic materials, the intrinsic hardness of the particle is measured so long as the plastic region is still within the particle, which is the case until the contact radius reaches at least one half the radius of the particle. For the modulus of elasticity, it is found that the modulus measured by nanoindentation actually represents the elastic response of the entire specimen. It is shown using FEA simulation of indentation into a homogeneous bulk material, that the fixed boundary conditions in the far field can have a measurable effect on the specimen modulus calculated even at relatively small penetrations into the particle, and that the magnitude of the effect is a function of the contact radius, and the model radius. Studies with the hemispherical particle in a matrix system show that the normalized modulus error is equal to the normalized contact radius, for values of normalized contact radius up to 50%. When the radius of contact is more than 1.5× the particle size, the modulus measured approaches that of the matrix.