


Introduction
The Eurasian otter Lutra lutra is categorized on the IUCN Red List as Near Threatened, with a decreasing population trend (Loy et al., Reference Loy, Kranz, Oleynikov, Roos, Savage and Duplaix2022). It inhabits rivers, streams, lakes, ponds and coastal areas from the Russian Far East to Ireland in the west. Historically hunted (Schwenk, Reference Schwenk1986), current pressures on otters include habitat loss and degradation as a result of development, urbanization, river modification and declining water quality (e.g. Hui & Chan, Reference Hui and Chan2023). Water pollution limits otter distribution, with their range influenced by prey (mostly fish) availability and human-induced water quality degradation (Quiñónez et al., Reference Quiñónez, Fuller and Randhir2018). Pollutants such as organochlorine insecticides and polychlorinated biphenyls (PCBs) bioaccumulate in otter tissues, causing population declines and sublethal effects on physiology and reproduction, often persisting in the environment for decades (Kean et al., Reference Kean, Shore, Scholey, Strachan and Chadwick2021). PCB-related declines occurred throughout Europe between the 1950s and 1980s, causing a genetic bottleneck in the otter population of southern Sweden (Tison et al., Reference Tison, Blennow, Palkopoulou, Gustafsson and Roos2015). Agricultural runoff, particularly siltation from poor tillage practices, reduces water clarity, increases biological oxygen demand, and smothers substrates, degrading aquatic ecosystems and reducing prey availability (e.g. Johannsen & Armitage, Reference Johannsen and Armitage2010). In Italy, the species nearly vanished from central and northern regions by the late 20th century (Prigioni et al., Reference Prigioni, Balestrieri and Remonti2007). In Great Britain, hunting drove early declines in the 18th and 19th centuries, followed by population collapse from the 1950s as a result of pollution. Naturalized non-native American mink Neogale vison, originally escaped from fur farms, are thought to have negatively impacted otters through competition, with otter and mink population trajectories negatively correlated (McDonald et al. Reference McDonald, O’Hara and Morrish2007), although the direction of the relationship is uncertain. For example, Bonesi & Macdonald (Reference Bonesi and Macdonald2004) suggest otter recovery may have driven mink declines. In Great Britain, otter recovery began after the late 1970s (Jefferies, Reference Jefferies1989), with full recolonization of England by 2010 (A. Driver, Environment Agency, pers. comm., 2011).
Listed under the EU Habitats Directive (Council Directive 92/43/EEC), the otter is protected under Annex II (requiring Special Areas of Conservation) and Annex IV (strict protection). Article 17 mandates conservation status reporting on a 6-year cycle. Post-Brexit, the UK adopted statutory monitoring responsibilities under the Habitats Regulations Reporting framework. The Standard Otter Survey method involves searching 600 m of riverbank, lake or coastline for tracks and signs (Lenton et al., Reference Lenton, Chanin and Jefferies1980), with changes in occurrence indicating population trends (Mason & MacDonald, Reference Mason and Macdonald1987).
Here we assess the conservation status of the otter throughout Ireland. The specific objectives included: (1) surveying tracks and signs to assess current occupancy rates to compare with previous surveys, (2) running a citizen science campaign for public records, (3) assessing changes in distribution and range, (4) estimating population trends, (5) analysing ecological and habitat associations, (6) evaluating pressures and threats, and (7) identifying candidate conservation measures. Findings informed the 2025 EU Habitats Directive Article 17 assessment in the Republic of Ireland and Habitats Regulations Reporting that contributed to the overall assessment of the species in the UK.
Study area
The first Otter Survey of Ireland (1980–1981) reported the species at 92% of 2,177 sites (Chapman & Chapman, Reference Chapman and Chapman1982). In the Republic of Ireland, incidence remained high at 90% of 268 sites in 1990–1991 (Lunnon & Reynolds, Reference Lunnon and Reynolds1992) but declined to 70% of 525 sites by 2004–2005 (Bailey & Rochford, Reference Bailey and Rochford2006), with an estimated population of 6,400 breeding females (95% CI 4,500–9,700; Marnell et al., Reference Marnell, Néill and Lynn2011), and to 63% of 852 sites surveyed in 2010–2011 (Reid et al., Reference Reid, Hayden, Lundy, Pietravalle, McDonald and Montgomery2013a). In Northern Ireland, incidence fell to 78% in 2001–2002 (Preston et al., Reference Preston, Prodöhl, Portig and Montgomery2004) but rebounded to 89% in 2010 (Preston & Reid, Reference Preston and Reid2011). Analyses suggested survey biases may have accounted for much of this apparent decline (Reid et al., Reference Reid, Lundy, Hayden, Lynn, Marnell and McDonald2013b). Despite this, the otter remained widespread in Ireland during the last conservation assessment in 2019 and was judged to have favourable conservation status (NPWS, Reference Lynn2019; JNCC, 2019).
Methods
Otter survey of Ireland 2023–2024
The Standard Otter Survey method was used to assess species occurrence along 600 m of riverbank, lake or coast, searching for spraint (territorial scats) on boulders, rocks or vegetation, and tracks in soft sediment. At rivers, surveys began at a bridge when available (known as the spot-check method; Chanin & Smith, Reference Chanin and Smith2003), as otters preferentially mark concrete footings and prominent boulders under bridge arches where spraint is sheltered from weathering. Surveyors stopped upon detecting otter signs; otherwise, they completed the full 600 m transect. At the coast, in addition to surveying the high tide mark, any freshwater pools and the mouths of streams or rivers were checked. A total of 111 surveyors covered the Republic of Ireland and seven covered Northern Ireland. They received standardized training through written materials, video tutorials and field demonstrations. Surveys were conducted during June 2023–October 2024, comparable to previous surveys that also spanned 1–2 years (including all seasons) given the large number of sites surveyed. To minimize negative bias, surveys were suspended for 2 weeks following any heavy rainfall that affected water levels, consistent with the Standard Otter Survey method. Water levels were monitored in real-time using the Environmental Protection Agency surface water levels online portal (EEA HydroNet, 2024) and Department of Infrastructure hydrometric water levels online viewer (DfI HydroNet, 2024). No specific threshold was used to suspend surveys; it was left to the discretion of individual surveyors familiar with their local river to decide when to pause surveys based on their perception of higher than usual water levels.
Previous surveys
Data from previous surveys were obtained with permission from the National Parks & Wildlife Service in the Republic of Ireland and the Northern Ireland Environment Agency. However, original data sheets and electronic copies of Lunnon & Reynolds (Reference Lunnon and Reynolds1992), which covered the Republic of Ireland only, were unavailable and excluded from reanalysis (though their overall reported occupancy rate is cited for context). Datasets were standardized by aligning (stacking) variables and recoding to a common format, with minor category amalgamations where necessary. Chapman & Chapman (Reference Chapman and Chapman1982) revisited some otter-negative sites for a second survey, inflating site occupancy compared to later surveys, where each site was visited only once. To ensure comparability, all second visits from the 1980s dataset were removed. Thus, otter occupancy rates reported here for the 1980s vary slightly from those reported originally.
Spatial variation
We used ArcGIS Pro (Esri, USA) to map survey sites, assigning them to one of eight river basin districts (Eastern, Neagh-Bann, North Eastern, North Western, Shannon, South Eastern, South Western, Western) to capture spatial variation in otter occurrence. Sites were classified as either wider countryside sites (outside protected areas) or within 600 m (survey transect length) of a Special Area of Conservation (SAC) designated for otters, including 44 SACs in the Republic of Ireland and six SACs in Northern Ireland (n = 50). Special Areas of Conservation were designated in 1994, and therefore sites surveyed by Chapman & Chapman (Reference Chapman and Chapman1982) were retrospectively assigned to those included later under designation.
Bias correction
The Standard Otter Survey method is subject to negative methodological biases (Reid et al., Reference Reid, Lundy, Hayden, Lynn, Marnell and McDonald2013b). Analysis of the last national otter survey suggested otter detection varied substantially between survey teams, with a c. 16% difference between the best and the average surveyor. Rainfall in the preceding week lowered detection by c. 6%, and the absence of bridges (representing availability of suitable sprainting sites in which spraints persist and are therefore easily found) reduced detection by c. 5%. Taken together, all three sources accounted for a negative bias of 30% in the Republic of Ireland and 5% in Northern Ireland during the last survey, suggesting true otter occurrence may be significantly higher than naive incidence suggests (Reid et al., Reference Reid, Lundy, Hayden, Lynn, Marnell and McDonald2013b). For comparability, otter incidence during 2023–2024 was therefore corrected, assuming the same magnitude of negative bias as quantified during the last national survey, to provide an estimate of possible upper values.
Environmental data
The same variables and survey recording sheet used since the 1980s were digitized into a Survey123 form (Esri, USA) for smartphone-based georeferenced data collection. Habitat type was recorded as flowing freshwater (streams, rivers), static freshwater (lakes) or coastal (high tide mark). River width categories were < 2, 2–5, 5–10, 10–20, 20–40, > 40 m and depth categories were < 0.5, 0.5–1, 1–2, > 2 m, estimated by eye, based on the perceived average over the length of the transect surveyed. Current was recorded as static, sluggish, slow, fast or rapid. Substrate types (boulders, cobbles, gravel, sand, silt), trees and shrubs immediately adjacent to the bank/shore, and surrounding habitats (grassland, arable, broadleaved woodland, conifer plantation, peat/heathlands, urban, saltmarsh) were recorded as present or absent.
Pressures and threats
Surveyors recorded potential pressures on otter populations, including pollution from agriculture (e.g. visible runoff, siltation, agro-chemical barrels, dead livestock), domestic waste (e.g. household dumping) and industrial sources (e.g. factory discharge). Water abstraction was identified by signs of water removal, such as slurry tankers at bridge access points with pipes left in situ. Boating included manual (rowing), wind (sail), and powered (motor) vessels of any size. Angling and coarse fishing (possibly with fish (re)stocking) were indicated by observing anglers, fishing pontoons or proximity of fish farms. Surveyors were trained to identify American mink tracks and signs, which were recorded as present or absent. Surveyors recorded a subjective disturbance score for each site from 0 (none) to 5 (highest), based on the total pressures observed and their perceived intensity. During analysis, risks were mapped to EU Habitat Directive pressures and threat codes and linked to corresponding conservation measures (Eionet, 2025)
Species records
The National Biodiversity Data Centre, Waterford, and the Centre for Environmental Data and Recording, Belfast, are the primary biodiversity repositories for the Republic of Ireland and Northern Ireland, respectively. Both provided exports of all otter records in their databases. During 2023–2024, otter survey webpages were hosted by both organizations, each with a data submission portal for public georeferenced sightings and photographs, for validation. Press releases (one in the Republic of Ireland, one in Northern Ireland) generated local print, radio and TV coverage, encouraging public participation. All records were validated from images, videos or camera-trap footage. False positives were recorded as a per cent of validated records. All positive records from the survey in 2023–2024 were added to the sources above to create a master otter database containing all available species records.
Population estimation
A multiplicative model was used to estimate adult female otter density (per km2) following the methods of Ó Néill (2008) and Marnell et al. (Reference Marnell, Néill and Lynn2011), based on otter per cent occurrence within river basin districts, aquatic habitat availability, landscape productivity (derived from river and lake phosphorus concentrations) and, in coastal areas, geology. For full details see Supplementary Material 1, Supplementary Table 1 and Supplementary Fig. 1. To account for potential negative bias, a second population estimate was produced assuming the values for corrected species incidence (see above) to provide an estimate of possible upper values.
Statistical analysis
Descriptive statistics (per cent occurrence with 95% CI, per cent change) captured patterns in otter incidence across countries, habitats, site designation and river basin districts. We used χ 2 tests to assess changes in per cent occurrence between pre-designation and our survey (1980s vs 2020s) and the last and our survey (2010s vs 2020s). We mapped and enumerated species records, occupied monads (1 × 1 km squares), and hectads (10 × 10 km squares) within EU Habitats Directive Article 17 reporting periods: 1905–1994 (first species record to pre-designation; i.e. the first assessment), 1994–2006 (second assessment), 2007–2012 (third), 2013–2018 (fourth), 2019–2024 (fifth and current assessment) and 1905–2024 (all records to date). Otter occurrence (absence/presence) was spatially interpolated within each assessment period as a proxy for population density, using Kriging with 12 neighbouring points and a Gaussian distribution. Logistic regressions tested the effects of country, habitat type, site designation and pressures/threats on otter occurrence. Each variable was fitted in a separate model within each habitat, as well as within countries. Significant effects were visualized using Sigmaplot 15 (Grafiti, USA).
Results
Otter survey 2023–2024 and temporal changes
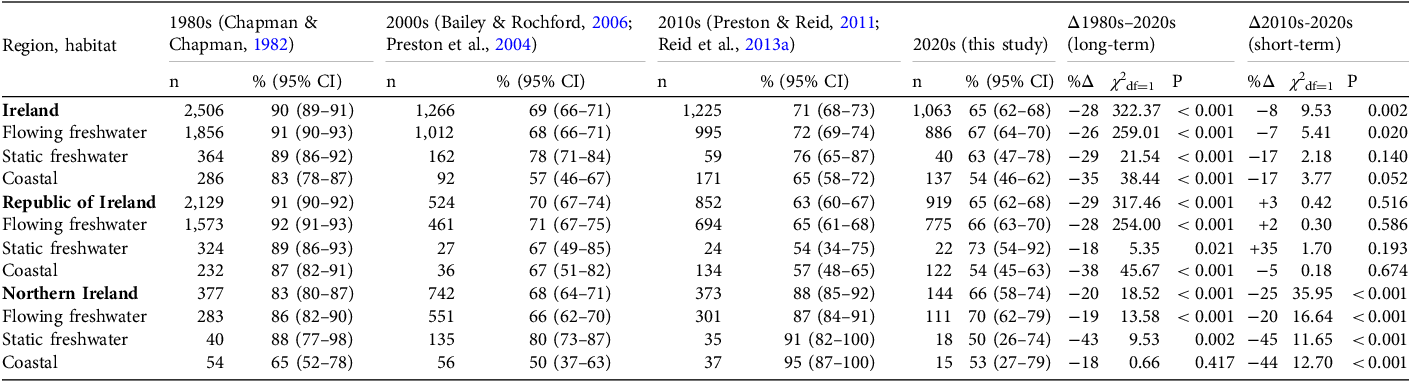
A total of 1,063 sites were surveyed across Ireland: 886 in flowing freshwater, 40 in static freshwater and 137 coastal sites. Otter presence was recorded in 690 of these (595 in the Republic of Ireland, 95 in Northern Ireland). Otter occurrence did not differ between the Republic of Ireland (65%, 95% CI 62–68%, n = 919) and Northern Ireland (66%, 95% CI 58–74%, n = 144; Walddf=1 = 0.082, P = 0.774; Table 1). Otters were widespread, with no obvious spatial pattern (Fig. 1).
Number of sites surveyed (n) and the per cent occurrence (with 95% CI) of otter Lutra lutra tracks and signs in aquatic habitats throughout Ireland, and in the Republic of Ireland and Northern Ireland separately, in flowing and static freshwater and coastal habitats, from the 1980s to 2020s, and long- and short-term per cent change (%Δ, assessed using χ 2 tests).

Table 1 Long description
The table presents data on otter occurrence in different habitats across Ireland, the Republic of Ireland, and Northern Ireland from the 1980s to the 2020s. It includes the number of sites surveyed and the percentage occurrence of otter tracks and signs with 95% confidence intervals. The table is divided into regions and habitats: flowing freshwater, static freshwater, and coastal. It also shows the long-term and short-term percentage changes in otter occurrence. Row 1: Ireland, 2506, 90 (89-91), 1266, 69 (66-71), 1225, 71 (68-73), 1063, 65 (62-68), 322.37, <0.001, -8, 9.53, 0.002. Row 2: Flowing freshwater, 1856, 91 (90-93), 1012, 68 (66-71), 995, 72 (69-74), 886, 67 (64-70), -26, 259.01, <0.001, -7, 5.41, 0.020. Row 3: Static freshwater, 364, 89 (86-92), 162, 78 (71-84), 159, 76 (65-87), 104, 63 (47-78), -29, 21.54, <0.001, -17, 2.18, 0.140. Row 4: Coastal, 286, 83 (78-87), 92, 57 (46-67), 171, 65 (58-72), 137, 54 (46-62), -35, 38.44, <0.001, -17, 3.77, 0.052. Row 5: Republic of Ireland, 2129, 91 (90-92), 524, 70 (67-74), 852, 63 (60-67), 919, 65 (62-68), -29, 317.46, <0.001, +3, 0.42, 0.516. Row 6: Flowing freshwater, 1573, 92 (91-93), 461, 71 (67-75), 694, 65 (61-68), 775, 66 (63-70), -28, 254.00, <0.001, +0.2, 0.30, 0.586. Row 7: Static freshwater, 324, 89 (86-93), 27, 67 (49-85), 24, 54 (34-75), 22, 73 (54-92), -18, 5.35, 0.021, +35, 1.70, 0.193. Row 8: Coastal, 232, 87 (82-91), 36, 67 (51-82), 134, 57 (48-65), 122, 54 (45-63), -38, 45.67, <0.001, -5, 0.18, 0.674. Row 9: Northern Ireland, 377, 88 (80-87), 742, 67 (64-71), 373, 88 (85-92), 144, 66 (58-74), -20, 18.52, <0.001, -25, 3.95, <0.001. Row 10: Flowing freshwater, 283, 86 (82-90), 551, 66 (62-70), 301, 87 (84-91), 111, 70 (62-79), -19, 13.58, <0.001, -20, 16.64, <0.001. Row 11: Static freshwater, 40, 88 (77-98), 135, 80 (73-87), 9, 78 (46-100), 18, 50 (26-74), -43, 9.53, 0.002, -45, 11.65, <0.001. Row 12: Coastal, 54, 65 (52-78), 56, 50 (37-63), 37, 95 (87-100), 15, 53 (27-79), -18, 0.66, 0.417, -44, 12.70, <0.001.
Otter survey sites throughout Ireland (n = 1,063), where the Republic of Ireland was surveyed from June 2023 to August 2024 (n = 919) and Northern Ireland (grey shading) from May to October 2024 (n = 144), with river basin districts and Special Areas of Conservation (SACs) where the otter is a feature of interest.

Fig. 1 Long description
A map of otter survey sites throughout Ireland, highlighting otter presence, absence, and unsurveyable areas. The map includes the Republic of Ireland and Northern Ireland, with river basin districts and Special Areas of Conservation (SACs) where the otter is a feature of interest. Otter presence is marked with black circles, absence with white circles, and unsurveyable areas with crosses. The map is divided into regions such as North Western, North Eastern, Western, Lough Neagh, Neagh-Bann, South Eastern, Shannon, and South Western. River basin districts are outlined in grey, and SACs are highlighted in green.
Otter occurrence varied significantly between habitats (Walddf=2 = 8.370, P = 0.015), with the highest incidence in flowing freshwater (67%), followed by static freshwater (63%) and coastal sites (54%; Table 1, Fig. 2a). In Northern Ireland, otter occurrence was 38% higher in SACs (84% occurrence) than in the wider countryside (61% occurrence; Walddf=1 = 5.212, P = 0.022). However, in the Republic of Ireland, there was little difference between SACs (68%) and the wider countryside (63%; Walddf=1 = 2.298, P = 0.130; Fig. 2b, Supplementary Table 2).
Per cent occurrence of otters (with 95% CI) within (a) habitat types, (b) site designation and (c) river basin districts, separately for the Republic of Ireland (ROI) and Northern Ireland (NI), and (d) showing spatial variation. SAC, Special Area of Conservation.

Otter occurrence varied spatially between river basin districts (Walddf=7 = 22.315, P = 0.002), showing similar trends in the Republic of Ireland and Northern Ireland (Fig. 2c; Supplementary Table 3). The highest occurrence was in the South Western district in the Republic of Ireland (77%, mainly County Cork) and the North Western district in Northern Ireland (74%, mainly Tyrone and Fermanagh), and the lowest was in Neagh-Bann (55%), Eastern (56%) and Shannon (59%) districts (Fig. 2d, Supplementary Table 3).
In the Republic of Ireland, otter occurrence declined from 91% in the 1980s to 63% in the 2010s, yet remained stable since, with 65% occurrence in the 2020s (Table 1). In Northern Ireland, otter occurrence fell from 83% in the 1980s to 68% in the 2000s, increased to 88% in the 2010s, then declined to 66% in the 2020s. These values suggest a long-term decline of 28% (29% in the Republic of Ireland and 20% in Northern Ireland) between the 1980s and 2020s and a short-term decline of 8% (an increase of 3% in the Republic of Ireland and a decline of 25% in Northern Ireland) between the 2010s and 2020s (Table 1, Fig. 3). In both countries, trends in otter occurrence were largely consistent across habitats (Fig. 3b-d) and most river basin districts (Supplementary Fig. 2). The decline in the Neagh-Bann since the 2010s was the greatest change in any river basin district (40%), yet otter occurrence declined across all three river basin districts in Northern Ireland (Supplementary Table 3). Neagh-Bann was surveyed by seven different surveyors; five surveyed reasonable numbers of sites each but did not differ in the otter occurrence they reported (χ 2 df=4 = 6.578, P = 0.160). Harmful algal blooms in Lough Neagh coincided with the otter survey (Reid & Emmerson, Reference Reid and Emmerson2023; Reid et al., Reference Reid, Reyne, O’Neill, Greer, He and Burdekin2024), and the probability of otter detection within the Neagh-Bann was significantly lower in close proximity (within c. 13 km) of the lake (Walddf=1 = 7.053, P = 0.008, pseudo-R2 = 0.334; Supplementary Fig 3).
Otter per cent occurrence in (a) the Republic of Ireland and Northern Ireland from the 1980s to the 2020s (with 95% CI), and throughout Ireland, Republic of Ireland and Northern Ireland by (b–d) habitats and (e–g) site designation. The national average figure for the Republic of Ireland, from Lunnon & Reynolds (Reference Lunnon and Reynolds1992), is shown in (a) but the absence of the raw data for re-analysis excluded that study from all subsequent plots. SACs, Special Areas of Conservation.

Fig. 3 Long description
Panel A: A line graph shows the percentage occurrence of otters in Northern Ireland and the Republic of Ireland from the 1980s to the 2020s. The y-axis represents the percentage occurrence plus or minus 95 percent confidence interval, ranging from 0 to 100 percent. The x-axis represents the decades from the 1980s to the 2020s. The graph includes two lines: one for Northern Ireland and one for the Republic of Ireland, with error bars indicating the confidence intervals. Panel B: A line graph depicts otter occurrence in Ireland across different habitats (coastal, flowing freshwater, static freshwater) from the 1980s to the 2020s. The y-axis represents the percentage occurrence plus or minus 95 percent confidence interval, ranging from 0 to 100 percent. The x-axis represents the decades from the 1980s to the 2020s. The graph includes three lines, each representing a different habitat type. Panel C: A line graph shows otter occurrence in the Republic of Ireland (ROI) across different habitats (coastal, flowing freshwater, static freshwater) from the 1980s to the 2020s. The y-axis represents the percentage occurrence plus or minus 95 percent confidence interval, ranging from 0 to 100 percent. The x-axis represents the decades from the 1980s to the 2020s. The graph includes three lines, each representing a different habitat type. Panel D: A line graph depicts otter occurrence in Northern Ireland (NI) across different habitats (coastal, flowing freshwater, static freshwater) from the 1980s to the 2020s. The y-axis represents the percentage occurrence plus or minus 95 percent confidence interval, ranging from 0 to 100 percent. The x-axis represents the decades from the 1980s to the 2020s. The graph includes three lines, each representing a different habitat type. Panel E: A line graph shows otter occurrence in Ireland across different designations (Special Areas of Conservation (SACs) and wider countryside) from the 1980s to the 2020s. The y-axis represents the percentage occurrence plus or minus 95 percent confidence interval, ranging from 0 to 100 percent. The x-axis represents the decades from the 1980s to the 2020s. The graph includes two lines, each representing a different designation type. Panel F: A line graph depicts otter occurrence in the Republic of Ireland (ROI) across different designations (SACs and wider countryside) from the 1980s to the 2020s. The y-axis represents the percentage occurrence plus or minus 95 percent confidence interval, ranging from 0 to 100 percent. The x-axis represents the decades from the 1980s to the 2020s. The graph includes two lines, each representing a different designation type. Panel G: A line graph shows otter occurrence in Northern Ireland (NI) across different designations (SACs and wider countryside) from the 1980s to the 2020s. The y-axis represents the percentage occurrence plus or minus 95 percent confidence interval, ranging from 0 to 100 percent. The x-axis represents the decades from the 1980s to the 2020s. The graph includes two lines, each representing a different designation type.
Declines were similar in SACs and wider countryside sites (c. 28%). In the Republic of Ireland, declines were similar between SACs and the wider countryside (c. 30%), yet in Northern Ireland, otter occurrence in SACs declined by 16%, substantially less than the 27% decline at sites in the wider countryside (Supplementary Table 2; Fig. 3e-g).
In summary, the survey suggested a modest decline in otter occurrence since the 1980s, with most of this decline occurring between the early 1990s (Lunnon and Reynolds, Reference Lunnon and Reynolds1992) and mid-2000s (Bailey & Rochford, Reference Bailey and Rochford2006). Otter occurrence was stable in the Republic of Ireland but declined in Northern Ireland since the last survey in 2010–2011. Otters were most common in flowing freshwater but remained widespread across all habitats. Occurrence was lowest in the east, where human populations are higher, central peatlands, and the Neagh-Bann river basin district. The 44 SACs in the Republic of Ireland had only marginally higher otter occurrence than the wider countryside, with little evidence that site designation provided protection or offset declines. In Northern Ireland, occurrence was higher in the six SACs, but this may partly reflect their concentration in western counties (Tyrone and Fermanagh), where otter occurrence was highest.
Range
The 690 records from the 2023–2024 survey were added to existing databases. The National Biodiversity Data Centre held 7,035 otter records, mostly from the Republic of Ireland, and the Centre for Environmental Data and Recording, Belfast, held 2,784 records, mostly from Northern Ireland. There were a total of 559 unvalidated records from the 2023–2024 citizen science appeal, of which 191 included photographic evidence. After removing six duplicate images, 185 photographs remained, with 181 validated as otters: 77 photographs, three videos, 11 camera-trap images, one sighting from National Parks & Wildlife Service staff, 22 carcasses (mostly roadkill), 62 spraints and five tracks. One image was identified as a stoat Mustela erminea, and three were too poor in quality for confirmation. This resulted in a 2% false positive rate (4 of 185). Among 348 records without photographic evidence, 13 duplicates (same date and grid reference) were removed, leaving 355 unique unvalidated records. Assuming a 2% false positive rate, only c. 7 records were likely erroneous. Given the ubiquity of the otter, rejecting all 355 records to avoid ≤ 7 errors was deemed excessive, so all citizen science records were accepted and mapped. After merging all data sources and removing 104 duplicate entries, a master database of 10,980 otter records for 1905–2024 was created.
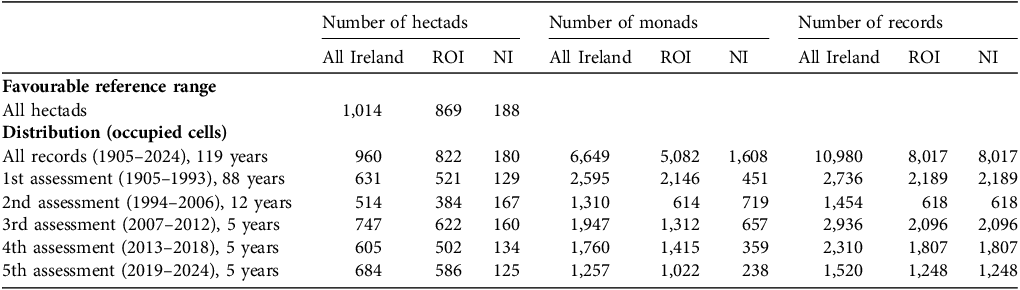
From 1905 to 2024, otter records occurred in 960 hectads, covering 95% of the squares in Ireland (95% in the Republic of Ireland, 96% in Northern Ireland; Table 2, Fig. 4a). Gaps were primarily coastal areas with little land, or inaccessible sites. Given this widespread presence, the favourable reference range (maximum range polygon enclosing previously occupied 10 × 10 km squares) should include all hectads with land (1,014 hectads throughout Ireland; 869 in the Republic of Ireland, 188 in Northern Ireland; Table 2, Fig. 4a). There was no clear temporal trend in distribution or range, with 631 occupied hectads at species designation and 684 in the current assessment period, 2019–2024; Table 2). Fluctuations in record numbers and occupied monads likely reflected variation in survey effort, including in National Otter Surveys and mammal atlases. Otters remain widespread and ubiquitous throughout Ireland (Fig. 4b–f).
Number of otter records and occupied hectads (10 × 10 km) and monads (1 × 1 km) during each of six otter conservation assessment periods throughout Ireland, and in the Republic of Ireland (ROI) and Northern Ireland (NI) separately. The favourable reference range is the minimum range to ensure long-term viability, defined as the maximum number of previously occupied hectads. Distribution is the number of occupied hectads during any one assessment period.

Table 2 Long description
A table comparing the number of otter records, hectads, and monads across different assessment periods in Ireland, the Republic of Ireland (ROI), and Northern Ireland (NI). The table has 7 rows and 9 columns. Column headers are: Number of hectads, Number of monads, Number of records, with sub-columns All Ireland, ROI, NI. Row labels include Favourable reference range, All hectads, Distribution (occupied cells), and five assessment periods from 1905 to 2024. Row 1: Favourable reference range, All hectads, 1,014, 869, 188. Row 2: Distribution (occupied cells), All records (1905-2024, 119 years), 960, 822, 180, 6,649, 5,082, 1,608, 10,980, 8,017, 8,017. Row 3: 1st assessment (1905-1993, 88 years), 631, 521, 129, 2,595, 2,146, 451, 2,736, 2,189, 2,189. Row 4: 2nd assessment (1994-2006, 12 years), 514, 384, 167, 1,310, 614, 719, 1,454, 618, 618. Row 5: 3rd assessment (2007-2012, 5 years), 747, 622, 160, 1,947, 1,312, 657, 2,936, 2,096, 2,096. Row 6: 4th assessment (2013-2018, 5 years), 605, 502, 134, 1,760, 1,415, 359, 2,310, 1,807, 1,807. Row 7: 5th assessment (2019-2024, 5 years), 684, 586, 125, 1,257, 1,022, 238, 1,520, 1,248, 1,248.
Otter distribution (shaded hectads) (a) throughout Ireland since records began, and in five assessment periods since the species was designated as protected: (b) 1905–1994, (c) 1994–2006, (d) 2007–2012, (e) 2013–2018 and (f) 2018–2024. All hectads with land were taken as within the species’ favourable reference range (maximum possible population extent; outer bounding line).

Population
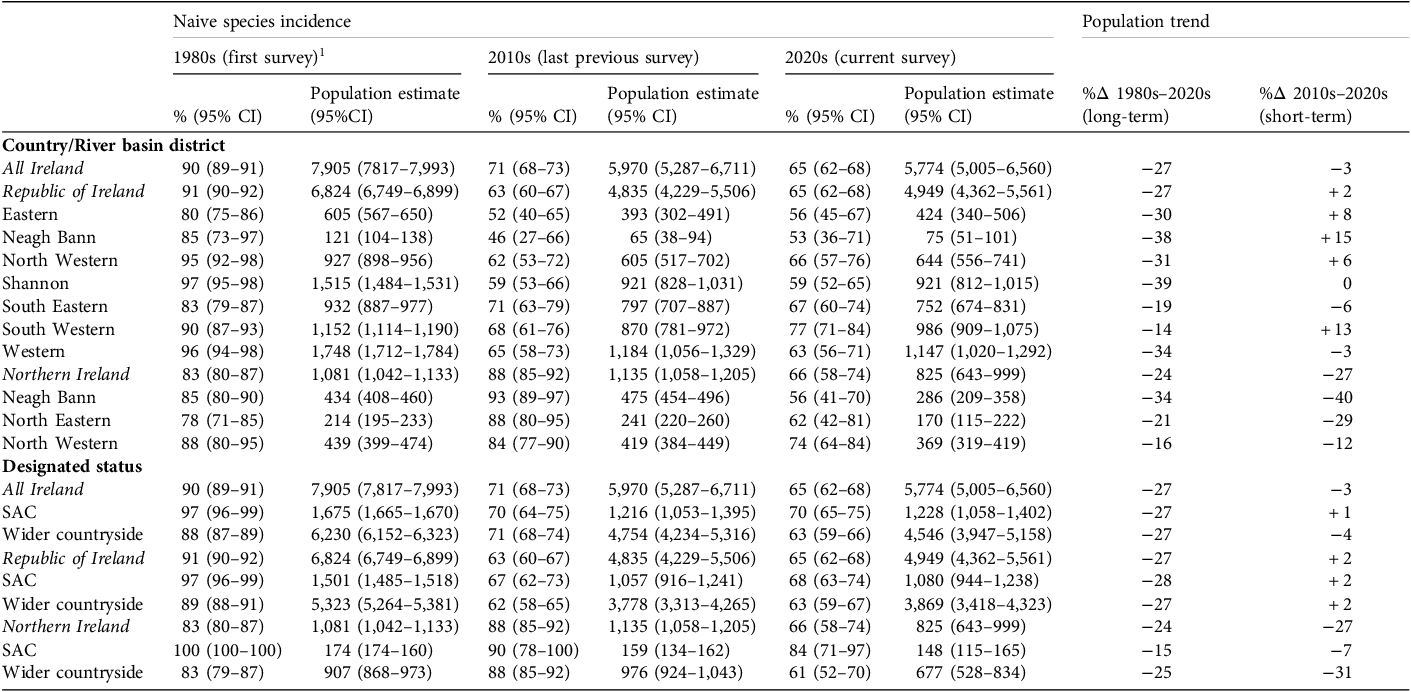
The 2023−2024 otter population was estimated to be 5,774 (95% CI 5,005–6,560) adult females: 4,949 (4,362–5,561) in the Republic of Ireland and 825 (643–999) in Northern Ireland (Table 3). The population estimate declined by 27% over the long-term, from the 1980s to 2020s (27% in the Republic of Ireland, 24% in Northern Ireland), with consistent declines across river basin districts (Table 3). Over the short-term, from the 2010s to 2020s, the population declined 3% overall (+2% in the Republic of Ireland, −27% in Northern Ireland), with regional variation, notably increasing in the South Western district (+13%) but declining markedly (−40%) in the Neagh-Bann district (Table 3a). The estimated decline in otter numbers was greater in the wider countryside of Northern Ireland than within SACs, both in the long- and short-term, but trends in the Republic of Ireland were similar between SACs and the wider countryside (Table 3b).
Per cent occurrence at sites and population estimates of adult female otters, derived from naive uncorrected species incidence in the 1980s (first survey), 2010s (last previous survey) and 2020s (this survey), and long- and short-term per cent change (%Δ) for all Ireland, Republic of Ireland and Northern Ireland, and districts, and for sites designated as Special Areas of Conservation (SAC) and in the wider countryside.

Table 3 Long description
The table presents data on the percentage occurrence and population estimates of adult female otters across different regions and time periods. It includes data from the 1980s, 2010s, and 2020s, with columns for population estimates and percentage changes over the long-term (1980s to 2020s) and short-term (2010s to 2020s). The table is divided into sections for all Ireland, Republic of Ireland, and Northern Ireland, as well as specific river basin districts and designated statuses (SAC and wider countryside). Each row provides the percentage occurrence with 95% confidence intervals, population estimates with 95% confidence intervals, and the percentage change over the specified periods. Notable trends include a general decline in otter populations across most regions and periods, with some regional variations.
1 These figures differ from those reported by Ó Néill (2008) because of the correction of a minor totalling error in the original calculations.
Kriging analysis of otter occurrence suggested fairly uniform density across the island, with localized low spots but no clear spatial pattern (Supplementary Fig. 4a). Most density fluctuations over time occurred in eastern and central regions (Supplementary Fig. 4b–e). The highest densities in 2023–2024 were in the south and north-west, and the lowest were in the east, Neagh-Bann district, central and Mayo peatlands and the Burren, County Clare (Supplementary Fig. 4e).
Bias correction
Applying the same correction factor for potential negative biases following Reid et al. (Reference Reid, Lundy, Hayden, Lynn, Marnell and McDonald2013b), the estimated corrected species incidence during 2023–2024 was 87% (95% CI 84–90%) in the Republic of Ireland and 71% (63–76%) in Northern Ireland (Supplementary Table 4). Correspondingly, the corrected population estimate for 2023–2024 may have been as high as 7,524 (6,758–8,234) adult females: 6,635 (6,050–7,171) in the Republic of Ireland and 889 (708–1,063) in Northern Ireland (Supplementary Table 4). Comparing estimates of corrected population size suggested the long-term decline may have been as low as 5% (3% in the Republic of Ireland and 18% in Northern Ireland) and short-term declines as low as 10% (7% in the Republic of Ireland and 26% in Northern Ireland; Supplementary Table 4), with no real change in the Republic of Ireland but apparent decline in Northern Ireland. These changes are of notably lower magnitude than that suggested by naive species incidence, and the high degree of overlap in the 95% CI of the corrected population estimates for the 1980s, 2010s and 2020s suggest considerable uncertainty in any trend (Supplementary Table 4).
Habitats
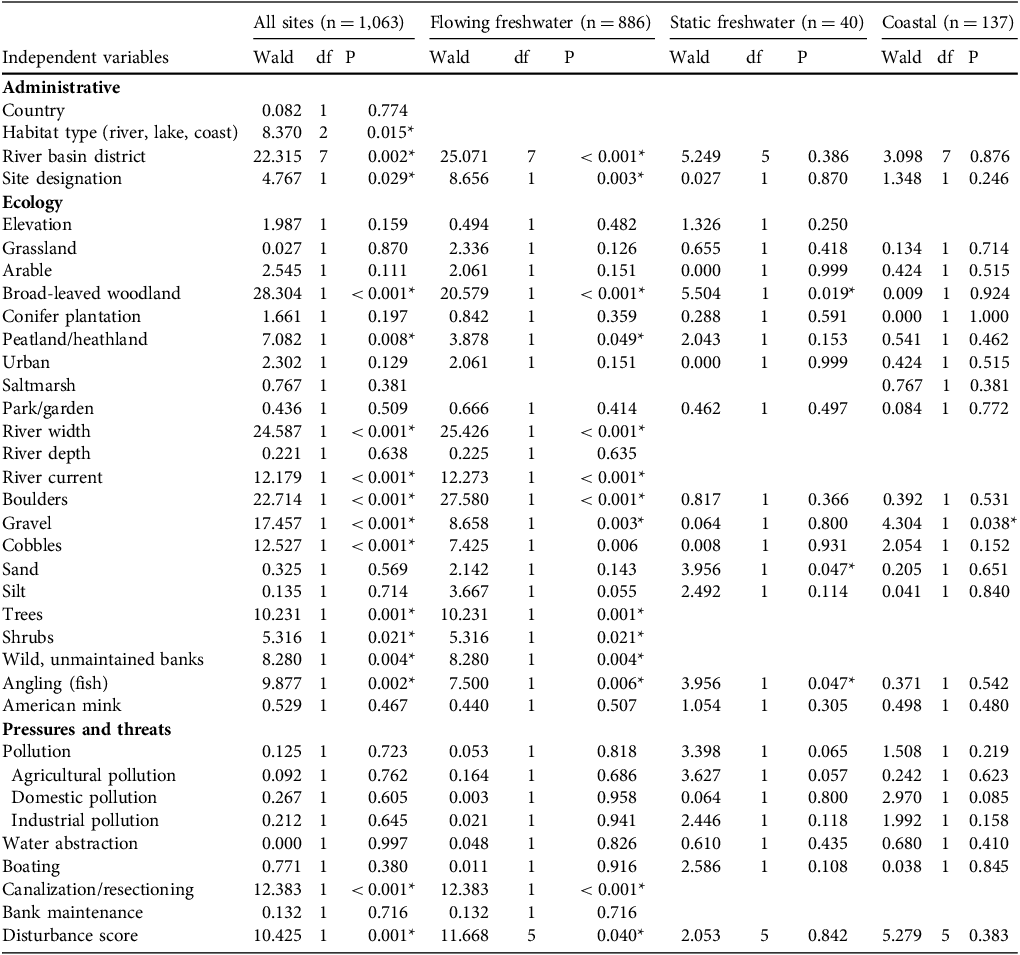
Otter occurrence increased significantly with river width, rising from c. 55% at 1–2 m wide rivers to 85% in > 40m wide rivers (Table 4, Fig 5a). It also varied with water current (Table 4), being lowest (32–43%) at static or sluggish sites and highest (67–70%) in slow, fast and rapid-flowing waters (Fig. 5b). Otters were more likely to occur at sites with rocky substrates such as boulders, cobbles and/or gravel (Table 4; Figs 5c–e) but were negatively associated with peat/heathland (Table 4, Fig. 5f), with no effect of elevation (Table 4). Otters were positively associated with broadleaved woodland (Table 4, Fig. 5g) and bank-side trees (Table 4, Fig. 5h) and shrubs (Table 4, Fig. 5i). They preferred wild, unmaintained riverbanks, avoiding sites with bank maintenance, including vegetation trimming or cutting (Table 4, Fig. 5j). Patterns were similar between the Republic of Ireland and Northern Ireland, although significant relationships at the all-Ireland and the Republic of Ireland scale were more numerous and had stronger effect sizes than in Northern Ireland, likely because of greater statistical power associated with larger sample sizes (Supplementary Table 5).
Logistic regressions, where the dependent variable was otter presence/absence during 2023–2024, with separate models for each independent variable run for all sites, flowing and static freshwater, and coastal sites. Significant effects are indicated with asterisks (*).

Table 4 Long description
The table presents logistic regression results for otter presence/absence during 2023-2024, with separate models for each independent variable across all sites, flowing and static freshwater, and coastal sites. Significant effects are marked with asterisks (*). The table includes columns for Wald statistic, degrees of freedom (df), and p-value for each independent variable. Row labels include administrative, ecology, and pressures and threats categories. Notable trends include significant effects of habitat type, river basin district, site designation, broad-leaved woodland, river width, river current, boulders, gravel, cobbles, trees, shrubs, wild, unmaintained banks, angling, and disturbance score. The table compares these variables across all sites, flowing freshwater, static freshwater, and coastal sites.
Variation in per cent occurrence of otters (with 95% CI) with (a) river width, (b) water current, (c) boulders, (d) cobbles, (e) gravel, (f) peat/heathland, (g) broadleaved woodland, (h) trees, (i) shrubs, (j) bank maintenance, (k) disturbance score, (l) canalization/resectioning, and (m) angling, including fish (re)stocking.

Temporal trends in prevalence of environmental pressures at otter survey sites throughout Ireland from the 1980s to 2020s, with linear regression trend lines.

Fig. 6 Long description
The image contains fourteen line graphs showing temporal trends in various environmental pressures at otter survey sites throughout Ireland from the 1980s to the 2020s. Each graph has a horizontal axis labeled ‘Period’ with intervals for the 1980s, 2000s, 2010s, and 2020s, and a vertical axis labeled ‘% of sites’ ranging from 0 to 100 percent. Panel A: The graph shows a decreasing trend in angling with or without restocking. Panel B: The graph shows a decreasing trend in bank maintenance. Panel C: The graph shows an increasing trend in siltation. Panel D: The graph shows an increasing trend in pollution. Panel E: The graph shows an increasing trend in agricultural pollution. Panel F: The graph shows a slight increasing trend in domestic pollution. Panel G: The graph shows a stable trend in industrial pollution. Panel H: The graph shows a stable trend in boating. Panel I: The graph shows a stable trend in canalization or resectioning. Panel J: The graph shows a stable trend in urban land use. Panel K: The graph shows a stable trend in the presence of American mink. Panel L: The graph shows an increasing trend in conifer plantation. Panel M: The graph shows an increasing trend in water abstraction. Panel N: The graph shows a stable trend in disturbance score.
Pressures and threats
Otter occurrence declined significantly with site disturbance score, especially in flowing freshwater (Table 4). Occurrence was highest (71%) at undisturbed sites (score = 1) and dropped to 41% at the most disturbed sites (score = 5; Fig. 5k). Canalization or resectioning reduced occurrence to 53% (Table 4, Fig. 5l). In 2023–2024, key threats reached their highest recorded prevalence since the 1980s (Supplementary Table 6), including: siltation (at 53% of sites), pollution (at 36% of sites, mostly agricultural at 22% and domestic at 19%), water abstraction (at 13% of sites) and conifer plantations (adjacent to 13% of sites). Siltation and water abstraction showed significant linear increases over time (Walddf=1 = 127.53, P < 0.001; Walddf=1 = 2591.51, P < 0.001; Fig. 6). Other threats were less prevalent or showed no clear trend. The prevalence of pressures was similar in the two countries (Supplementary Table 6). The reported prevalence of perceived pressures in the Neagh-Bann River Basin District in Northern Ireland (at 71% of sites), was significantly higher than any other district (on average at 36% of sites across all other districts; χ 2 df=1 = 25.918, P < 0.001). Surveyor comments revealed that most pressures in the Neagh-Bann were agricultural, including tractors and livestock entering the water, and effluent runoff or domestic, notably plastic, pollution. Otters were more frequent at sites with evidence of angling (74% occurrence) compared to sites without (62% occurrence; Fig. 5m); this was the only positive pressure at rivers and lakes (Table 4). Bank maintenance and angling were recorded at twice the frequency at survey sites in the 1980s than afterwards (Supplementary Table 6; Fig. 6a–b), suggesting either a decline in such activities or a difference in how surveyors subsequently defined and recorded the data. Pressures and threats were classified under EU Habitats Directive Article 17, identifying 11 candidate pressures and associated conservation measures (Supplementary Table 7).
Discussion
Otters appear to have declined throughout Ireland, with increased pressures on water quality, but remain ubiquitous. Over 95% of hectads had otter records, with no change in range across five assessment periods, with any fluctuations likely reflecting recording effort.
Otters were more frequent along rivers than lakes and the coast, where fewer obvious sprainting sites make detection more challenging (Balestrieri et al., Reference Balestrieri, Remonti and Prigioni2010). Larger rivers and streams offer greater hydrodynamic stability, with abundant large fish prey, and enhanced connectivity facilitating movement (e.g. Madsen & Prang, Reference Madsen and Prang2001). Otters prefer fast-flowing, oxygenated waters that support rich invertebrate and fish populations (e.g. Gurung, Reference Gurung2023). Rocky substrates provide structurally complex habitats with refuges for prey such as crayfish and bivalves, and exposed rocks offer conspicuous sprainting sites for territorial marking (Jeffress et al., Reference Jeffress, Paukert, Sandercock and Gipson2011; Shin et al., Reference Shin, Shin, Kim, Kim, Han and Rho2020). Riparian vegetation, particularly broad-leaved woodland or bankside trees and shrubs provide shelter, denning sites, stabilize banks and contribute organic input that enhances aquatic productivity (Hong et al., Reference Hong, Kim, Do, Kim, Kim and Cowan2018). Otters were positively associated with angling, indicating the importance of food, notably salmonid, availability. Yet otters were negatively associated with peatlands, with a low incidence in the Republic of Ireland’s central lowland raised bogs, where acidic, nutrient-poor conditions likely support lower fish densities (Sokolova et al., Reference Sokolova, Litvinova, Sorokin and Hernandez-Blanco2022; Nakonechny & Nakonechna, Reference Nakonechny and Nakonechna2023).
Otter incidence varied spatially, with the Neagh-Bann River Basin District showing the lowest occurrence and greatest decline since the last survey; this was consistently reported by five different surveyors and, demonstrably, not a region–surveyor confound. Harmful algal blooms in Lough Neagh (Reid et al., Reference Reid, Reyne, O’Neill, Greer, He and Burdekin2024) led some to describe the lake as ‘dying in plain sight’ (Reid & Emmerson, Reference Reid and Emmerson2023). The Neagh-Bann had twice the reported pollution rate than the average for all other river basin districts, reportedly from agricultural sources including tractors and livestock entering the water and observed effluent runoff. Blue-green cyanobacterial blooms are known to be driven predominately by nutrification, with 62% of phosphorus entering Lough Neagh from agriculture, principally nutrient run-off (DAERA, 2024). The high rate of pollution in Neagh-Bann provides further circumstantial evidence that the catchment is experiencing significant environmental stress. Otter occupancy in Neagh-Bann was lower at sites close to the lake, suggesting a localized impact. In Ireland, adult females typically range c. 7 km and males c. 13 km, with one male known to have expanded its range from 10 to 20 km within days following a territorial neighbour’s death (Ó Néill et al., Reference Néill, Veldhuizen and de Jongh2009). Given their mobility, otters can redistribute rapidly in response to environmental change, and thus the observed decline in the Neagh-Bann district could reflect a temporary response to the algal blooms. Future otter surveys are needed to determine if the observed decline reported there is temporary. Despite spatial variation, otter occurrence was strikingly similar north and south, with 65% occupancy in the Republic of Ireland and 66% in Northern Ireland during 2023–2024.
Otter detection is subject to methodological biases, including variation between surveyors or survey teams, reflecting experience, skill or visual acuity; recent rainfall that washes tracks and signs away; and the availability of prominent sprainting sites, such as bridge footings (Reid et al., Reference Reid, Lundy, Hayden, Lynn, Marnell and McDonald2013b). The first survey in 1980–1981 was conducted in both countries by an experienced husband and wife team (P.J. and L.L. Chapman) who surveyed 2,785 sites (of which 2,506 first site visits, excluding repeat surveys, were re-analysed here) although they report only 2,177 sites in their report), and all 373 sites surveyed in 2010 in Northern Ireland were assessed by a single experienced aquatic consultant (S.J. Preston), who specializes in otter surveys. In both cases, otter occupancy was high (90% and 88% respectively). In contrast, all other surveys (where occupancy was 60–74%) where conducted by a large range of individuals (for example, 118 surveyors during 2023–2024), although all received the same standardized training. The consistency in otter occurrence between the two countries in the 1980s, 2000s and 2020s suggests the high 2010 estimate for Northern Ireland may reflect surveyor expertise rather than a real population change. Consideration could be given to setting surveyors a test so their competency can be quantified, providing certification. The most recent survey spanned a period of record rainfall (Met Éireann, Reference Éireann2023) but care was taken to suspend surveys in the 2 weeks immediately after raised water levels, consistent with the Standard Otter Survey method, to minimize bias. We cannot rule out that cumulative effects of repeated flooding may have prolonged the negative impact on detection probability. Yet, the occurrence of otters throughout much of the study area in the Republic of Ireland was virtually identical between the 2010s and 2020s despite the former survey period being notably drier, suggesting rainfall may have had little effect on the interpretation of temporal trends.
In the Republic of Ireland, estimates suggest that the otter population declined since the 1980s, by 27% according to the naive estimate and by 7% according to the estimate corrected for negative biases; the actual decline was probably closer to the latter. Most of this decline appears to have occurred between the early 1990s and mid 2000s, with no evidence of further change since the 2010–2011 survey. In Northern Ireland, the otter population also declined over the long term, by 24% according to the naive estimate and by 18% according to the corrected estimate, with the actual decline again probably closer to the latter. However, unlike in the Republic of Ireland, there was a further decline since the last survey, of 27% according to the naive estimate and 26% according to the corrected estimate. The difference between the Republic of Ireland and Northern Ireland seems likely accounted for by the combination of surveyor experience during the last Northern Ireland survey and the apparent significant decline in the Neagh-Bann since.
Otter occurrence was higher near SACs where the species was a designated feature, although the effect was marginal in the Republic of Ireland as sites were widely distributed across the species’ range. As observed in other studies, the efficacy of the Natura 2000 protected area network in offsetting declines was marginal (Abellán & Sánchez-Fernández, Reference Abellán and Sánchez-Fernández2015). In contrast, in Northern Ireland the effect appeared more substantial, with SACs concentrated in the west, specifically in the Sperrin Mountains and Fermanagh Lakelands, which were otter hotspots. Nevertheless, temporal trends were highly consistent across rivers, lakes and the coast, as well as SACs and the wider countryside, further corroborating real decline.
River modifications such as canalization and resectioning negatively affected otters, probably fragmenting habitats, altering water flow and reducing fish abundance (Elosegi & Sabater, Reference Elosegi and Sabater2013). Modifications straighten rivers, increasing water velocity, disrupting ecological integrity and lowering productivity (Kubheka et al., Reference Kubheka, Rowe-Rowe, Alletson and Perrin2013; Bain et al., Reference Bain, Finn and Booke1988). Loss of riparian vegetation through bank maintenance, such as cutting or strimming, reduces denning and resting sites, exposes otters to more disturbance, alters shading and affects river productivity (Naiman et al., Reference Naiman, Decamps and Pollock1993). Siltation from agriculture and forest felling decreases water clarity and oxygen levels, harming invertebrates and fish (Ojha, Reference Ojha2021). The expansion of non-native conifer plantations, driven by afforestation efforts (Teagasc, 2017), further threatens freshwater systems by increasing acidification and altering hydrological regimes (Riipinen et al., Reference Riipinen, Davy-Bowker and Dobson2009; Feeley et al., Reference Feeley, Kerrigan, Fanning, Hannigan and Kelly-Quinn2011). Siltation risk is highest immediately after forest felling when exposed soils are vulnerable to runoff (Stott, Reference Stott2020). Pollution from agriculture (fertilizers, pesticides) and domestic waste further degrades water quality. Water abstraction, mainly for agriculture, disrupts flow and can introduce pollutants, particularly when extracted via slurry tankers prone to backflow contamination. Water quality across Europe has shown little improvement since the mid 2010s (Haase et al., Reference Haase, Bowler, Baker, Bonada, Domisch and Garcia Marquez2023), with only 39% of Republic of Ireland rivers achieving good or high biological status, 17% classified as poor or bad, and nearly 70% failing to meet good status (Rivers Trust, 2024). Our analysis indicates siltation (now present at over half of sites), pollution (at over a third of sites, including agricultural pollution at over a fifth of sites), water abstraction, and conifer plantations have reached their highest recorded levels since the early 1980s.
Otter populations in Ireland have demonstrated resilience, remaining widespread with largely intact habitat at the national scale. However, evidence suggests that local declines in recent decades are probably linked to pressures principally from agriculture, including water quality degradation from siltation, pollution and riparian corridor loss, as well as other sources of human disturbance, including development. Although none of these threats appear existential at the national level, they may significantly impact populations locally. Where conservation measures may be warranted, efforts should prioritize restoring water quality by mitigating the effects of pollution, re-establishing riparian vegetation and natural river dynamics, protecting semi-natural habitats and minimizing disturbance from development (Weinberger et al., Reference Weinberger, Kranz and Montgomery2016).
In summary, the limitations and assumptions of the survey and analytical methods used here included: unequal number of survey sites between survey periods (not every site was surveyed in each period); spatial variation in sample sizes, including between habitat types (lower effort at lakes and the coast); potential biases from variation in surveyor experience; differences in conditions between survey periods, most notably variation in detectability as a result of rainfall and flooding; uncertainty in population estimates owing to a simple multiplicative model based on assumed home range size and densities across landscape types; and an average population correction factor to account for assumed negative biases as applied from the previous survey. In addition to attempting to resolve these, future studies should focus on disaggregating detection from occupancy probabilities (e.g. Twining et al., Reference Twining, Fuller, Sun, Calderón-Acevedo, Schlesinger and Berger2023, Reference Twining, Kramer, Perkins and Fuller2024a,Reference Twining, Kramer, Perkins and Fullerb) to capture the magnitude of any population change more accurately. Surveys should consider adopting methods that minimize negative biases, for example, camera trapping or water sampling for environmental DNA detection (e.g. Broadhurst et al., Reference Broadhurst, Gregory, Bleakley, Perkins, Lavin and Bolton2021; Jamwal et al., Reference Jamwal, Bruno, Galimberti, Magnani, Casiraghi and Loy2023), radio or GPS tracking for home range estimation, and individual genotyping for density estimation. Advances in both survey methodologies and statistical analyses may go some way towards resolving uncertainty in otter population trends.
Supplementary material
The supplementary material for this article is available at doi.org/10.1017/S0030605325102391
Author contributions
Study design: NR, LM, FM; fieldwork: KD, RS, KC; data analysis, writing: NR, LM, FM.
Acknowledgements
This research was funded by the National Parks and Wildlife Service, Ireland (1302_NOTS22) and the Northern Ireland Environment Agency via the National Museums Northern Ireland. We thank Liam Lysaght and Oisin Duffy, National Biodiversity Data Centre, Waterford, and Damian McFerran, Chloe Craig and Amy Laird, Centre for Environmental Data and Recording, for hosting citizen science webpages and collating biological records; 118 otter surveyors (see Supplementary Material 2 for full acknowledgements list); and landowners for granting access to sites.
Conflicts of interests
None.
Ethical standards
No government licences or university ethics approval was required. This research abided by Oryx guidelines on ethical standards.
Data availability
The data that support the findings of this study are available on request from the funders: the National Parks and Wildlife Service, Republic of Ireland (npws.ie/maps-and-data/sensitive-data-access) and the Northern Ireland Environment Agency (daera-ni.gov.uk/articles/access-information).





 Open access

