





Although there have been modest improvements in the past several decades, the diet quality of American adults remains poor(Reference Shan, Rehm and Rogers1). Low quality diets in the USA have been a critical public health concern given the high and increasing rates of diet-related diseases such as CVD and its risk factors, including diabetes, obesity and hypertension(Reference Mohebi, Chen and Ibrahim2). To improve dietary intake and health, the 2020–2025 Dietary Guidelines for Americans recommends cooking meals at home(3). Evidence suggests that more frequent home cooking is associated with better diet quality, as measured by higher intake of fruits and vegetables(Reference Wolfson and Bleich4,Reference Farmer, Lee and Powell-Wiley5) , lower intake of total energy, fat and sugar(Reference Wolfson and Bleich6) and higher adherence to various diet quality metrics(Reference Farmer, Lee and Powell-Wiley5,Reference Wolfson, Leung and Richardson7–Reference Tiwari, Aggarwal and Tang10) . Likewise, higher consumption of food away from home, including restaurant and fast food, is associated with poorer diet quality(Reference Tiwari, Aggarwal and Tang10–Reference Monsivais, Aggarwal and Drewnowski12), weight gain(Reference Hodge, Um and McCullough13) and adverse health outcomes(Reference Bahadoran, Mirmiran and Azizi14,Reference Du, Rong and Sun15) . However, overall time spent cooking has decreased over the past 30 years, and household spending on food away from home has increased(Reference Saksena, Okrent and Onekwe16). Fast food is of particular concern. One-third of Americans consume fast food on any given day(Reference Shah, Fryar and Ahluwalia17), which tends to have a poor nutritional profile(Reference An11,Reference Vercammen, Frelier and Moran18) and is associated with numerous adverse health outcomes(Reference Bahadoran, Mirmiran and Azizi14,Reference Du, Rong and Sun15) .
The concept of ‘food agency’ has been proposed to examine cooking and food provisioning behaviours beyond cooking frequency and cooking skills alone(Reference Trubek, Carabello and Morgan19,Reference Wolfson, Bostic and Lahne20) . The food agency framework recognises that individuals’ daily food preparation decisions are shaped by social and external factors as well as personal factors(Reference Trubek, Carabello and Morgan19,Reference Wolfson, Bostic and Lahne20) . Therefore, a food agency approach may be an important and useful way to holistically evaluate food provisioning and preparation behaviours and their relationships with other food-related practices and health outcomes. Prior evidence has shown that cooking skills and frequency are associated with diet quality(Reference Wolfson, Lahne and Raj21–Reference Lavelle, Bucher and Dean23). Furthermore, prior research has demonstrated that households with higher cooking frequency consume fast food less frequently(Reference Wolfson and Bleich6,Reference Taillie and Poti24) and negative attitudes towards cooking are associated with more frequent fast-food consumption(Reference Dave, An and Jeffery25). However, the relationship between food agency and fast-food consumption specifically remains largely unknown. While there is some evidence that food agency is associated with greater consumption of fruits and vegetables(Reference Bélanger, Lamarche and Beaulieu26) and more frequent cooking at home(Reference Wolfson, Lahne and Raj21), the relationship between food agency and overall diet quality has also not been studied in a national sample of US adults. Given its holistic conceptualisation, it is important to further understand and examine the relationship between food agency and food-related behaviours to inform policies and interventions that aim to improve these behaviours and, at a larger scale, improve diet quality and health outcomes.
The objective of this study was to examine the associations of food agency with frequency of cooking dinner at home, frequency of eating fast food and diet quality in a large, national sample of US adults. We hypothesised that higher food agency would be associated with more frequent home cooking, less frequent fast-food consumption and higher diet quality.
Methods
Study population
This cross-sectional study uses data from an online, national survey of US adults fielded in November 2023 via with CloudResearch’s Prime Panels, an online survey participant recruitment platform that uses market research panels to recruit a diverse sample representative of the US population. Quotas benchmarked to 2019–2020 US Census data were used to ensure that the sample distribution of gender, age and race and ethnicity reflected that of the national population. The survey, which took approximately 20 min to complete, was administered to assess diet quality, food agency, food security status and other food- and cooking-related behaviours among the general US population. Power calculations were not completed a priori due to the exploratory nature of the survey; sample size was determined based on the available budget.
Adults >18 years old living in the USA were eligible for the survey. In total, 9835 people initiated the survey. Participants were removed if they did not consent (n 1050), completed <90 per cent of the survey (n 1024), were younger than 18 years old (n 63), did not live in the USA (n 88), failed at least one of three attention checks (n 2227), were identified as bots or duplicates by Qualtrics (n 370), gave fraudulent responses as identified by Qualtrics (n 185), completed the survey in less than 10 min (n 333) or gave incomplete (n 26) or nonsensical (n 11) answers to sociodemographic questions. For the present analysis, observations deemed to be straightlining were excluded from the analysis (n 5). The final analytic sample included 4453 adults with complete responses for all study measures.
Measures
Food agency
Food agency was measured using the shortened Cooking and Food Provisioning Action Scale (CAFPAS-short)(Reference Karlsson, Harris and Melin27). The CAFPAS-short is a shortened version of the CAFPAS, a twenty-eight-item validated measurement tool that asks participants how strongly they agree (seven-point Likert scale, ‘strongly agree’ to ‘strongly disagree’) with statements about food and cooking agency and measures three subscales: Self-efficacy (one’s self-perceived abilities to cook and prepare foods), Attitudes (one’s thoughts on and attitudes about cooking and food provisioning as an activity) and Structure (perceived non-food and external barriers to cooking and food provisioning). The development and validation of these scales have been described elsewhere(Reference Karlsson, Harris and Melin27,Reference Lahne, Wolfson and Trubek28) . The CAFPAS-short includes eleven of the original twenty-eight items (N 4 for self-efficacy, N 4 for attitudes, N 3 for structure). Response options were coded from 0 to 7, with reverse scoring applied for items considered to be negatively related to food agency. Item scores within each subscale are summed and then divided by the standard deviation of the sample population’s score in that subscale. The standardised scores from the three subscales are summed to generate an overall continuous CAFPAS-short score. The CAFPAS-short score was categorised into quartiles for analyses based on its distribution in the study sample.
Dinner cooking frequency
Frequency of cooking dinner at home was assessed with the survey question, ‘In the past 7 days, how many days did you or someone else cook food for dinner or supper at home?’, with possible responses ranging from 0 to 7 d. This question was based on the cooking frequency measure included in the 2007–2010 National Health and Nutrition Examination Survey(29,30) and was asked of all survey respondents.
Fast-food frequency
Fast-food frequency was assessed with the survey question, ‘In the past 7 d, how many times did you eat food from a fast-food restaurant (e.g. McDonald’s or Burger King)? Include take-out, delivery, drive through, or curb-side pick-up’ with possible responses ranging from 0 to 32 times. This question was adapted from the fast-food consumption measure included in the 2017–2018 National Health and Nutrition Examination Survey(31) and was asked of all survey respondents.
Diet quality
Diet quality was assessed with the Prime Diet Quality Score-30-Day screener (PDQS-30D), a validated food frequency questionnaire (FFQ) that measures frequency of intake of twenty-two food groups over the past 30 d(Reference Kronsteiner-Gicevic, Mou and Bromage32). The food groups include fourteen food groups classified as ‘healthy’ (dark green leafy vegetables; cruciferous vegetables; deep orange vegetables; other vegetables; citrus fruits; deep orange fruits; other fruits; beans, peas and soya products; nuts and seeds; poultry; fish; and low-fat dairy products (≤2 % milk fat); whole grains; and liquid oils), seven food groups classified as ‘unhealthy’ (white roots and tubers; red meat; processed meats; refined grains and baked products; sugar-sweetened beverages; sweets and ice cream; and fried foods away from home) and eggs, which are classified as neutral in a high-income setting and not included in the score(Reference Kronsteiner-Gicevic, Mou and Bromage32). The response options include less than once/month, 2 to 3 times/month, 1 to 2 times/week, 3 to 4 times/week, 5 to 6 times/week, once a day, or 2 or more times/d. Responses are scored from 0 to 6, with reverse scoring applied for unhealthy food components, and then summed to generate a PDQS-30D total diet quality score. The range of possible scores is 0 to 126 with a higher score indicating higher diet quality, that is, higher intake of ‘healthy’ foods and/or lower intake of ‘unhealthy’ foods. PDQS-30D score was analysed as a continuous variable.
Sociodemographic covariates
Participants self-reported their gender (male, female, non-binary, other), age (18–29 years, 30–39 years, 40–49 years, 50–59 years, 60–69 years, 70–79 years, 80–89 years, ≥90 years), race and ethnicity (select all that apply: Asian, Black or African American, Native American, Middle Eastern or North African, Pacific Islander, White/Caucasian, Other: Please describe), income (<$25 000, $25 000–$49 999, $50 000–74 999, $75 000–$99 999, $100 000–$149 999, ≥$150 000, prefer not to say), education (some high school, high school diploma or General Educational Development (GED), some college, college degree, graduate degree), employment (working full time, working part time, unemployed but looking for work, stay-at-home parent, retired/not looking for work, other), marital status (single/never married, married, separated/divorced/widowed, domestic partnership/living with partner, prefer not to answer), household size (1 person, 2 people, 3 people, 4 people, 5 people, 6 people, 7 people, ≥8 people) and household food security status (high, marginal, low, very low). Household food security status was measured using the United States Department of Agriculture’s 18-item Household Food Security Screener Module(33), and responses were categorised based on USDA scoring guidelines. Given sample distributions, the highest three age categories were combined into ≥70 years: ‘non-binary’ and ‘other’ were combined for gender; race and ethnicity were grouped into non-Hispanic White, non-Hispanic Asian, non-Hispanic Black or African American, non-Hispanic Native American, Hispanic and other; income categories were grouped into <$25 000, $25 000-$49 999, $50 000-$99 999, ≥$100 000 and other/refused; education level was grouped into high school/GED or less, some college and college degree or higher; and household size was grouped into 1 person, 2 people, 3–4 people and ≥5 people.
Statistical analysis
Characteristics of the study population were summarised overall and by quartile of CAFPAS-short score. Associations between food agency (CAFPAS-short and its subscales) and dinner cooking frequency and fast-food frequency outcomes used separate multivariable Poisson regression models adjusted for age, gender, race and ethnicity, income, education, employment, marital status, household size and household food security status. These sociodemographic characteristics were selected to be included in the analysis based on prior literature examining food agency and cooking frequency(Reference Wolfson, Leung and Richardson7,Reference Wolfson, Posluszny and Kronsteiner-Gicevic8,Reference Wolfson, Lahne and Raj21) . In sensitivity analyses, the model for dinner cooking frequency added fast-food frequency as a covariate (and vice versa) in addition to the full set of covariates to account for the possible inverse relationship between cooking and fast-food frequency and to test the robustness of the primary associations. We used multivariable linear regression models fully adjusted for the same set of covariates to examine the associations of food agency with PDQS-30D score. In supplemental analyses, we examined the distribution of PDQS-30D across the sample by CAFPAS-short quartile and by sociodemographic variables. Supplemental analyses also examined the association of continuous food agency with PDQS-30D using progressively adjusted linear regression models: (1) unadjusted, (2) age-, gender- and race-adjusted and (3) fully adjusted for the full set of covariates described above.
For all the primary analyses, we assessed the associations between food agency and each outcome by modelling CAFPAS-short as a categorical variable (quartiles). Tests for linear trends were estimated by running fully adjusted models with CAFPAS-short score as a continuous variable. For subscale analyses, the three subscales (Self-Efficacy, Attitudes, Structure) were run in separate regression models with each subscale as the primary predictor, independent of total CAFPAS-short, to examine their associations with the outcomes independent of overall food agency.
We used the fully adjusted models to generate post-estimation marginal estimates for dinner cooking frequency, fast-food frequency and PDQS-30D based on CAFPAS-short score quartile using the marginaleffects package in R. Pairwise comparisons of the marginal estimates between CAFPAS-short quartiles were examined to assess significant differences from Q1. Covariates in all fully adjusted models included gender, age, race and ethnicity, income, education, employment, marital status, household size and household food security status. All analyses were conducted in R version 4.4.1. All tests were two-sided, and significance was considered at P < 0·05.
Results
Table 1 presents the characteristics of the study sample overall and stratified by CAFPAS quartile. Overall, a majority of the study sample identified as female (53·7 %) and Non-Hispanic White (64·7 %). Differences in the distribution of participants in each CAFPAS quartile based on gender, age group, race and ethnicity, employment, marital status, household size and household food security status were all significant at P < 0·001. Supplemental Table S1 displays the distribution of PDQS-30D scores by sociodemographic characteristics and CAFPAS quartile. The overall mean PDQS-30D score was 53·5 ± 12·0. Those with higher income (P < 0·001 for all income categories compared to <$25 000) and higher education (P < 0·001 for some college and college degree or higher compared to high school/GED or less) also had higher PDQS-30D scores.
Sociodemographic characteristics of a nationally representative sample of US adults (n 4453) by quartiles of food agency (CAFPAS-short)

Table 1. Long description
The table presents sociodemographic characteristics of a nationally representative sample of US adults (n 4453) by quartiles of food agency (CAFPAS-short). It includes data on self-efficacy, attitude, structure, gender, age, race and ethnicity, income, education, employment, marital status, household size, and household food security status. The table has 4453 participants in total, divided into four quartiles (Q1, Q2, Q3, Q4) with varying sample sizes. Key characteristics include gender distribution (male; female; non-binary, other, refused), age groups (18–129, 30–139, 40–149, 50–159, 60–169, 70+), race and ethnicity (Non-Hispanic White, Non-Hispanic Asian, Non-Hispanic Black or African American, Non-Hispanic Native American, Hispanic, Other), income levels (<$25,000, $25,000–1$49,999, $50,000–1$99,999, >$100,000, Prefer not to say/refused), education levels (High school/GED or less, Some college, College degree or higher), employment status (Working full time, Working part time, Unemployed/not looking for work, Stay-at-home parent, Retired/not looking for work, Other), marital status (Single, never married, Married, Separated, widowed or divorced, Domestic partnership/living with partner, Prefer not to answer), household size (1 person, 2 people, 3–14 people, 5+ people), and household food security status (High, Marginal, Low, Very low). Notable trends include significant differences in the distribution of participants across quartiles based on gender, age group, race and ethnicity, employment, marital status, household size, and household food security status, all significant at P<0·0001.
CAFPAS-short, Cooking and Food Provisioning Action Scale-short score; GED, General Educational Development.
† CAFPAS-short score quartiles are Q1 = 2·27–9·87, Q2 = 9·87–11·58, Q3 = 11·58–13·22 and Q4 = 13·22–15·90.
‡ P-values obtained from Pearson’s χ 2 test.
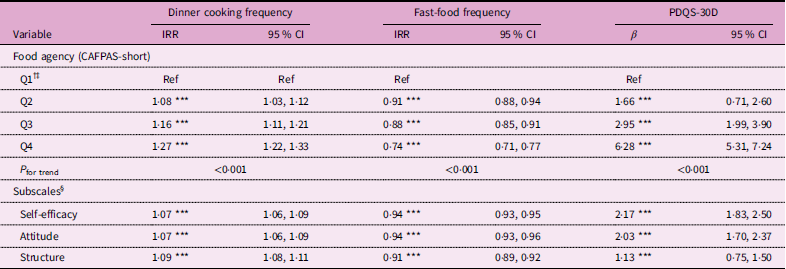
The associations between food agency and its subscales and dinner cooking frequency, fast-food frequency and diet quality (PDQS-30D score) from multivariable regression models are presented in Table 2. In fully adjusted Poisson regression models, greater food agency was associated with cooking dinner more frequently (Table 2). Q2 (incidence rate ratio (IRR) = 1·08, 95 % CI 1·03, 1·12, P < 0·001), Q3 (IRR = 1·16, 95 % CI 1·11, 1·21, P < 0·001) and Q4 (IRR = 1·27, 95 % CI 1·22, 1·33, P < 0·001) were all associated with greater dinner cooking frequency when compared with Q1, with a significant linear trend across quartiles (P < 0·001). Each of the three subscales was also associated with cooking dinner more frequently (Self-efficacy: IRR = 1·07, 95 % CI 1·06, 1·09, P < 0·001; Attitude: IRR = 1·07, 95 % CI 1·06, 1·09, P < 0·001; Structure: IRR = 1·09, 95 % CI 1·08, 1·11, P < 0·001). In sensitivity analyses, the change in magnitude and significance of the associations between food agency and dinner cooking frequency was minimal after additional adjustment for fast-food frequency (Q4 v. Q1: IRR = 1·24, 95 % CI 1·19, 1·29, P < 0·001).
Associations of food agency and its subscales with dinner cooking frequency, fast-food frequency and PDQS-30D score in the general US adult population (n 4453)

Table 2. Long description
A table with four rows and three columns comparing the associations of food agency and its subscales with dinner cooking frequency, fast-food frequency, and PDQS-30D score in the general US adult population. The table includes variables such as Q1, Q2, Q3, and Q4 for food agency, and subscales like self-efficacy, attitude, and structure. Each variable is associated with incidence rate ratios (IRR) and beta values, along with their 95 percent confidence intervals (CI). Notable trends include higher IRR values for Q4 compared to Q1 across all subscales, indicating a positive association with dinner cooking frequency and PDQS-30D score, and a negative association with fast-food frequency. The P values for trend are all less than 0.0001, indicating significant trends across quartiles.
PDQS-30D, Prime Diet Quality Score-30 Day; IRR, incidence rate ratio; CAFPAS-short, Cooking and Food Provisioning Action Scale-short score; Ref, reference group.
Dinner cooking frequency IRR are from Poisson regression models; fast-food frequency IRR are from Poisson regression models; PDQS-30D coefficients are from linear regression models. IRR are interpreted as the percentage difference in the expected number of events (days cooked, days fast food eaten) compared to Q1 (for CAFPAS analysis) or with each 1-sd increase in subscale score (for subscale analysis). All models are fully adjusted for gender, age, race and ethnicity, income, education, employment, marital status, household size and household food security status.
† CAFPAS-short score quartiles are Q1 = 2·27–9·87, Q2 = 9·87–11·58, Q3 = 11·58–13·22 and Q4 = 13·22–15·90.
‡ CAFPAS-short quartiles were modelled separately as a categorical predictor, adjusted for the sociodemographic variables described above.
§ The three subscales were run in individual regression models, independently of CAFPAS-short and adjusted for the sociodemographic variables described above. Subscales are standardised.
*P < 0·05, **P < 0·01, ***P < 0·001.
The association between food agency and fast-food frequency modelled by multivariable Poisson regression is presented in Table 2. Greater food agency was associated with less frequent fast-food consumption. Higher CAFPAS quartiles were associated with decreased fast-food frequency (P for trend <0·001). Compared to adults in the lowest quartile of food agency, adults in the highest quartile of food agency had a 26% lower expected fast-food frequency (95 % CI 23 %, 29 %, P < 0·001). Analyses of the subscales found that self-efficacy (IRR = 0·94, 95 % CI 0·93, 0·95, P < 0·001), attitude (IRR = 0·94, 95 % CI 0·93, 0·96, P < 0·001) and structure (IRR = 0·91, 95 % CI 0·89, 0·92, P < 0·001) were all associated with less frequent fast-food consumption. Additional adjustment for dinner cooking frequency in the full model slightly attenuated but did not significantly change the association between food agency and fast-food frequency (Q4 v. Q1: IRR = 0·79, 95 % CI 0·76, 0·82, P < 0·001)
Greater food agency was positively associated with higher diet quality (P for trend<0·001) as shown in Table 2. Compared to those in the lowest quartile of food agency, adults in Q2 (β = 1·66, 95 % CI 0·71, 2·60, P < 0·001), Q3 (β = 2·95, 95 % CI 1·99, 3·90, P < 0·001) and Q4 (β = 6·28, 95 % CI 5·31, 7·24, P < 0·001) of food agency each had higher diet quality. The three subscales were each associated with higher diet quality; each 1-sd increase in the self-efficacy, attitude and structure subscales were associated with a 2·17- (95 % CI 1·83, 2·50, P < 0·001), 2·03- (95 % CI 1·70, 2·37, P < 0·001) and 1·13-point (95 % CI 0·75, 1·50, P < 0·001) increase in PDQS-30D, respectively. When examining these associations in unadjusted, and age-, gender- and race-adjusted linear regression models with CAFPAS as a continuous variable (Supplemental Table S2), the magnitude of the association between food agency and diet quality was similar and remained significant across models (unadjusted: β = 1·03, P < 0·001; age-, gender- and race-adjusted, β = 1·01, P < 0·001; fully adjusted, β = 1·04, P < 0·001).
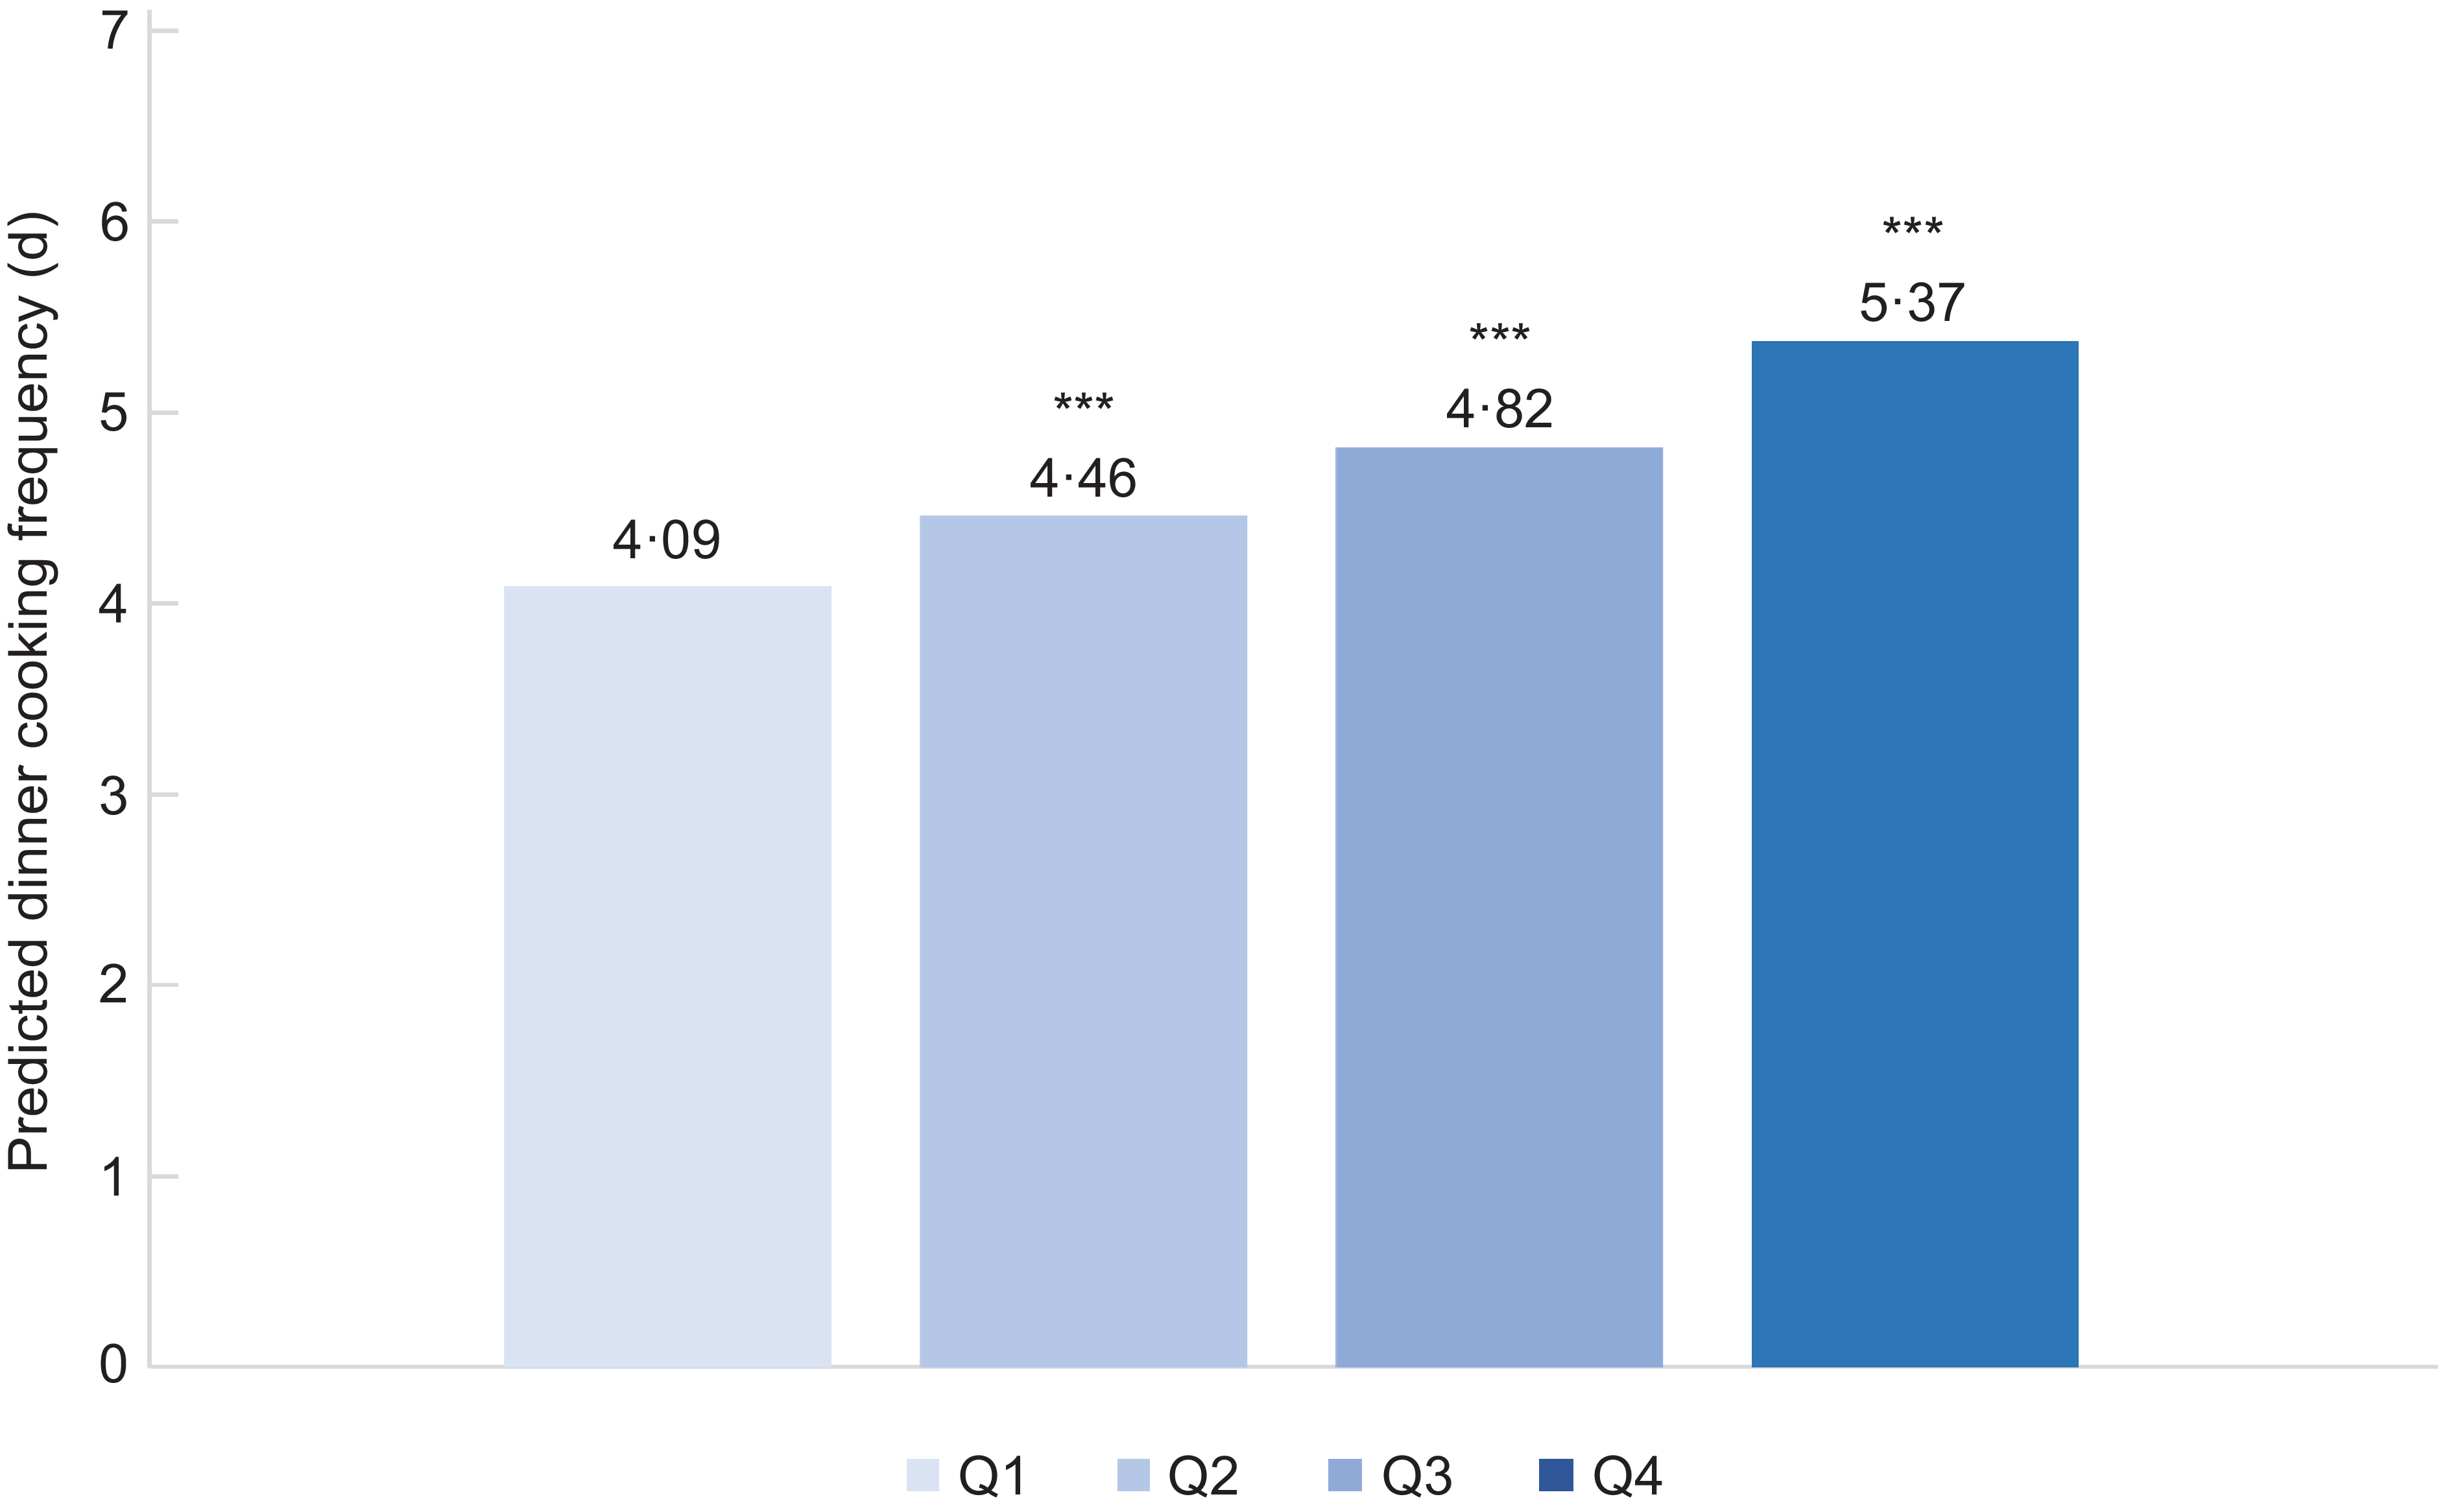
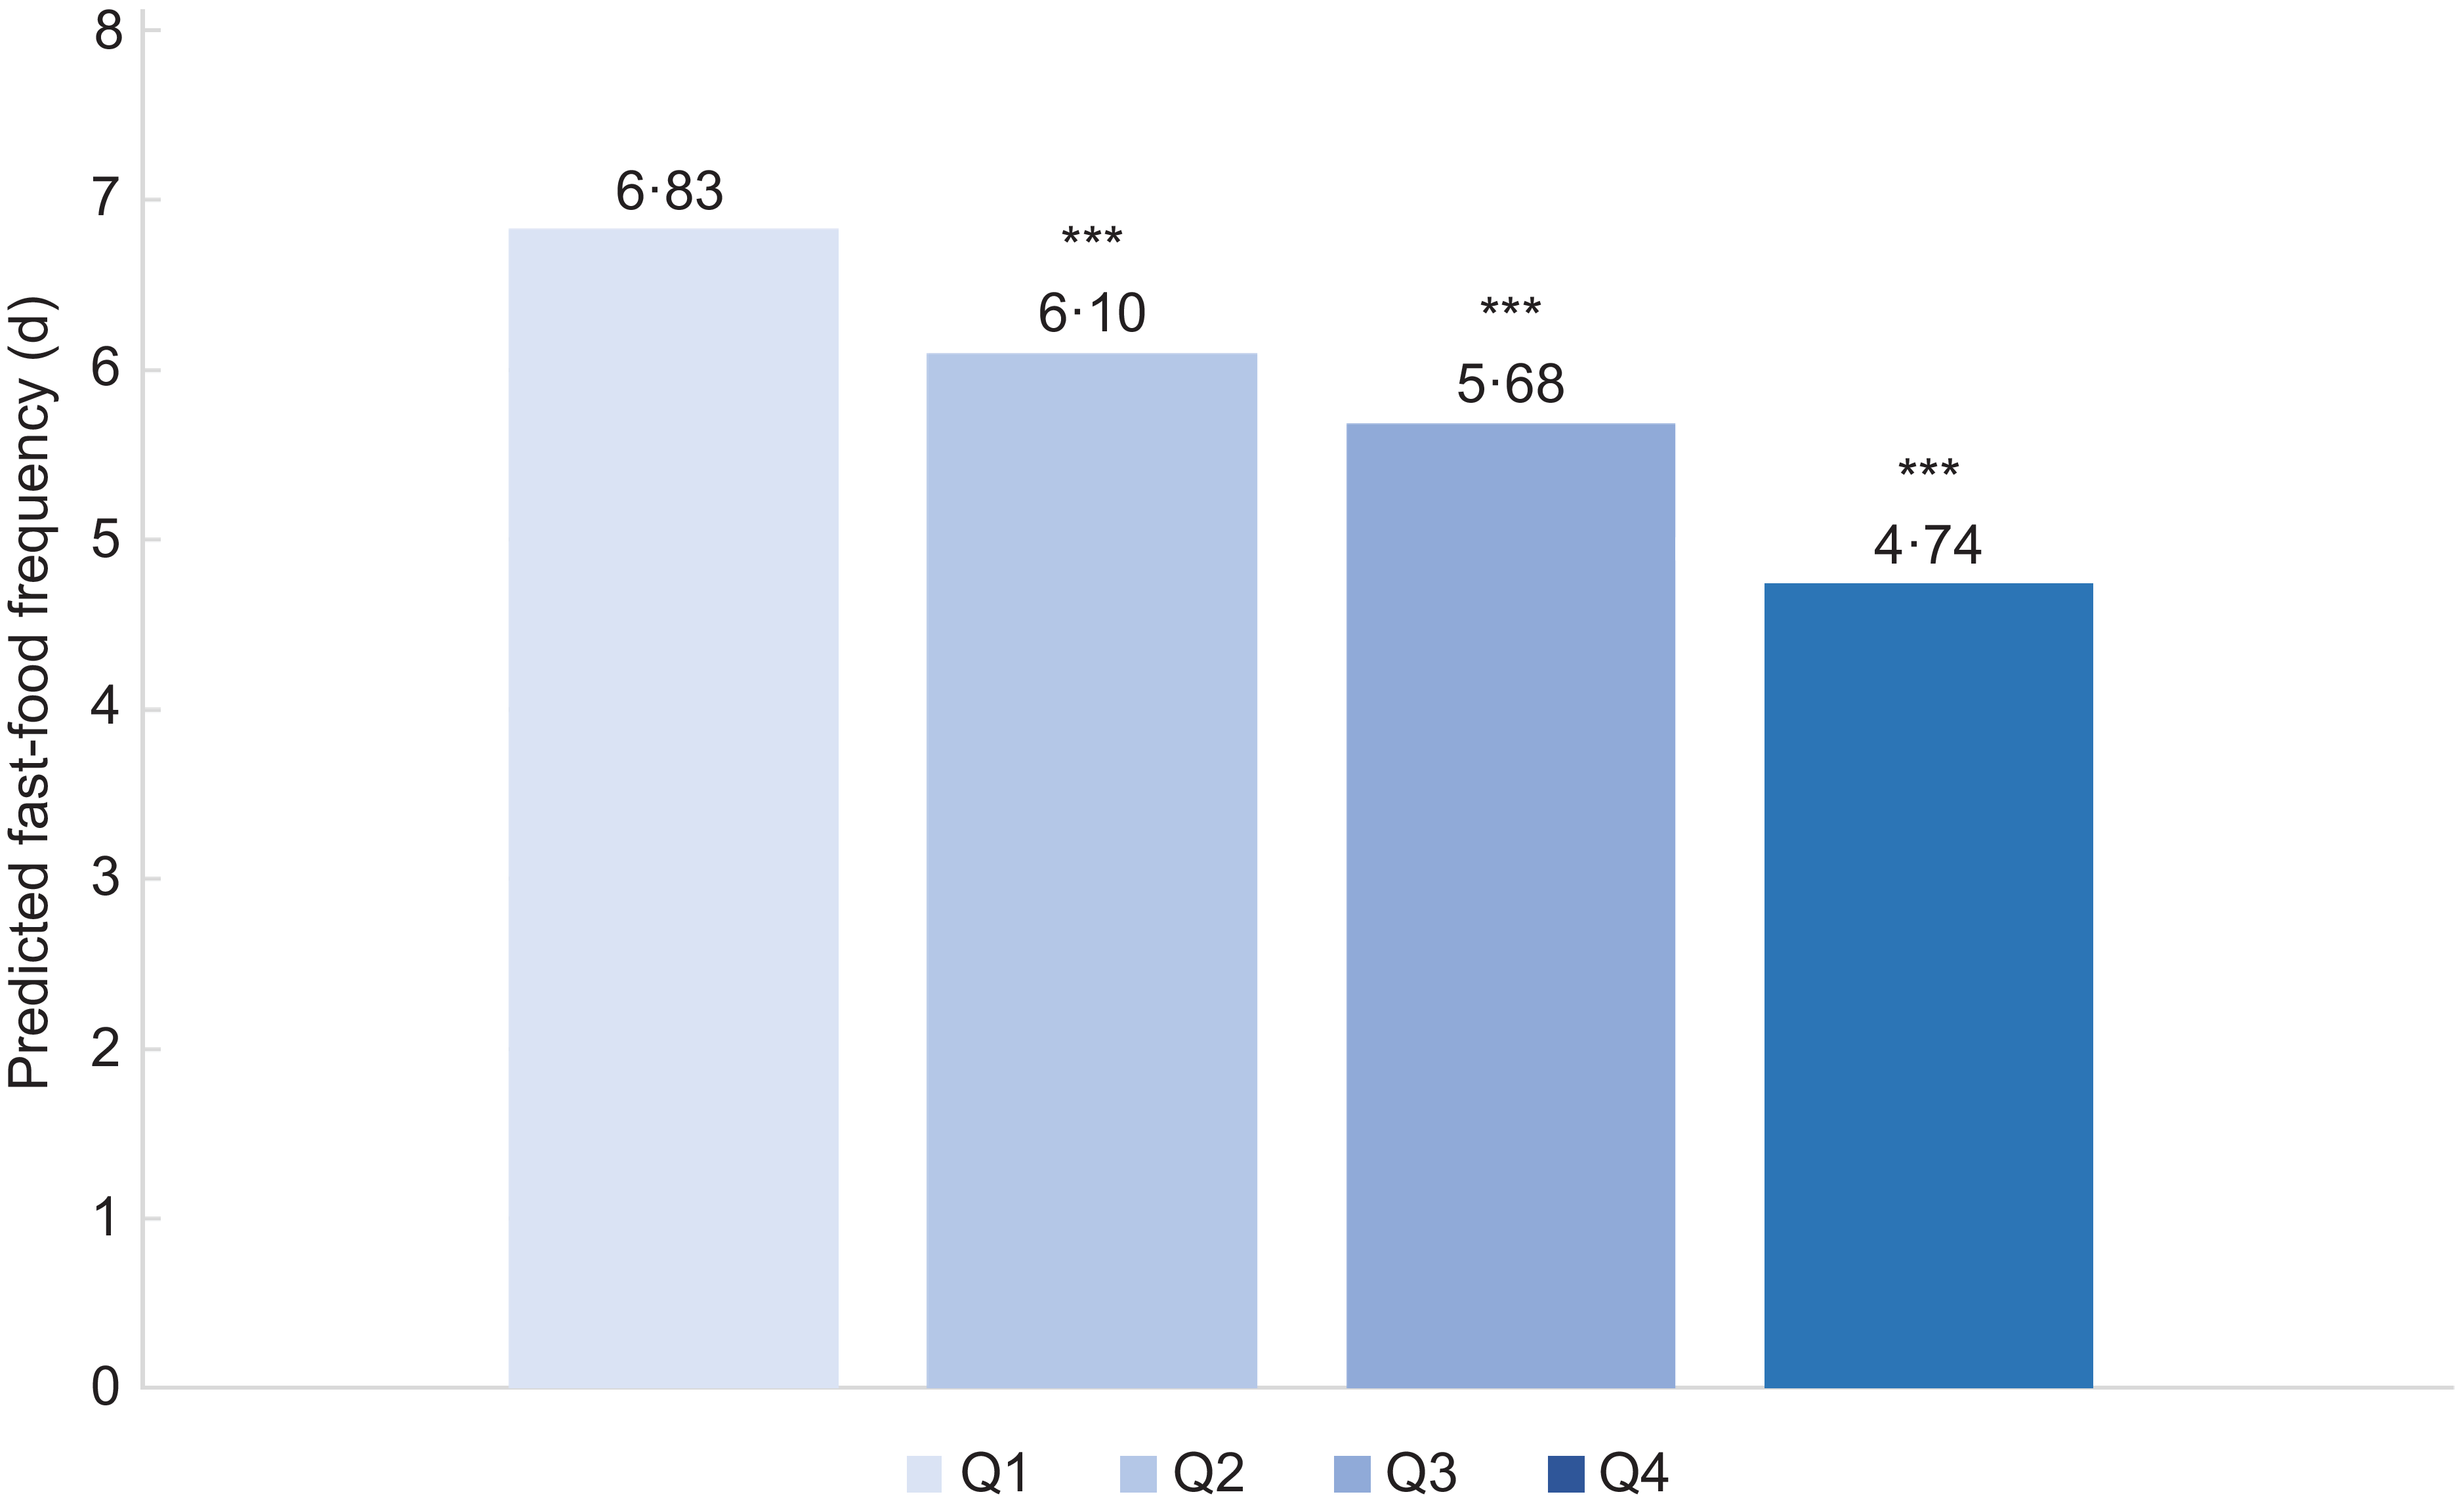
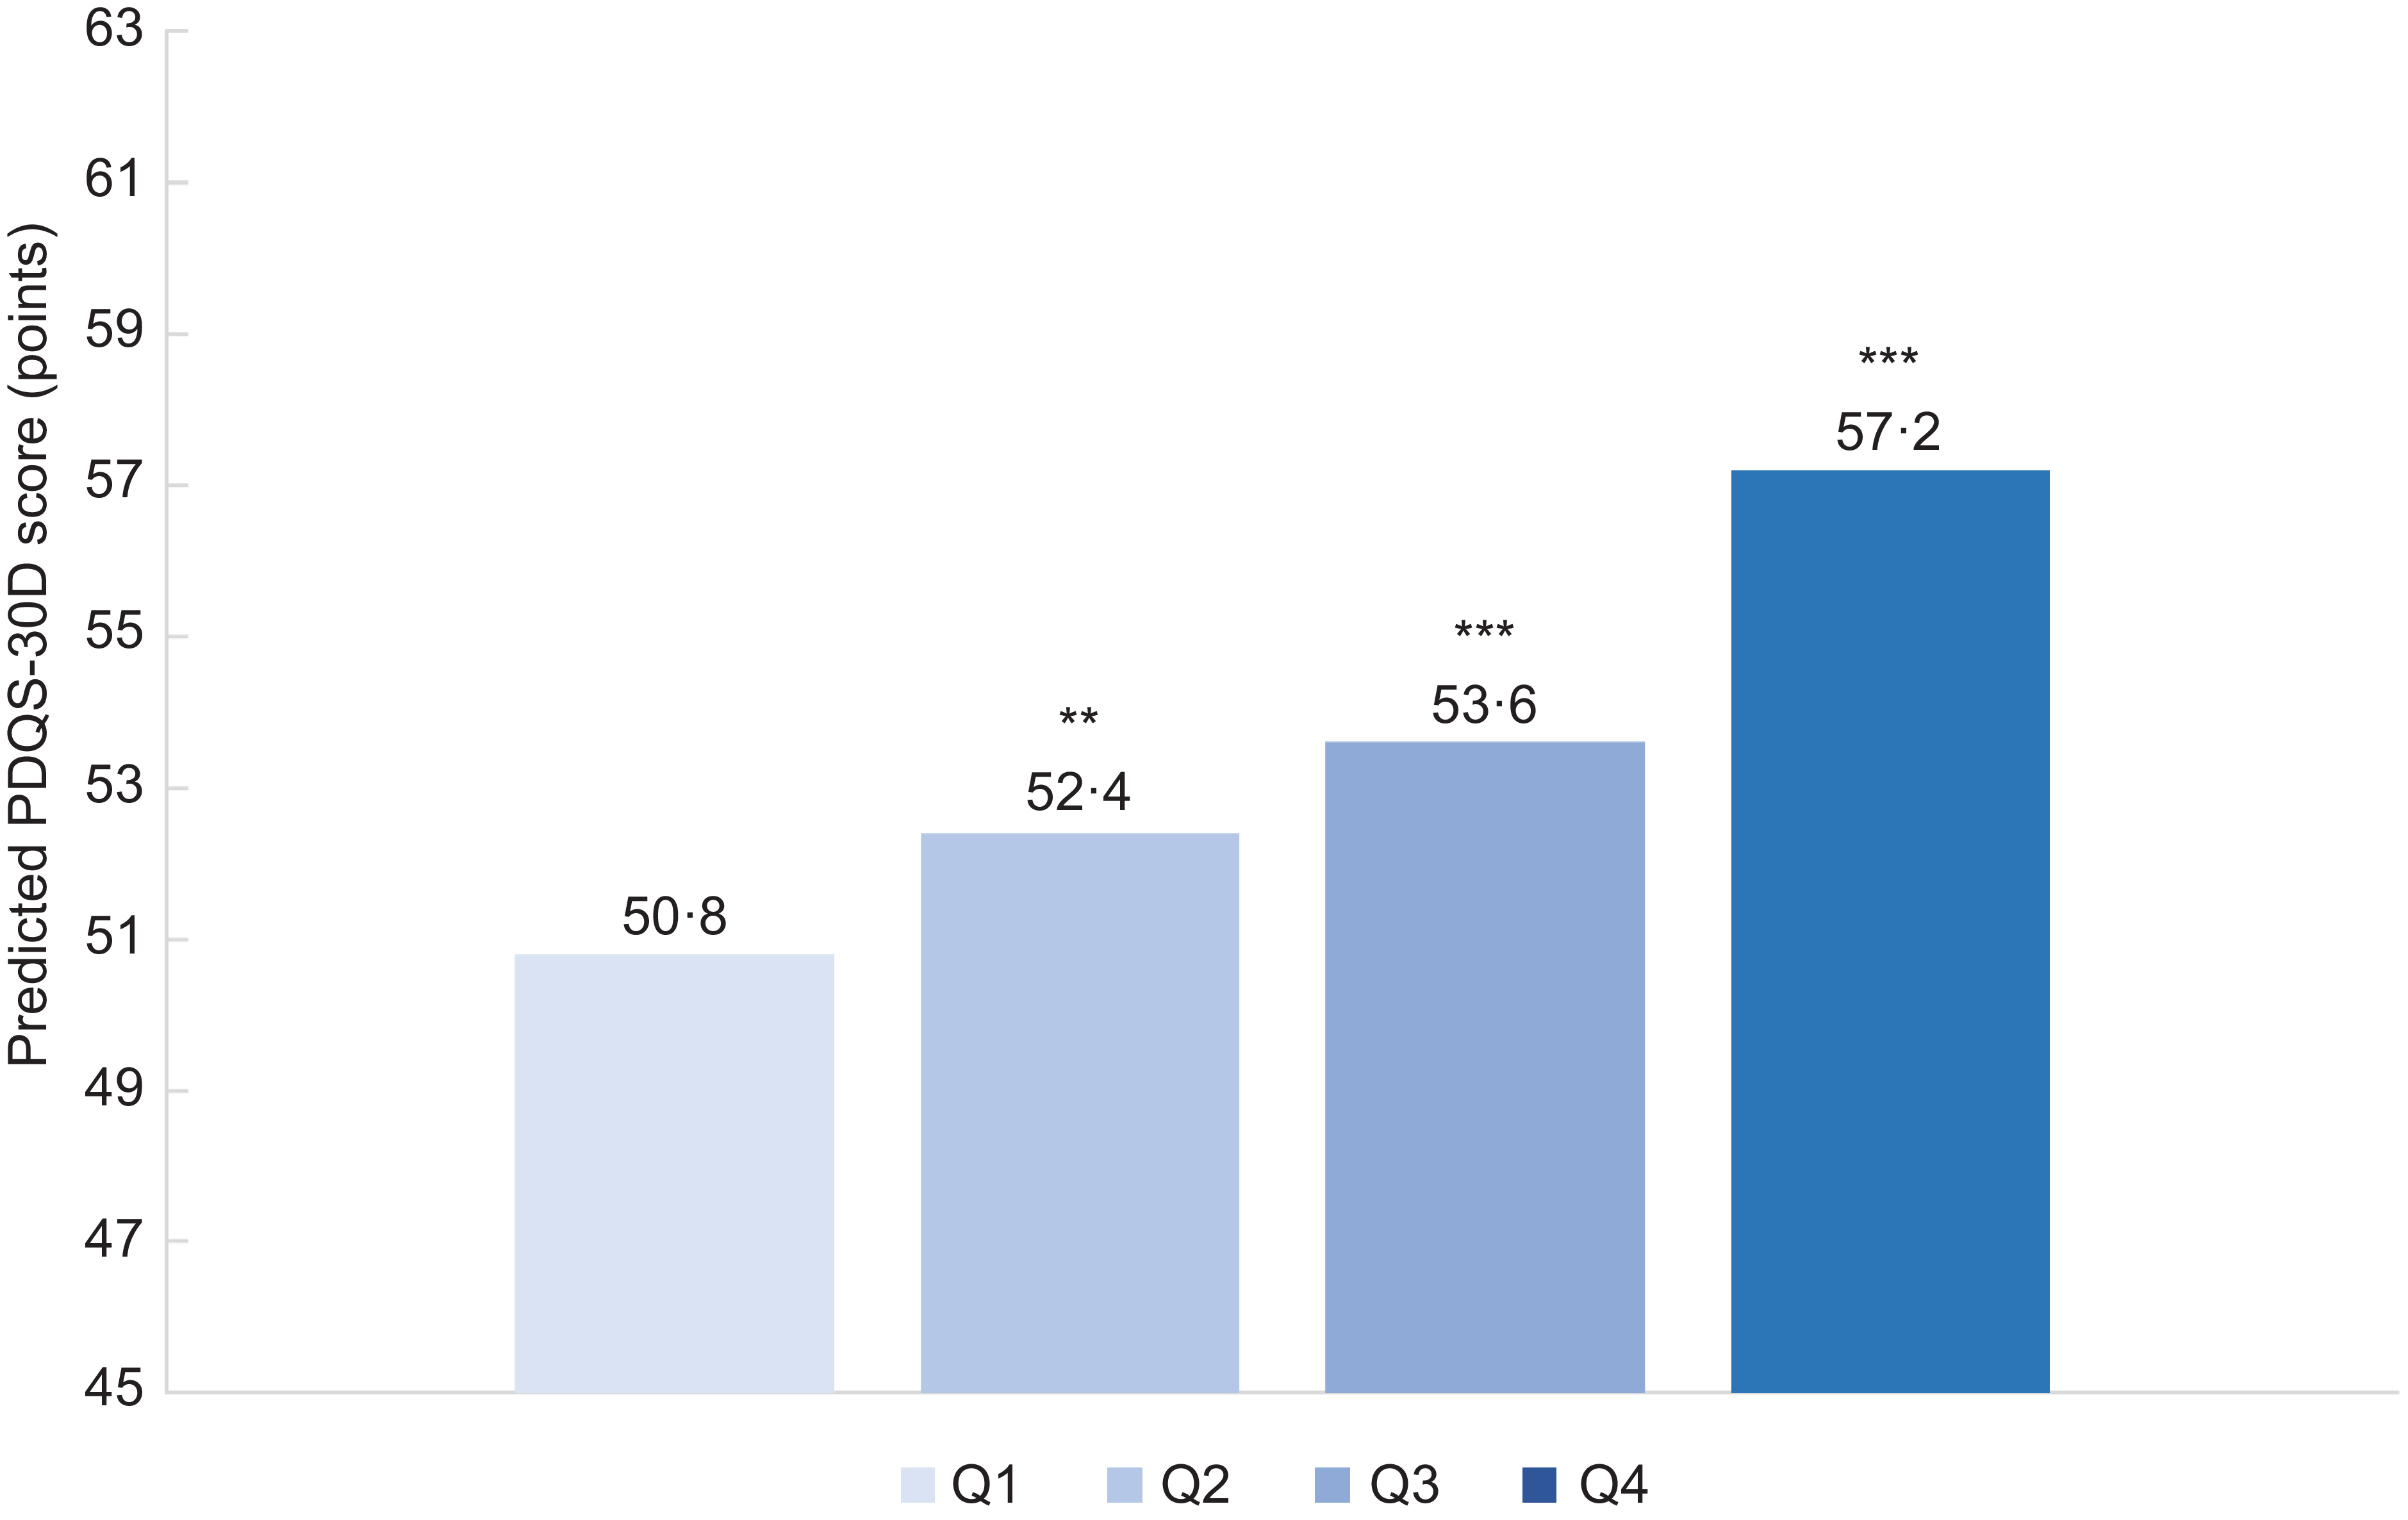
Figures 1–3 show the predicted frequency of cooking dinner (Figure 1), frequency of eating fast food (Figure 2) and total PDQS-30D score (Figure 3) across CAFPAS quartiles based on post-estimation margins from the fully adjusted regression models presented in Table 2. The predicted dinner cooking frequency and PDQS-30D score for individuals in the highest CAFPAS quartile were significantly higher than for individuals in the lowest quartile (Q4 = 5·37 d v. Q1 = 4·09 d for dinner cooking frequency, P < 0·001; Q4 = 57·2 points v. Q1 = 50·8 points for PDQS-30D, P < 0·001). Predicted fast-food consumption frequency for individuals in the highest CAFPAS-short quartile was significantly lower than for individuals in the lowest quartile (Q4 = 4·74 d v. Q1 = 6·83 d, P < 0·001). For all outcomes, the differences in predicted values for Q2 and Q3 of CAFPAS-short were also significantly different from Q1 (higher for dinner cooking frequency and PDQS-30D and lower for fast-food frequency; P < 0·001 for all pairwise comparisons except PDQS-30D Q2 v. Q1, P = 0·001).
Predicted dinner cooking frequency during the past 7 d from fully adjusted models by quartile of food agency (CAFPAS-short) score. Predicted values are based on multivariable Poisson regression model adjusted for gender, age, race and ethnicity, income, education, employment, marital status, household size and household food security status. CAFPAS-short score quartiles are Q1 = 2·27–9·87, Q2 = 9·87–11·58, Q3 = 11·58–13·22 and Q4 = 13·22–15·90. Difference from Q1 significant at *P < 0·05, **P < 0·01, ***P < 0·001. CAFPAS-short, Cooking and Food Provisioning Action Scale-short.

Predicted fast-food consumption frequency during the past 7 d from fully adjusted models by quartile of food agency (CAFPAS-short) score. Predicted values are based on multivariable Poisson regression model adjusted for gender, age, race and ethnicity, income, education, employment, marital status, household size and household food security status. CAFPAS-short score quartiles are Q1 = 2·27–9·87, Q2 = 9·87–11·58, Q3 = 11·58–13·22 and Q4 = 13·22–15·90. Difference from Q1 significant at *P < 0·05, **P < 0·01, ***P < 0·001. CAFPAS-short, Cooking and Food Provisioning Action Scale-short.

Predicted total PDQS-30D scores from fully adjusted models by quartile of food agency (CAFPAS-short) score. PDQS-30D, Prime Diet Quality Score-30 Day. Predicted values are based on multivariable linear regression model adjusted for gender, age, race and ethnicity, income, education, employment, marital status, household size and household food security status. CAFPAS-short score quartiles are Q1 = 2·27–9·87, Q2 = 9·87–11·58, Q3 = 11·58–13·22 and Q4 = 13·22–15·90. Difference from Q1 significant at *P < 0·05, **P < 0·01, ***P < 0·001. CAFPAS-short, Cooking and Food Provisioning Action Scale-short.

Discussion
In this large, national survey of US adults, we found that higher food agency (as measured by CAFPAS-short score) was associated with more frequent cooking dinner at home, less frequent fast-food consumption and higher diet quality (as measured by PDQS-30D score). In subscale analyses, we found that self-efficacy, positive attitudes and fewer perceived structural barriers to cooking were each associated with more frequent home cooking, less frequent fast-food consumption and higher diet quality. The present findings add to the evidence base, suggesting that food agency is associated with more favourable food-related behaviours and higher diet quality among US adults.
The positive association in the present findings between food agency and dinner cooking frequency is consistent with prior evidence(Reference Wolfson, Lahne and Raj21,Reference Lahne, Wolfson and Trubek28) which found food agency to be associated with higher frequency of cooking meals at home. Notably, our findings on self-efficacy and attitude agree with a previous study of Illinois adults which found self-efficacy (measured using the original CAFPAS self-efficacy subscale questions) and positive food attitudes were associated with higher frequency of home cooking and cooking from scratch(Reference Oleschuk, Choi and Ellison34). Perceived cooking skills have also been associated with greater cooking frequency(Reference Soldavini and Berner35,Reference Siddiqui, Pinho and Rutters36) , and while the CAFPAS-short does not measure technical cooking skills, perceived skills are an important component of self-efficacy and therefore food agency(Reference Wolfson, Bostic and Lahne20). Improving individuals’ food agency as a whole could be a promising approach to increase frequency of home cooking, which in turn may improve diet quality and health outcomes(Reference Wolfson, Leung and Richardson7).
Prior literature has found that individuals who cook at home more frequently consume fewer fast-food meals(Reference Wolfson and Bleich6,Reference Taillie and Poti24) and ultra-processed foods(Reference Wolfson, Martinez-Steele and Tucker37) which is consistent with the present findings. Our results are also consistent with prior evidence that cooking and food skills are inversely associated with ultra-processed(Reference Mengi Çelik, Güler and Ekici38) and fast-food intake(Reference Utter, Larson and Laska39); and more time spent on food preparation and cleanup are associated with reduced spending on food away from home and fewer visits to fast-food restaurants(Reference Monsivais, Aggarwal and Drewnowski12). The association between self-efficacy and attitudes and fast-food consumption aligns with the previously mentioned Illinois study linking greater self-efficacy and positive food attitude each with reduced reliance on convenience food(Reference Oleschuk, Choi and Ellison34). A notable finding is that the structure subscale was associated with fast-food frequency, meaning fewer structural barriers were associated with less frequent fast-food consumption. These results indicate that fast food may be a convenient, preferred option when structural barriers to cooking are present. For example, barriers like time scarcity or a food environment inconducive to healthy eating may encourage consumption of fast foods and more generally, food away from home(Reference Monsivais, Aggarwal and Drewnowski12,Reference Jabs and Devine40,Reference Janssen, Davies and Richardson41) . These findings have important implications for programmes or interventions that aim to improve food choices, as structural-, social- and environment-related barriers to food preparation may not be addressable via individual behaviour change interventions as with hard skills like cooking techniques(Reference Wang, Baranow and Kolodinsky42). It is critical, then, for such programmes to use an approach that considers not only cooking skills, confidence and knowledge but also potential structural barriers to cooking like unaffordability or inaccessibility of ingredients or perceived time scarcity in order to promote home cooking and reduce fast-food intake. For example, incorporating the use of convenient, more affordable and healthy ingredients like frozen vegetables or canned legumes or time-saving techniques like using a crockpot or preparing meals in advance(Reference Wolfson, Bleich and Smith43) can make cooking more accessible and appealing.
Our findings are consistent with previous evidence showing that food agency, measured with the full twenty-eight-item CAFPAS scale, is associated with higher consumption of fruits and vegetables(Reference Wolfson, Lahne and Raj21). The present study builds upon this work by revealing positive associations with diet quality as a whole, as measured by the PDQS-30D screener, and not just individual food groups. Notably, we also found that the self-efficacy subscale was associated with higher diet quality. This finding reflects that of a smaller cross-sectional survey of adults in Australia(Reference Lavelle, Bucher and Dean23) that found a stronger association between food skills (meal planning, budgeting, shopping) and diet quality than between cooking skills alone and diet quality. While cooking skills are important in themselves, these results highlight the importance of self-efficacy and confidence to prepare food beyond having the skillset itself. The association we found between the attitude subscale and diet quality also broadly aligns with prior evidence showing that positive cooking attitudes are associated with higher adherence to the Mediterranean diet as a proxy for a healthy diet(Reference Lorca-Camara, Bach-Faig and Bes-Rastrollo22). Based on this growing evidence base, future research should explore whether improving enjoyment and attitudes towards food preparation can contribute to improved dietary intake.
Nutrition interventions that focus on food preparation and culinary skills are being implemented to improve cooking behaviours and dietary intake(Reference Reicks, Trofholz and Stang44,Reference Hasan, Thompson and Almasri45) . However, our findings support the notion that cooking is more than a set of manual skills; it is having the self-efficacy, the positive attitude and enjoyment and the ability to adapt to one’s physical and socio-economic environment to cook(Reference Trubek, Carabello and Morgan19,Reference Wolfson, Bostic and Lahne20) . This analysis supports the need for more comprehensive interventions and policies that leverage a food agency framework to encompass the planning, procurement and preparation of food in the context of an individual’s environment(Reference Trubek, Carabello and Morgan19). Additionally, while cooking skills are important, future research should explore whether a holistic food agency approach is a more effective strategy for increasing home cooking frequency, reducing intake of fast food, and in turn, improving diet quality and health overall. For example, interventions could employ hands-on and taste-testing components to enhance enjoyment and connectedness with the process(Reference Wang, Baranow and Kolodinsky42,Reference Pope, Alpaugh and Trubek46,Reference Alpaugh, Pope and Trubek47) ; a communal setting that incorporates cooking and nutrition education from food planning to storage; and use of healthy, affordable and convenient ingredients to overcome potential structural barriers. Other strategies may include increasing funding to support the integration of cooking and nutrition education in school curricula, or the use of technology like mobile phone apps to guide meal planning, purchasing and preparation (of which some exist for Special Supplemental Nutrition Program for Women, Infants, and Children (WIC) participants that aid in grocery shopping and provide recipes(Reference Weber, Dawson and Greene48)).
Several cooking interventions that measured food agency have shown improvements in participants’ food agency from baseline to post-intervention(Reference Wang, Baranow and Kolodinsky42,Reference Pope, Alpaugh and Trubek46,Reference Alpaugh, Pope and Trubek47) . Interestingly, one food agency-based cooking intervention at the University of Vermont found that while food agency increased, there was no change in cooking frequency nor diet quality(Reference Pope, Alpaugh and Trubek46). Important to note is that this study was done with university students, who may face unique barriers to cooking due to the constraints imposed by academic life and tuition. These results, paired with the present analysis, suggest that it may be necessary to closely tailor interventions to the target population to ensure that the increases in food agency are sufficient to increase home cooking and promote healthier dietary behaviours. Future research should examine the relationship between food agency constructs, cooking frequency and diet quality in other populations and explore how this can be used to tailor food-agency-based interventions to different demographic groups based on the unique barriers they face to food procurement and preparation.
Another important consideration is the shift towards working from home due to the COVID-19 pandemic. Research indicates that individuals who work from home allocate more time to preparing food and less time to eating food away from home compared to individuals working away from home(Reference Restrepo and Zeballos49). Those who work in-person may therefore face greater structural barriers to cooking at home and consequently rely more on convenience or fast foods, revealing potential disparities in the accessibility of preparing food at home, especially as those who work from home tend to earn a higher income and are less likely to live below the poverty level(50). For many, having the time to cook at home is a luxury, and it is crucial to consider that some structural barriers may be impossible to eliminate and difficult to mitigate given the demands of the modern-day working environment. While the food agency framework acknowledges the influence of these barriers, addressing them to make home cooking more feasible for everyone may require larger systems-level changes beyond cooking skills- and attitudes-based interventions.
Limitations
This study has several limitations. First, while the survey was fielded using an online census-matched panel and quotas to achieve a sample reflecting the general US population, our sample is not nationally representative and may differ from the general population in important ways. The survey was administered only to English speakers and was web-based, so individuals with reduced access to Internet, computers or cell phones may not be adequately represented in the sample, limiting generalisability of the findings. Second, this survey measured food agency using a shortened version of the original twenty-eight-item CAFPAS scale. While the shortened version was tested to perform similarly to the original(Reference Karlsson, Harris and Melin27), results may be different with the full CAFPAS scale. However, we observed significant differences in the expected directions using the CAFPAS-short which mitigates some of this concern. Third, all measures in this survey are self-reported and are therefore subject to self-report and social desirability bias. Additionally, while we did find that higher food agency score was associated with higher PDQS-30D score, the clinical significance of the observed association is unclear. Since the PDQS-30D scale is scored 0 to 126, the magnitude of difference in diet quality between participants in the highest and lowest quartile of food agency is small, and overall diet quality was low across all levels of food agency. Fourth, cooking frequency was assessed with a single survey question about cooking dinner and not any other meals. It is possible that accounting for meals outside of dinner would produce different results. Another limitation of this question is that it only reflects number of meals cooked in the past 7 d at that point in time and therefore may not accurately represent the individual’s overall cooking frequency; relatedly, fast-food frequency also asked about the past 7 d and not about general, longer-term fast-food intake. Fifth, diet quality was assessed across 30 d, but cooking and fast-food frequency were assessed across 7 d, limiting comparability between outcomes. Finally, the cross-sectional design prevents any causal inference regarding the effect of food agency on dinner cooking frequency, fast-food frequency and diet quality. Longitudinal studies and evaluations of cooking and food interventions are needed to uncover some of these potential causal relationships.
Conclusion
In this large national sample of US adults, we examined the relationship between food agency and frequency of cooking dinner, frequency of consuming fast food and diet quality. We found that greater food agency was associated with more frequent cooking of dinner, less frequent consumption of fast food and higher diet quality. Using a food agency-based approach in existing nutrition policies and programmes and future nutrition education interventions may therefore be a promising way to improve food behaviours and choices.
Supplementary material
To view supplementary material for this article, please visit https://doi.org/10.1017/S1368980026103474
Acknowledgements
None.
Author contributions
Erin Choi conceived of study idea, developed hypothesis, performed statistical analysis, interpreted results and wrote original draft; Anna Claire Tucker developed survey; Cindy W. Leung developed survey; Julia A. Wolfson conceived of study idea, developed hypothesis, developed survey, collected data, supervised project and interpreted results. All authors reviewed, edited and approved the manuscript.
Financial support
This work was supported by National Institute of Diabetes and Digestive and Kidney Diseases (K01DK119166, PI: Wolfson). The funder had no involvement in the collection, analysis and interpretation of data.
Competing interests
All authors report no conflicts of interest.
Ethical standards
This study was conducted according to the guidelines laid down in the Declaration of Helsinki, and all procedures involving research study participants were approved by the Institutional Review Board of the Johns Hopkins Bloomberg School of Public Health. Written informed consent was obtained from all subjects.



 Open access

