INTRODUCTION
Analyzing the radiocarbon fraction in tree rings is fundamental to the radiocarbon method in order to calibrate 14C years into calendar years. Substantial work has been conducted during the past ca. 40 years to construct a calibration curve covering the last 50,000 years, of which the last 13,900 years are covered by tree rings (Reimer et al. Reference Reimer, Bard, Bayliss, Beck, Blackwell, Ramsey and Buck2013). The vast majority of data comprising the calibration curve have decadal time resolution. However, with the discovery of fast changes in the atmospheric 14C/12C, likely due to solar proton events, the so-called Miyake events (Miyake et al. Reference Miyake, Nagaya, Masuda and Nakamura2012, Reference Miyake, Masuda and Nakamura2013), there is an increasing interest in measuring 14C at annual resolution. This requires a large number of tree-ring samples to be pretreated. Furthermore, to measure radiocarbon with annual resolution, it is necessary to ensure that the carbon originates from only one year and that this carbon has not been exchanged since formation. The carbon originating from cellulose has this property, whereas carbon in the lignin and hemicellulose components of wood can be exchanged with the atmosphere or cross over ring boundaries after formation (Wilson and Grinsted Reference Wilson and Grinsted1977; Leavitt and Danzer Reference Leavitt and Danzer1993; Gaudinski et al. Reference Gaudinski, Dawson, Quideau, Schuur, Roden, Trumbore, Sandquist and Wasylishen2005; Kagawa et al. Reference Kagawa, Sugimoto and Maximov2006). Moreover, earlywood in ring-porous trees is less reliable for tracking annual changes in 14C, due to a part of it being made of reserves from the previous year (see e.g. Fogtmann-Schulz et al. (Reference Fogtmann-Schulz, Østbø, Nielsen, Olsen, Karoff and Knudsen2017); Kudsk et al. (Reference Kudsk, Olsen, Nielsen, Fogtmann-Schulz, Knudsen and Karoff2018); McCaroll (Reference McCarroll, Whitney, Young, Loader and Gagen2017); McDonald et al. (Reference McDonald, Chivall, Miles and Ramsey2019)). Therefore, latewood cellulose is the preferred component for 14C measurements (Loader et al. Reference Loader, Switsur and Field1995, Reference Loader, Robertson, Barker, Switsur and Waterhouse1997; Santos et al. Reference Santos, Bird, Pillans, Fifield, Alloway, Chappell, Hausladen and Arneth2001; Nemec et al. Reference Nemec, Wacker, Hajdas and Gaggeler2010). Cellulose has the molecular formula (C6H10O5)n, and is a long-chained, carbon-based polymer. Hemicelluloses are various polysaccharides, and cellulose and hemicelluloses are collectively referred to as holocellulose. α-Cellulose is defined as the part of holocellulose that is insoluble in 17.5% sodium hydroxide (NaOH) at room temperature and is the material most similar to pure cellulose that can be extracted from wood samples. It consists mainly of cellulose with only a minor fraction of some resistant hemicelluloses (Green Reference Green and Whistler1963). Accordingly, we produce α-cellulose for our measurements of non-resinous wood, using a method build upon the Jayme-Wise method presented in Green (Reference Green and Whistler1963). The two main steps are: Removal of lignins by oxidative delignification, and removal of hemicelluloses by alkaline extraction.
Some different approaches have been used for α-cellulose extraction, but methods following the overall scheme of the Jayme-Wise method have been found to give the purest α-cellulose and the most reliable results for radiocarbon analysis in terms of contamination (Gaudinski et al. Reference Gaudinski, Dawson, Quideau, Schuur, Roden, Trumbore, Sandquist and Wasylishen2005; Anchukaitis et al. Reference Anchukaitis, Evans, Lange, Smith, Leavitt and Schrag2008). For our measurements, we began using a revised version of the method of Loader et al. (Reference Loader, Robertson, Barker, Switsur and Waterhouse1997) (henceforth referred to as the Loader method). This method was developed for measuring stable carbon isotopes.
Lignins are removed by bleaching using a sodium chlorite, NaClO2, solution (Green Reference Green and Whistler1963), where an acidified solution of sodium chlorite provides the chlorite oxidizer. Preferentially, acetic acid, CH3COOH (Loader method) is used, because acetic acid acts as a buffer keeping pH constant. This has proven to work well for stable isotope analysis for climate research using tree rings (e.g. Mullane et al. (Reference Mullane, Waterhouse and Switsur1988); Loader et al. (Reference Loader, Robertson, Barker, Switsur and Waterhouse1997)). The cellulose must be washed thoroughly at the end of the pretreatment to ensure that all carbon present in the acetic acid is removed from the cellulose otherwise it could influence 14C activity in the produced cellulose. To minimize this small risk, it has been suggested to replace the acetic acid with hydrochloric acid, HCl (Southon and Magana Reference Southon and Magana2010). The acetic acid has a higher pH-value than hydrochloric acid, but Southon and Magana (Reference Southon and Magana2010) report no loss of bleaching efficiency with hydrochloric acid. Due to these processing concerns, we have also made radiocarbon measurements using the method of Southon and Magana (Reference Southon and Magana2010) (henceforth referred to as the Southon method), with some minor changes based on our experience with the Loader method.
The two different methods tested in this study also differ in number and length of bleaching steps as elaborated in the following sections. The length of the delignification is investigated by comparing infrared spectra of samples being delignified for variable amounts of time. Moreover, the Southon method finishes with an acid wash after the alkaline extraction. This is because a strong alkaline solution can absorb carbon dioxide from ambient air forming sodium carbonate, which is a potential contamination source for radiocarbon analysis. A subsequent acid wash will dissolve such sodium carbonate. Loader et al. (Reference Loader, Robertson, Barker, Switsur and Waterhouse1997) also includes this step, but it was not included in the revised version followed in this study as the additional acidified chlorite step would also ensure removal of any residual NaOH. By comparing radiocarbon ages of background samples pretreated with and without this hydrochloric acid wash, the effect of these treatments could be investigated.
Here we report on a method that allows up to 48 samples to be pretreated per batch. Furthermore, we will report on modifications to the method that we have made in order to make sample pretreatment more efficient.
SAMPLES
An oak (Quercus sp.) wood sequence was acquired from the Danish Oak Chronology by the Danish National Museum. This sequence was dendrochronologically dated (Eriksen Reference Eriksen1996), and is referred to as Sch. Latewood (LW) from a single thick ring from Sch, dated to AD 1420 (AAR-26314) was divided in 34 different samples and subjected to different steps of the pretreatment (the Loader method as described below) in order to test the purity of the extracted samples. These samples were not radiocarbon analyzed.
Twenty annual LW samples from the years 1439–1458 AD from Sch (AAR-22701-22720) were pretreated using the full Loader method. These samples were used to assess the quality of the graphitization and AMS measurements, since the sample material was divided in two after the pretreatment. One part was radiocarbon analyzed at Aarhus AMS Centre (AARAMS); the other part was radiocarbon analyzed at the radiocarbon dating laboratory at Lund University.
In order to assess the background contamination at AARAMS, two different backgrounds went through the pretreatment methods described below. One was a piece of oak stratigraphically dated to the Eemian (Adolphi et al. Reference Adolphi, Güttler, Wacker, Skog and Muscheler2013), and the second was a piece of kauri (Agathis australis) from Marine Isotope Stage 7 (MIS7) provided by P. Reimer at Queen’s University Belfast. Two Eemian oak samples and four MIS7 Kauri samples were cut from the pieces and pretreated following the AARAMS method, based on the Southon method, and the rest of the samples were pretreated using the Loader method.
We also measured a charcoal background that is routinely used in the AARAMS laboratory for reference and comparison. This background was not pretreated as a part of this study. It was pretreated in a similar way as the wood samples but following an acid-base-acid (ABA) pretreatment procedure instead (Brock et al. Reference Brock, Higham, Ditchfield and Ramsey2010).
METHODS
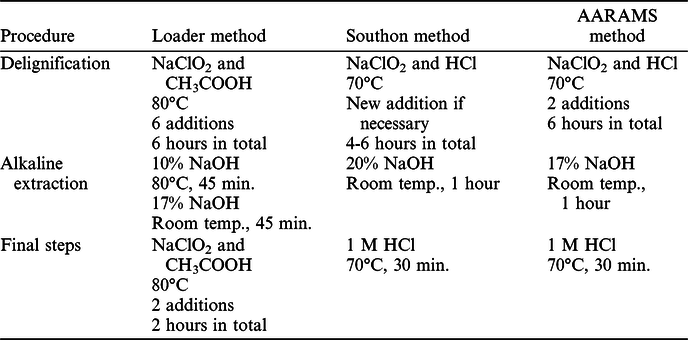
The wood samples were cut into pieces with approximate dimensions of 15 mm by 5 mm spanning the available annual rings. This size gave enough wood to ensure that enough α-cellulose for two AMS samples (2.13–2.54 mg for each sample) was available for narrow rings. No more than 30.0 mg of wood from each sample was used, since more material would require a larger volume of reagents in the pretreatment. The pieces were cut under a microscope with a scalpel into annual samples, with earlywood (EW) and latewood (LW) being separated. To minimize the effects of photosynthates produced in previous years being incorporated into the ring being analyzed, only the LW samples were used for 14C dating. The pretreatment from bulk wood LW samples to cellulose was modified from Loader et al. (Reference Loader, Robertson, Barker, Switsur and Waterhouse1997) and Southon and Magana (Reference Southon and Magana2010) and summarized in Table 1.
The main steps of pretreatment of the revised* Loader method (Loader et al. Reference Loader, Robertson, Barker, Switsur and Waterhouse1997) and Southon method (Southon and Magana Reference Southon and Magana2010) are shown in the table as well as the resulting procedure used in the AARAMS lab. Between each part of the pretreatment, the samples are rinsed with deionized or Milli-Q water to neutral pH.

* Samples prepared in conventional water bath, with additional final bleaching stage and ultrasonic homogenization after preparation to α-cellulose.
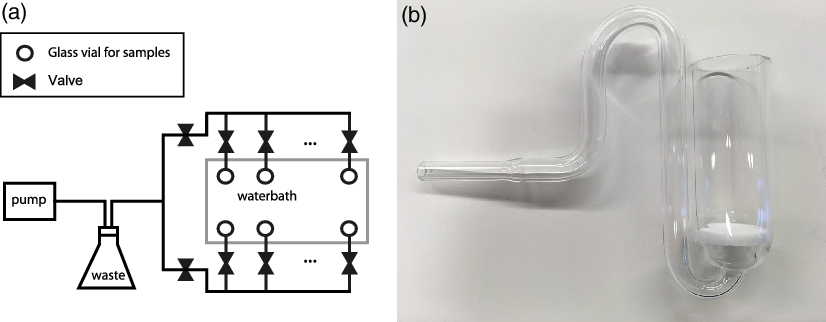
The experimental setup is shown in Figure 1a. Each annual LW sample was placed in a special “Jülich-type” glass vial made by the local glassblower (Figure 1b), modified from McCarroll and Loader (Reference McCarroll, Loader and Leng2006). This vial consists of a vessel 5 cm in height, 2 cm in diameter with a glass filter of porosity 2 in the bottom, i.e. a pore size of 40–100 μm. Under the filter, the vessel is connected to a narrow tube, 6 mm in diameter. 48 glass vials were placed in a water bath. The vials were connected by tubes to a diagraph vacuum pump. Pumping of waste chemicals were controlled by valves (see Figure 1a).
(a) The experimental setup during pretreatment. 48 glass vials are placed in a water bath and connected via valves and tubes to a vacuum pump, so chemicals from individual vials can be pumped out and collected in an Erlenmeyer flask. (b) A glass vial for one sample during pretreatment.

After all steps of the pretreatment (Table 1), the samples were transferred to 2.0 ml Eppendorf tubes. If the sample consisted of inhomogeneous material such as a mix of EW and LW or a mix of several years, it was homogenized using a Hielscher Ultrasonic sonotrode (UP200st) to ensure the sample was completely homogeneous (Laumer et al. Reference Laumer, Andreu, Helle, Schleser, Wieloch and Wissel2009). In this study, this was only done to the background samples, since the Sch samples consisted of wood from only one annual LW ring. Next, the samples were freeze dried, leaving dry α-cellulose, and subsequently weighed to determine the α-cellulose yield.
Infrared spectroscopy (ATR-FTIR, Attenuated Total Reflectance Fourier Transform InfraRed) was conducted using an instrument from PerkinElmer to characterize the quality of the cellulose pretreatment at different stages during the pretreatment process.
Infrared radiation with wavenumber from 4000 to 400 cm–1 was passed through the sample and the amount of reflected radiation was measured. Different molecular bonds absorb radiation at different wavelengths, so the absorption spectrum will depend on the molecular constituents of the sample.
Before the first spectrum of a sample was taken, a background spectrum without sample was taken, which was then subtracted from the following spectra. A sample was then placed in the instrument, and 4 scans were averaged into one spectrum using the software Spectrum™ 10 (PerkinElmer). Between each sample, the sample plate was wiped with lens paper dampened with ethanol.
The spectra were normalized such that the absorbance values were between zero and one. Zero means no light is absorbed; one means maximum light is absorbed. Defining the peak absorbance (found in all spectra between approximately 1140 and 920 cm–1) as y 1 and the absorbance in a flat area at 1877 cm–1 with no significant absorption as y 0, the normalized absorbance values (y n) are calculated as:
 $${y_n} = {{{y_i} - {y_0}} \over {{y_1} - {y_0}}}$$
where the non-normalized absorbance values are denoted y i.
For AMS analysis the α-cellulose samples were converted into CO2 using torch sealed tubes containing pre-baked CuO. The CO2 samples were then graphitized using an iron catalyst and H2 atmosphere, and subsequently analyzed on the 1 MV AMS system from High Voltage Engineering Europe at AARAMS (Olsen et al. Reference Olsen, Tikhomirov, Grosen, Heinemeier and Klein2017). A small subset of samples was analyzed at the radiocarbon dating laboratory at Lund University in Sweden (Skog et al. Reference Skog, Rundgren and Sköld2010; Adolphi et al. Reference Adolphi, Güttler, Wacker, Skog and Muscheler2013).
Radiocarbon ages are reported as conventional 14C dates in 14C yr BP based on the measured 14C/12C ratio corrected for the natural isotopic fractionation using online 13C/12C by normalizing the result to the standard δ 13C value of –25% VPDB (Stuiver and Polach Reference Stuiver and Polach1977). F 14C values are calculated as described in Reimer et al. (Reference Reimer, Brown and Reimer2004).
RESULTS AND DISCUSSION
In order to pretreat a large batch of samples efficiently we have modified the pretreatment method by testing the different steps of the Loader method and comparing with our revised version of the Southon method (called the AARAMS method). Our overall aim is to obtain the purest possible cellulose sample and to demonstrate a low background contamination.
Pretreatment and Infrared Spectroscopy
Placement of individual samples in separate vials (Figure 1b) makes it possible to have the chemicals reacting with the sample and afterwards filtering the solution out through the tube, leaving the sample material behind. This reduces the loss of material, since the sample material is kept in the same container throughout the whole procedure.
In the Loader method, the bleaching solution is changed after 1 hour. Six additions are made in total before the alkaline (NaOH) extraction, and another two additions are made after the alkaline extraction (Table 1). Infrared spectra from samples that had been bleached for 1, 2, …, 6 hours (Figure 2a) were inspected and visually compared to investigate the significance of the length of the delignification. The biggest changes were seen in the first two hours of bleaching, and after 3 hours of bleaching, no significant changes were observed. This means that the 8 hours of bleaching in the Loader method is unnecessary for our samples, and 3 or 4 hours are enough to remove most lignin in these oak samples. The same conclusion was reached by Loader et al. (Reference Loader, Robertson, Barker, Switsur and Waterhouse1997). The method has since been altered to include 8 hours of bleaching, and initially we followed this revised method in order to ensure complete delignification of our samples. Absorption spectra from samples that were bleached for 2 hours before alkaline extraction and then bleached for another two hours after alkaline extraction were compared with spectra of samples that were bleached for 4 hours before alkaline extraction. The absorption spectra showed no observable difference between these two approaches.
(a) Absorbance spectra of six wholewood subsamples that have been delignified between 1 and 6 hours. (b) Absorbance spectra of four samples. The peaks marked by letters are explained in the text.

In the Southon method, the bleaching solution is changed if needed, by monitoring the color of the solution. The solution has a yellow color due to the dissolution of chlorite. But when all chlorite ions have reacted, the solution loses its color, and no more bleaching takes place. When this happens, the solution is changed to a freshly mixed acidified sodium chlorite solution. The samples are bleached 4 to 6 hours in total. The delignification is terminated when the color of a sample is observed to be white. No bleaching takes place after the alkaline extraction. In our pretreatment, we found the yellow color to weaken and disappear from the solution of many samples after 3 hours, thus for simplicity we decided to change the bleaching solution of all samples to a freshly mixed acidified sodium chlorite solution after 3 hours. Determination of sufficiently white color of the samples themselves proved difficult due to the color of the solution in which they were submerged, so for consistency, we bleached all samples for a total of 6 hours.
The next step is alkaline extraction with sodium hydroxide to remove hemicelluloses. The Loader method uses two additions of NaOH, first a 10% added to the samples at 80°C, next a 17% solution added at room temperature. These two solutions remove different hemicelluloses. Spectra of samples that had been subjected to either one or two NaOH solutions were visually compared. The infrared spectra of our samples showed no difference between the alkali treatments, indicating that one step with a 17% NaOH solution is sufficient to remove the hemicelluloses from these samples. The Southon method uses only one addition of NaOH; a 20% solution added at room temperature. In our pretreatment following the Southon method (called the AARAMS method), we chose to use a 17% sodium hydroxide solution instead due to the definition of α-cellulose (Green Reference Green and Whistler1963).
Overall, the result of the pretreatment is investigated by visually comparing spectra of samples that have not undergone any pretreatment (wholewood), samples that have only been delignified (holocellulose) following the Loader method, and samples that went through the whole pretreatment following the Loader method (α-cellulose). These spectra are also compared to an infrared spectrum of an acquired microcrystalline cellulose powder produced by Acros Organics BVBA. These four spectra are shown in Figure 2b.
Some differences between the spectra are clearly visible. In Figure 2b most of the peaks are marked with a letter. Peak B (at 640 cm–1) is from water linked to cellulose (Fan et al. Reference Fan, Dai and Huang2012) and is present in all spectra. Peaks C (at 1592 cm–1) and D (at 1502 cm–1) are from lignin (Stewart et al. Reference Stewart, Wilson, Hendra and Morrison1995) and they are removed after the delignification, even though a small hint of a peak remains afterwards in all spectra at peak D. Peaks A (at 1729 cm–1) and I (at 1230 cm–1) are due to hemicelluloses (Pandey and Pitman Reference Pandey and Pitman2003; Fan et al. Reference Fan, Dai and Huang2012). Peak A disappears after the NaOH wash, but there is still absorbance in the area around peak I, but the peak at 1230 cm–1 is no longer there. This is because there are many other peaks in this area from cellulose, which will then be more pronounced after removal of the hemicelluloses (Fang et al. Reference Fang, Sun and Tomkinson2000), which is also seen by the fact that the spectra of the α-cellulose and microcellulose are similar in this area. The peaks E (at 1457 cm–1) and F (at 1421 cm–1) are more pronounced in the wholewood, but there is still some absorbance present in the other spectra. Fang et al. (Reference Fang, Sun and Tomkinson2000), Pandey and Pitman (Reference Pandey and Pitman2003), Rinne et al. (Reference Rinne, Boettger, Loader, Robertson, Switsur and Waterhouse2005) and Fan et al. (Reference Fan, Dai and Huang2012) all discuss different peaks from both cellulose, hemicelluloses, and lignin in this area, and it is difficult to tell the cause of this absorbance. The lignin absorbance probably causes the drop around peaks E and F from the wholewood spectrum to the holocellulose spectrum. The rest of the peaks (G at 1368 cm–1, H at 1323 cm–1, J at 1157 cm–1, K at 1030 cm–1, and L at 895 cm–1) are present in all the spectra, and they are reported to be from cellulose as would be expected, when they are not removed in the process of pretreatment (Stewart et al. Reference Stewart, Wilson, Hendra and Morrison1995; Fang et al. Reference Fang, Sun and Tomkinson2000; Pandey and Pitman Reference Pandey and Pitman2003; Fan et al. Reference Fan, Dai and Huang2012). However, Pandey and Pitman (Reference Pandey and Pitman2003) report the peaks G and J to be both from cellulose and hemicelluloses.
Overall, the spectra of the extracted α-cellulose and the microcellulose are similar, meaning a successful extraction was achieved.
Radiocarbon Analysis
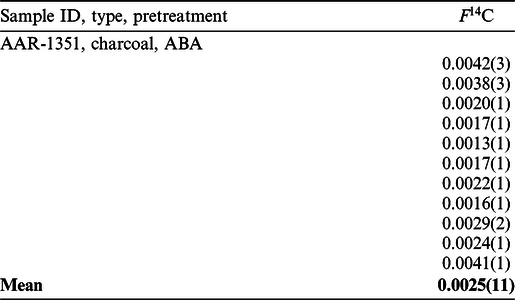
In this study, we used three different backgrounds: charcoal, MIS7 kauri, and Eemian oak. The measured F 14C values for the charcoal samples are shown in Table 2, and the measured F 14C values for the MIS7 kauri and Eemian oak samples are shown in Table 3 and Figure 3. Five Eemian oak samples and one MIS7 kauri sample were measured in Lund. The charcoal background was used to assess the graphitization and AMS measurements of the samples, by comparing the radiocarbon ages of this background obtained in this study by radiocarbon ages obtained routinely in AARAMS of this background. The mean of this background was found in this study to be 48100 ± 3500 BP (F 14C: 0.0025 ± 0.0011), which agrees well with the mean based on all measurements in AARAMS of this background of 48,800 ± 3500 BP (F 14C: 0.0023 ± 0.0010) (Figure 3).
The charcoal backgrounds used in the project with 1 standard deviation in parentheses.

The MIS7 kauri and Eemian oak backgrounds used in the project with 1 standard deviation in parentheses.

Histogram of all kauri (AAR-21745) and charcoal (AAR-1351) samples measured between 2016 and 2020 in AARAMS. A Gamma probability distribution is fitted to both histograms from which a mean and standard deviation are estimated for both kauri (AAR-21745) and charcoal (AAR-1351). For comparison, the mean F 14C background values of Eemian oak and kauri presented in Tables 2 and 3 are also shown.

The F 14C values of the backgrounds all lie in the range 0.0013–0.0073, which corresponds to 14C ages between 53,400 and 39,500 BP. Seventy-nine percent of the samples have F 14C values below 0.0050, corresponding to a 14C age of 42,600 BP. The background F 14C values are comparable to the values of the charcoal background routinely measured in AARAMS of 0.0023 ± 0.0010 during the period from 2016–2020 (Figure 3). Note that the charcoal F 14C values presented in Table 2 are a subset of these, which were processed along with the extracted cellulose backgrounds presented in Table 3.
The Eemian oak samples pretreated using the Loader method are on average 5700 ± 2300 14C yr younger than the samples pretreated following the AARAMS method (Table 3, Figure 3). This may indicate incomplete removal of acetic acid residue. However, as this result is only based on a total of 6 samples (4 Loader method, 2 AARAMS method), the dataset may not represent the full scatter of background F 14C values (Figure 3). The means of the MIS7 kauri samples from the two batches of different pretreatments are not significantly different (Table 3), indicating that any differences originating from the pretreatment chemicals is small.
The background samples dated in Lund show good agreement with the samples measured at AARAMS (Table 3). Eemian oak samples dated in Lund are normally pretreated following the BABAB procedure (Nemec et al. Reference Nemec, Wacker, Hajdas and Gaggeler2010), and the values normally obtained are F 14C: 0.0034 ± 0.0007 (Adolphi et al. Reference Adolphi, Güttler, Wacker, Skog and Muscheler2013), i.e. they are older than the samples that were pretreated in the present study. This difference warrants further testing, but a reason could be that the sample amount per batch is larger in the Lund radiocarbon laboratory, which could reduce the relative influence of any sporadic modern contamination.
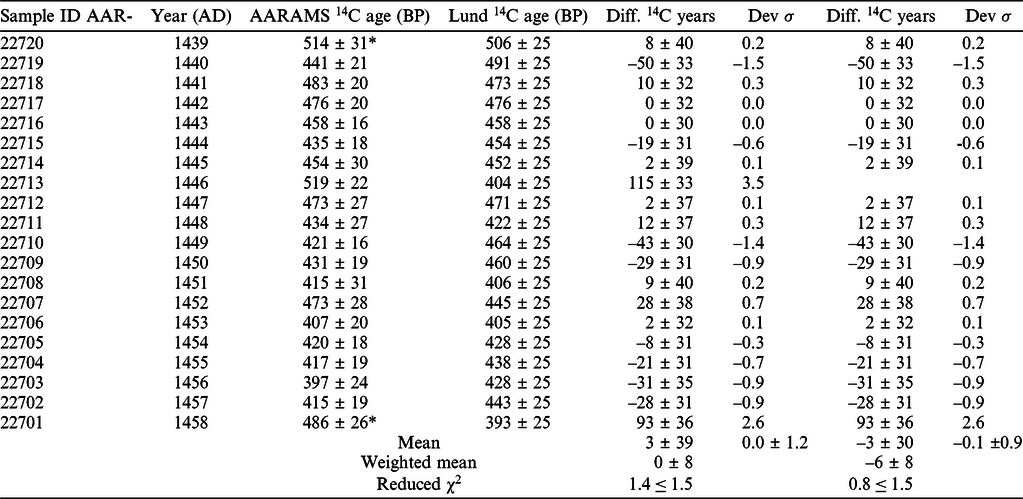
Twenty annual LW samples from the Sch oak piece were pretreated at AARAMS using the Loader method. The produced α-cellulose was subsequently divided and dated both at AARAMS and in Lund (Table 4). The samples dated in AARAMS were published in Fogtmann-Schulz et al. (Reference Fogtmann-Schulz, Kudsk, Trant, Baittinger, Karoff, Olsen and Knudsen2019). Overall, the agreement between AARAMS and Lund is good with weighted mean difference of 0 ± 8 14C years (reduced χ2: 1.4 ≤ 1.5). One sample (AAR-22713) resulted in a difference of 115 ± 33 BP corresponding to 3.5 σ. Hence for AAR-22713, AARAMS and Lund are statically different. Excluding AAR-22713 as an outlier, the weighted mean difference of the samples is –6 ± 8 14C years (reduced χ2: 0.8 ≤ 1.5). The difference between AARAMS and Lund is 0.8 σ and thus not statistically significant.
Samples from the Sch wood measured both at AARAMS and at the radiocarbon dating laboratory at Lund University. All samples are pretreated following the Loader method. Subsequently, the α-cellulose is divided in two, one sample is measured at AARAMS and the other sample is measured in Lund. The steps following the pretreatment are carried out at the different labs. The difference between the two values measured for two samples from the same year is also shown as well as the difference in terms of the standard deviation. The two samples from the year AD 1446 have the biggest deviation (3.5 σ) and could be analytical outliers. Therefore, the mean and weighted mean are calculated both with and without these samples.

* Determined as age outlier in Fogtmann-Schulz et al. (Reference Fogtmann-Schulz, Kudsk, Trant, Baittinger, Karoff, Olsen and Knudsen2019).
CONCLUSIONS
Based on a qualitative visual analysis of the placement of peaks in absorption spectra from FTIR of samples pretreated following the Loader method, the produced α-cellulose is similar to the microcrystalline cellulose, thus the pretreatment was successful in producing α-cellulose. However, some of the extra steps in the Loader method as compared to the Southon method are unnecessary, at least when pretreating oak for radiocarbon analysis. Yet, it may be necessary with other wood samples or for other applications, so a careful consideration of the steps of the pretreatment is always necessary.
A comparison of radiocarbon analyses of α-cellulose prepared from historic and ancient (background) samples detected no significant dating offset between the Loader and Southon pretreatment methods. Based upon this we have developed the AARAMS method for pretreating oak wood samples to α-cellulose for radiocarbon dating. The contamination introduced to the samples during pretreatment and graphitization is comparable with two other background samples used in the laboratory, even though the background level slightly improved when using the AARAMS (Southon) method over the Loader method. Based on 20 doublet samples measured both at AARAMS and in Lund the average inter-laboratory age difference calculated to –6 ± 8 14C years is insignificant.
ACKNOWLEDGMENTS
We acknowledge financial support from the Villum Foundation (VKR023114 and VKR010116). Funding for the Stellar Astrophysics Centre is provided by the Danish National Research Foundation (Grant agreement No.: DNRF106). N.J.L. thanks the Leverhulme Trust (RPG-2014-327) for research support.
We would like to thank Niels Bonde and Claudia Baittinger from the Danish National Museum for their help and advice. We would also like to thank the personnel of AARAMS for great help and Paula J. Reimer for providing the MIS7 kauri sample.