1. Introduction
At about three years of age, typically developing children learning Spanish use the two plural allomorphs, /-s/ and /-es/, to refer to collections of objects (Arias-Trejo, Abreu-Mendoza, & Aguado-Servín, 2014; Pérez-Pereira, Reference Pérez-Pereira1989). Comprehension of number morphology starts earlier. At about two years of age, these children understand morphosyntactic plural markers (Arias-Trejo, Cantrell, Smith, & Alva Canto, Reference Arias-Trejo, Abreu-Mendoza and Aguado-Servín2014). However, Spanish-speaking children with Down syndrome (DS) have difficulty in producing these markers (Lazaro, Garayzabal, & Moraleda, Reference Lazaro, Garayzabal and Moraleda2013), and there is indirect evidence suggesting that their comprehension of plural morphology might be impaired: English-speaking children with DS have difficulty comprehending number morphology (Joffe & Varlokosta, Reference Joffe and Varlokosta2007). Traditionally, this difficulty has been attributed to the lack of general morphological skills found in children with DS (Abbeduto, Warren, & Conners, Reference Abbeduto, Warren and Conners2007; Chapman, Schwartz, & Bird, Reference Chapman, Schwartz and Bird1991). It is unknown, however, whether children with DS have difficulty in discriminating the perceptual referents for the singular/plural distinction, leaving open the possibility that their difficulty with grammatical number markers could be rooted in a numerical deficit rather than a linguistic one. There is also evidence to suggest that other linguistic domains could contribute to the acquisition of grammatical number. For instance, the production of morphological suffixes of children with DS, as measured by a parent-report instrument, is related to their vocabulary size (Galeote, Soto, Sebastián, Checa, & Sánchez-Palacios, Reference Galeote, Soto, Sebastián, Checa and Sánchez-Palacios2014). In the current study, we investigated whether children with DS comprehend morphosyntactic plural markers, whether this comprehension is related to their ability to discriminate one object from a collection of objects, and whether it is related to their receptive vocabulary skills.
An important component of the mastery of language is the ability to understand the meaning of morphosyntactic cues in nouns, verbs, adjectives, and determiners. This ability is especially crucial for the acquisition of languages, like Spanish, that use such cues to modify word meanings. Determiners, nouns, adjectives, and verbs are modified by morphological markers of number, and all of these except verbs are also modified by morphological cues of gender. For example, in sentence (1), the determiner, the noun, and the adjective all end with the vowel o, which is typically applied to masculine words, and with the plural allomorph /-s/.

The plural is an example of the first kind of morpheme that children learn: those that have a constant and final position within the word and whose semantic content is easy to identify (Hoff, Reference Hoff2009; Peters, Reference Peters, Fletcher and MacWhitnney1995). Children learning Spanish are able to understand the plural allomorph /-s/ at two years of age (Arias-Trejo, Cantrell et al., Reference Arias-Trejo, Abreu-Mendoza and Aguado-Servín2014). These children can associate sentences with redundant plural markers as well as those with plural markers in novel nouns (see examples (2) and (3)) with images showing collections of eight objects (Arias-Trejo, Cantrell et al., Reference Arias-Trejo, Abreu-Mendoza and Aguado-Servín2014) and two objects (Pérez-Paz, Arias-Trejo, & Alva Canto, Reference Pérez-Paz, Arias-Trejo and Alva Canto2016). At the same age of two years, typically developing children learning English can map sentences with redundant plural markers; however, they learn to map the morpheme /-s/ in nouns one year later than those learning Spanish (Kouider, Halberda, Wood, & Carey, Reference Kouider, Halberda, Wood and Carey2006).

The acquisition of receptive and expressive morphosyntax is especially challenging for children with DS (Abbeduto et al., Reference Abbeduto, Warren and Conners2007; Arias-Trejo & Barrón-Martínez, Reference Arias-Trejo, Barrón-Martínez, Benavides and Schwarts2017; Chapman et al., Reference Chapman, Schwartz and Bird1991). Studies relying on parental reports have found that Spanish-learning children with DS with a mental age of 1;8–2;4 produce sentences with less morphosyntactic complexity, and they produce fewer morphological suffixes than their typically developing peers with similar mental age and vocabulary size (Galeote et al., Reference Galeote, Soto, Sebastián, Checa and Sánchez-Palacios2014). Similar results were found in children with DS who were learning another Romance language: Italian (Caselli, Monaco, Trasciani, & Vicari, Reference Caselli, Monaco, Trasciani and Vicari2008; Vicari et al., Reference Vicari, Bates, Caselli, Pasqualetti, Gagliardi, Tonucci and Volterra2004; Vicari, Caselli, & Tonucci, Reference Vicari, Caselli and Tonucci2000). More recently, results have suggested that German-speaking individuals with DS reach a plateau in their grammar comprehension in late adolescence (Witecy & Penke, Reference Witecy and Penke2017). Little is known about the mastery of Spanish plural morphosyntax by children with DS. Spanish-speaking children with DS have difficulty pluralizing nouns in a Berko-like production task, and, like typically developing children (Arias-Trejo, Abreu-Mendoza et al., Reference Arias-Trejo, Abreu-Mendoza and Aguado-Servín2014; Pérez-Pereira, Reference Pérez-Pereira1989), they have more difficulty with words requiring the allomorph /-es/ than with those that require /-s/, the predominant Spanish grammatical plural marker (Lazaro et al., Reference Lazaro, Garayzabal and Moraleda2013). To date, there are no studies investigating the comprehension of Spanish plural markers in children with DS. There is one study with English-speaking children with DS, which shows lower performance associating singular and plural markers to their perceptual referents than that of a group matched by mental age (Joffe & Varlokosta, Reference Joffe and Varlokosta2007). However, the patterns of acquisition of plural morphology in Spanish and in English, even in typically developing children, are different (Arias-Trejo, Cantrell et al., Reference Arias-Trejo, Abreu-Mendoza and Aguado-Servín2014; Kouider et al., Reference Kouider, Halberda, Wood and Carey2006).
Typically developing infants from their first year of life discriminate collections of more than four objects based on approximate numerical judgments (Coubart, Izard, Spelke, Marie, & Streri, Reference Coubart, Izard, Spelke, Marie and Streri2014; Xu & Spelke, Reference Xu and Spelke2000): they discriminate one object from two or three objects (Hyde & Spelke, Reference Hyde and Spelke2011), and they even discriminate two from three objects (Feigenson, Carey, & Hauser, Reference Feigenson, Carey and Hauser2002). However, until age 1;6 they fail to discriminate the perceptual referents for the singular/plural distinction: that is, they do not distinguish one object from more than one (Barner, Thalwitz, Wood, Yang, & Carey, Reference Barner, Thalwitz, Wood, Yang and Carey2007; Feigenson & Carey, Reference Feigenson and Carey2005). Two classical demonstrations are the failure of 12-month-olds to show a preference for a container with four crackers over a container with one (Feigenson, Carey, & Spelke, Reference Feigenson, Carey and Hauser2002), and the failure of 18-month-olds to look for the remaining balls when four were hidden and only one was retrieved (Barner et al., Reference Barner, Thalwitz, Wood, Yang and Carey2007). These results show that, although children can compare small quantities, they fail to understand ‘more than one’: the idea that two and four are both plural.
Linguistic markers of number in quantifiers, verb forms, and plural morphemes seem to facilitate distinguishing one from multiple objects. However, studies have shown that English-learning children distinguish one from four objects at age 1;10 with and without hearing linguistics markers (Barner et al., Reference Barner, Thalwitz, Wood, Yang and Carey2007), and 18-month-olds learning languages without plural morphemes (e.g., Japanese and Chinese) are able to make this distinction as well (Li, Ogura, Barner, Yang, & Carey, Reference Li, Ogura, Barner, Yang and Carey2009). Studies have also shown that hearing redundant plural markers helps English-learning two-year-olds to distinguish one from four objects (Wood, Kouider, & Carey, Reference Wood, Kouider and Carey2009). Children with DS have an ability to compare large quantities consistent with their mental age (Abreu-Mendoza & Arias-Trejo, Reference Abreu-Mendoza and Arias-Trejo2015; Karmiloff-Smith et al., Reference Karmiloff-Smith, D’Souza, Dekker, Van Herwegen, Xu, Rodic and Ansari2012; Paterson, Girelli, Butterworth, & Karmiloff-Smith, Reference Paterson, Girelli, Butterworth and Karmiloff-Smith2006), but their small quantity comparison skills are impaired (Karmiloff-Smith et al., Reference Karmiloff-Smith, D’Souza, Dekker, Van Herwegen, Xu, Rodic and Ansari2012; Paterson et al., Reference Paterson, Girelli, Butterworth and Karmiloff-Smith2006; Sella, Lanfranchi, & Zorzi, Reference Sella, Lanfranchi and Zorzi2013; for a recent review, see Porter, Reference Porter2019). However, the ability to discriminate between one object and a collection of more than three objects has not been studied in children with this syndrome.
Children with DS have great difficulty in producing morphosyntactic markers, among them plural morphemes (Galeote et al., Reference Galeote, Soto, Sebastián, Checa and Sánchez-Palacios2014), but it has not been established whether this is only a production difficulty or if their understanding of number morphosyntax is also affected. A difficulty in distinguishing one object from a collection of objects may also hinder the production and understanding of plural morphology. To investigate whether children with DS have difficulty making this distinction, we evaluated one group of children with DS and another group of typically developing Spanish-speaking children, well matched on receptive vocabulary, in two preferential looking tasks. In the plural task (Arias-Trejo, Cantrell et al., Reference Arias-Trejo, Abreu-Mendoza and Aguado-Servín2014; Kouider et al., Reference Kouider, Halberda, Wood and Carey2006), children had to map redundant, multiple morphosyntactic markers of number with a corresponding collection of novel objects. In the number task, they had to discriminate one object from a collection of two or four objects. If the difficulty children with DS have in producing plural markers is related to a comprehension deficit but not a numerical one, they should fail at the plural task but succeed at the number task, while if they have a numerical deficit, they should fail at both tasks. More specifically, if children have difficulty distinguishing one object from a collection of objects, they should have difficulty with discriminating one object from four. Studies with typically developing children have suggested that multiple cues (e.g., multiple morphosyntactic markers and object familiarity) may help children distinguish between one object and a collection of more than one (Wood et al., Reference Wood, Kouider and Carey2009); thus, success in the plural task but failure in the number task may indicate that children with DS also benefit from multiple cues to make this distinction. Finally, success in both tasks may rule out a comprehension or numerical deficit as a cause of their production deficit.
Considering that the vocabulary skills of children with DS contribute to their understanding of number words and quantifiers (Abreu-Mendoza & Arias-Trejo, Reference Abreu-Mendoza and Arias-Trejo2017; Dolscheid & Penke, Reference Dolscheid and Penke2018), and that expressive vocabulary scores of typically developing children are related to their understanding of plural morphology (Davies, Xu Rattanasone, & Demuth, Reference Davies, Xu Rattanasone and Demuth2017), we also evaluated the relationship between children’s performance in the plural task and their receptive vocabulary scores, and the relationship between the plural and number tasks.
2. Method
2.1. PARTICIPANTS
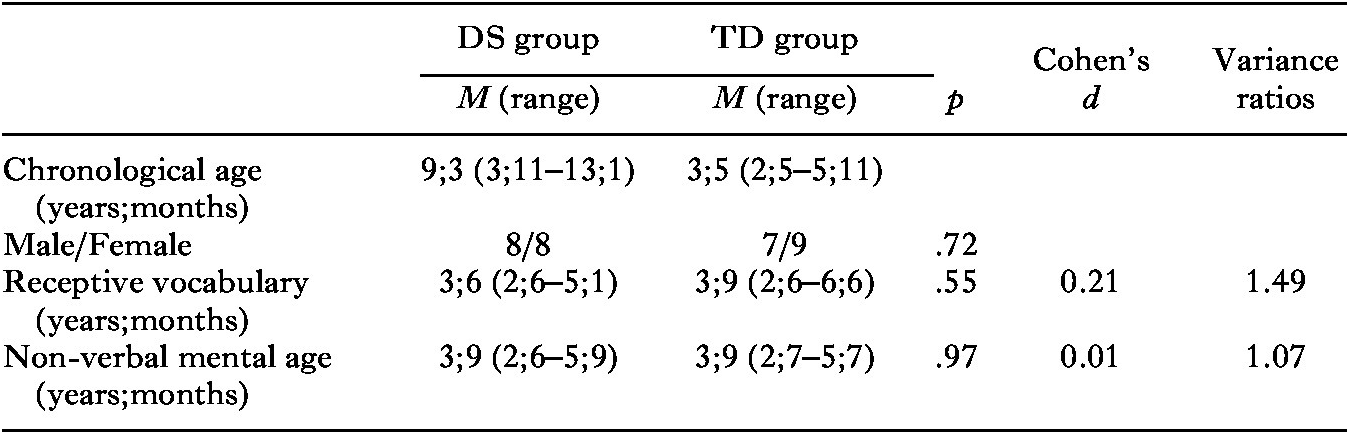
Sixty-nine Spanish-speaking children were evaluated to assemble a group of 32 participants: 16 children with DS (chronological age 3;11 to 13;1, mean age = 9;3, SD = 2;10) and 16 typically developing children (chronological age 2;5 to 5;11, mean age = 3;5, SD = 1;1). The groups were similar in gender distribution and receptive vocabulary mental age based on the Mexican adaptation of the Wechsler Preschool and Primary Scale of Intelligence-III (Wechsler, Reference Wechsler2011). Efforts were made to follow methodological recommendations (Kover & Atwood, Reference Kover and Atwood2013) to strictly match groups based on their receptive vocabulary mental aged: a p-value larger than .5 and a small size effect (Cohen’s d < 0.2); however, the variance ratio (1.49) was not within the suggested range (0.8–1.25). Table 1 shows detailed statistics for the two groups.
Group characteristics

Of a total of 69 candidates, 37 (54%) were excluded: 33 children with DS and four typically developing children. The children with DS were excluded because they did not complete the receptive vocabulary/non-verbal mental age assessment (n = 14) or the entire experimental session (n = 1), or because they did not complete the minimum number of trials required (n = 18). The typically developing children were excluded because they either had a bilingual background (n = 1), refused to complete receptive vocabulary/non-verbal mental age assessment (n = 1), or did not complete the minimum number of trials (n = 2) (see section ‘3.1 Data Pre-Processing’ for additional detail).
The attrition rate of children with DS in the preferential looking tasks (54%) was similar to that in a previous study with younger children with DS (53%; Karmiloff-Smith et al., Reference Karmiloff-Smith, D’Souza, Dekker, Van Herwegen, Xu, Rodic and Ansari2012) and comparable to one reported with older children with DS (41%; Abreu-Mendoza & Arias-Trejo, Reference Abreu-Mendoza and Arias-Trejo2015).
2.2. INSTRUMENTS AND PROCEDURES
WPPSI-III. We used three subtests from the Mexican adaptation of the WPPSI-III (Wechsler, Reference Wechsler2011): the Receptive Vocabulary subtest was used to evaluate children’s receptive vocabulary mental age, while the mental age obtained from the Block Design and Object Assembly subtests was averaged to evaluate children’s non-verbal mental age.Footnote 1 Together, these three subtests form one of the ten most recommended abbreviated versions, and have high reliability (.93) and validity scores (.74), as reported by Sattler (Reference Sattler2010). We selected this abbreviated version because it does not require verbal responses, making it more appropriate for children with DS.
Preferential looking tasks
Visual stimuli. Twenty novel colored images of objects were created for this study. For each object there were three presentations: a one-object collection, a two-object collection, and a four-object collection. To prevent children from basing their preference on continuous variables instead of number, we controlled for total cumulative area (Abreu-Mendoza & Arias-Trejo, Reference Abreu-Mendoza and Arias-Trejo2015; Im, Zhong, & Halberda, Reference Im, Zhong and Halberda2016): regardless of the number of objects in the collection, the total cumulative area was 60,000 px. Also, four different sizes of objects across images were employed to prevent children from using individual object size as a cue: 60,000, 30,000, 22,500, and 7500 px. Object images were distributed in a gray frame of 800 × 600 pixels (28.22 × 21.17 cm, 72 ppi) using randomly obtained XY coordinates that placed them at least 1 cm from one another. Each object was at least 2.5 cm from the corners of the frames.
Auditory stimuli. For the plural task, twelve pseudo-words were taken from the study of Arias-Trejo, Cantrell et al. (Reference Arias-Trejo, Abreu-Mendoza and Aguado-Servín2014), which used high-frequency syllables in the written Spanish of children aged six to ten (Justicia, Santiago, Palma, Huertas, & Gutiérrez, Reference Justicia, Santiago, Palma, Huertas and Gutiérrez1996), following a CVCV structure. Of the twelve pseudo-words employed, six were feminine (bama, lipa, pona, sela, soca, taga) and six masculine (deco, mego, pamo, polo, pono, sado). The pseudo-words were embedded in verb–determiner–noun sentences for singular:

and for plural:

Carrier phrases, mira/ve/wow ‘look/see/wow’, were recorded separately from the verb–determiner frame to guarantee that the onset of the verb was exactly the same in all sentences, but keeping the natural prosody. For the number task, the same female speaker recorded the sentence:

Apparatus. Eye-movement data were recorded using a portable eye-tracker (Tobii X2-30, Tobii Technology, Danderyd, Sweden), placed at the bottom of a 23-inch LED monitor frame, with a sampling rate of 30 Hz. Stimulus presentation was carried out using Tobii Pro Studio software, and fixations were defined using the Tobii I-VT fixation filter. Before task presentation, children’s eye-gaze was calibrated with a five-point infant calibration.
Design. The plural task consisted of 12 trials presented in two blocks of six trials each. While looking at pairs of images (one vs. two or one vs. four), children heard a sentence that referred to a single object, in half of the trials, or to a plural collection (either two or four objects), in the other half. Trials lasted 7000 ms and were divided into two phases: the pre-cue phase (0–3500 ms) and the post-cue phase (3500–7000 ms). During the first phase, children heard a carrier phrase from 2000 ms to 2800 ms, while in the second phase they heard the singular/plural markers. The second phase began with the onset of the verb es/son ‘is/are’ (see Figure 1a).
Panel (a) shows an example of a trial of the plural task. During the pre-cue phase, children heard a carrier phrase Wow/Mira/Ve ‘Wow/Look/See’ that started at 2000 ms and finished at 2800 ms. The post-cue phase started with the onset of the verb es/son ‘is/are’. Panel (b) shows an example of a trial of the number task. Images appeared on the screen at offset of the quantifier más ‘more’. The 2500 ms from 1300 ms to 3800 ms was the analysis window. See online for the color version of this figure.

The number task consisted of eight trials divided into two blocks of four trials each. In this task, children were presented with pairs of images (one vs. two or one vs. four) and instructed to look at the image with the larger number of objects. As in Abreu-Mendoza and Arias-Trejo (Reference Abreu-Mendoza and Arias-Trejo2015), trials lasted 3800 ms: during the first 1300 ms children heard the question in example (6). Then, at the offset of the question, the two images appeared and remained static from 1300 to 3800 ms (see Figure 1b). The statistical analyses considered the latter period of 2500 ms.
To capture children’s attention, an animation was displayed in the center of the screen before the beginning of each block. Sixteen sequences were created to balance the order of task and trial presentation, target side, and numerical comparison.
2.3. PROCEDURE
Before the experiment, parents gave written informed consent for their children to participate in the study. Children with DS were evaluated in a quiet room at their schools or in our laboratory, while typically developing children were evaluated at our lab. To match the groups by receptive vocabulary scores, we began by checking that an evaluated child with DS had the required number of trials for the analyses and then looked for a typically developing child with a similar receptive vocabulary mental age. To do this, we contacted typically developing children with a similar chronological age as the vocabulary mental age of their counterpart with DS. The session began with the mental age assessment, followed by a 10-minute break, and then the preferential looking task. During this last task, children were seated 65 cm from the monitor. Half of the participants of each group started with the plural task; the other half started with the number task.
The University Ethics Committee of the Universidad Nacional Autónoma de México approved this study (approval no. FPSI/422), which included verification that procedures and methods followed the Ethical Principles of Psychologists and the Code of Conduct of the American Psychological Association.
3. Results
3.1. DATA PRE-PROCESSING
To analyze children’s performance in the plural and number tasks, two areas of interest (AOI) were created for each trial: one for the target (T) and one for the distractor (D). In the plural task, the target was defined as the referenced object (either in the singular or plural) and the distractor as the other image. In the number task, the image with the collection of more than one object (two or four objects) was always the target. The AOIs coincided with the 800 × 600 px gray frames in which the novel objects were embedded.
To make sure that children were focused on the task, we excluded trials of the plural task in which they did not look at each image for at least 100 ms during the pre-cue phase and at least 700 ms of the total trial (20%). Similarly, we excluded trials of the number task in which they did not look at each image for at least 100 ms and at least 500 ms (20%) of the total trial. Finally, we excluded children who did not complete at least one of each of the four types of trials of the plural task (two grammatical number conditions and two numerical comparisons) and one of each of the two numerical comparisons of the number task.
As result of these criteria, 20 children were excluded: two because they did not complete enough trials in the number task, and the others because they did not complete enough trials in either of the tasks. For the remaining 32 children we obtained 314 trials out of the total of 384 (81.77%) trials in the plural task, and 167 (65.23%) out of the 256 trials in the number task.Footnote 2
Because the plural and number tasks had different durations, and to make our results comparable with previous studies (Arias-Trejo, Cantrell et al., Reference Arias-Trejo, Abreu-Mendoza and Aguado-Servín2014; Davies et al., Reference Davies, Xu Rattanasone and Demuth2017; Kouider et al., Reference Kouider, Halberda, Wood and Carey2006), we calculated the proportion of target looking (PTL), the total of target looking time divided by the sum of the total time looking at the target and the distractor [t/(t+d)], for the pre- and post-cue phases. For the number task, a preference to the largest quantity, which would suggest an ability to discriminate between the number of objects in the two images, consists of PTL scores significantly above chance level (0.5).
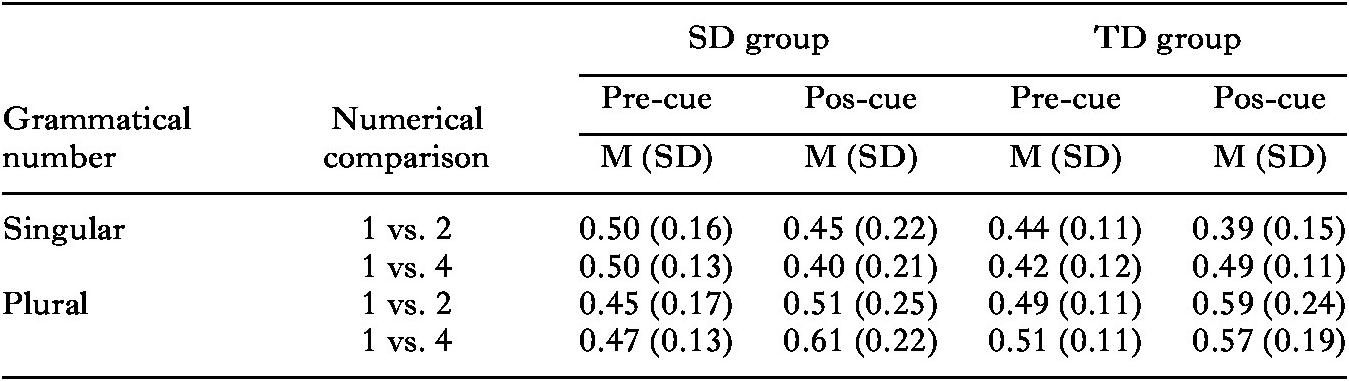
For the plural task, as previous studies have shown that children have a tendency to look at images at with more objects (Carey, Reference Carey, Campbell and Smith1978; Jolly & Plunkett, Reference Jolly and Plunkett2008), and as we were interested in the change in children’s visual preferences after listening to the morphosyntactic cues, we subtracted the pre-cue phase PTL (baseline) from the post-cue phase PTL; thus, positive PTL difference score values, significant from chance (0), demonstrate comprehension of these cues. Looking only at the post-cue phase PTL scores might be misleading, as children might look at the image with more objects regardless of whether they comprehended the linguistic cues; however, for the interested reader, raw PTL can be found in ‘Appendix A’.
Preferential looking tasks
Before performing the statistical analyses, we used the Mahalanobis distance to ensure that there were no multivariate outliers, and Levene’s test (Levene’s p > .01) to confirm homogeneity. As effect sizes, we used Cohen's d for t-tests and generalized eta squared for ANOVAs.
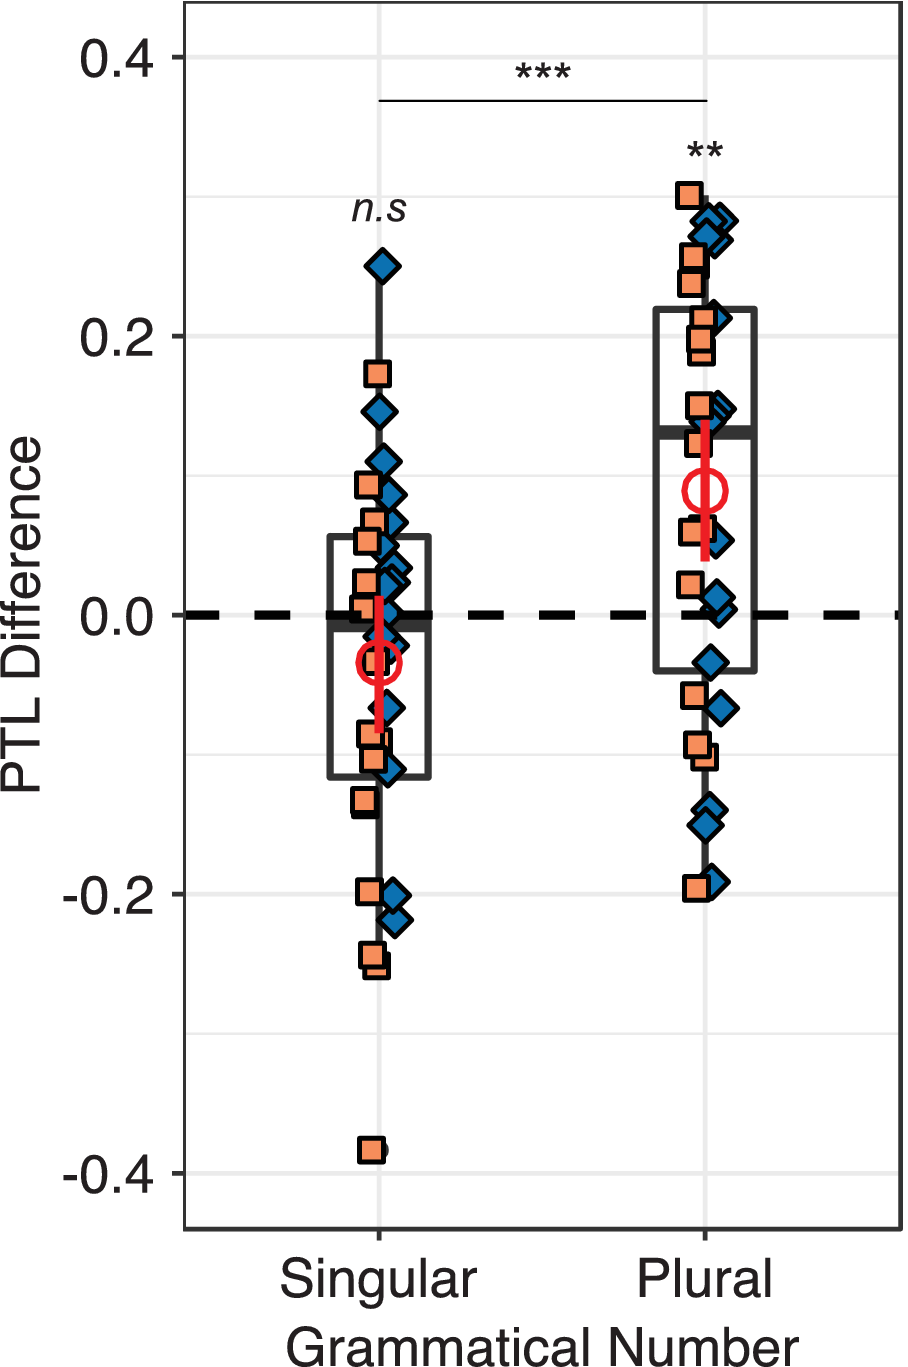
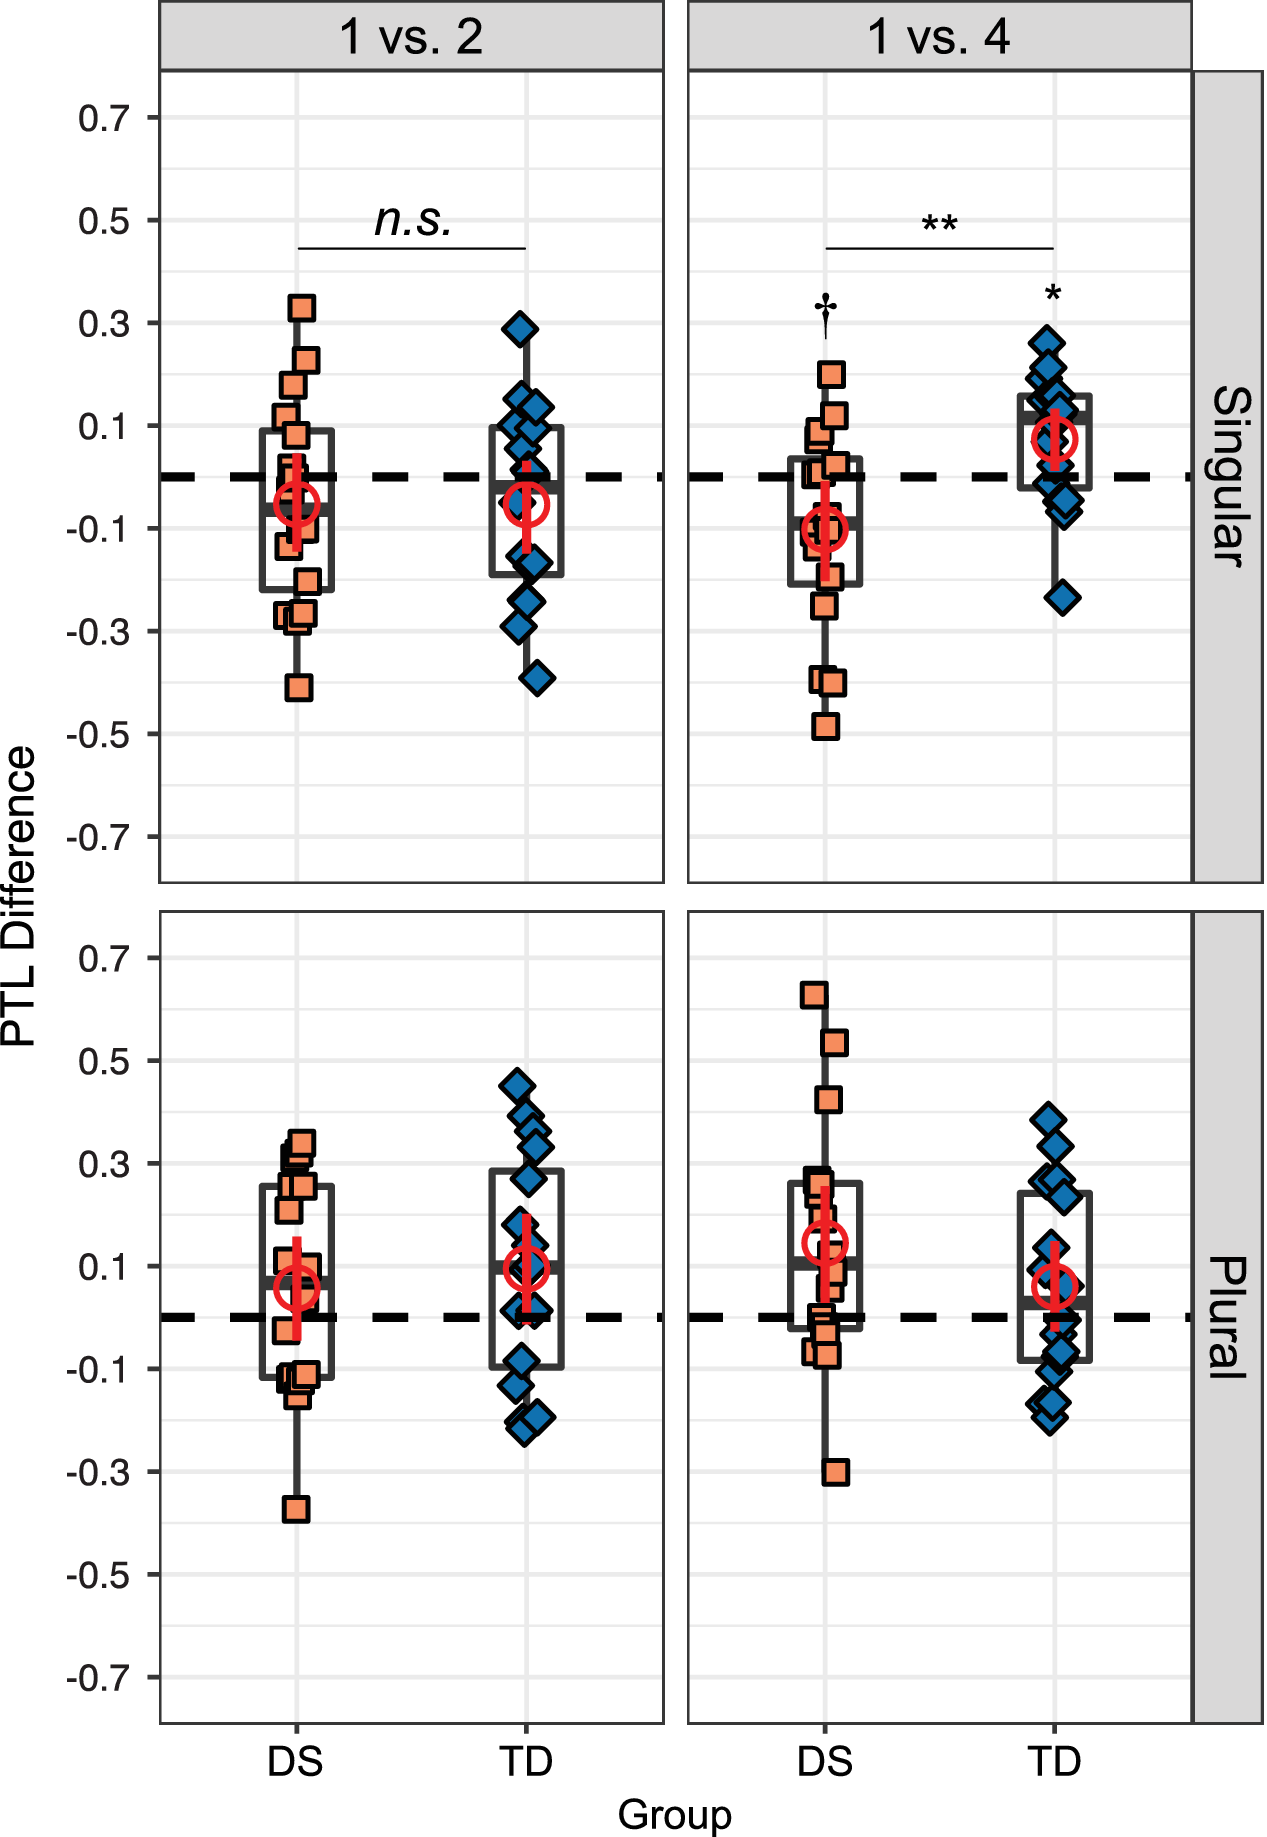
Plural task. To examine children’s comprehension of plural cues, we performed a (2) Group × (2) Grammatical Number × (2) Numerical Comparison mixed-design repeated measures ANOVA with Group (DS and TD) as between-subjects factor and Grammatical Number (singular and plural) and Numerical Comparison (one vs. two and one vs. four objects) as within-subjects factors with PTL difference as the dependent variable. The analysis yielded a main effect of Grammatical Number (F(1,30) = 14.73, p < .001, η2g = .09). This main effect showed that, when children from both groups heard a sentence with plural markers, they significantly increased their PTL to the image with the larger quantity (M = 0.09, SD = 0.21, t(31) = 3.24, p = .003, Cohen’s d = 0.57); however, when they heard a sentence with singular markers, they failed to increase their PTL to single object: (M = –0.03, SD = 0.14, t(31) = 1.38, p = .18, Cohen’s d = 0.24) (see Figure 2). The main effects of Group (F(1,30) = 0.62, p = .44,
 = .007) and Numerical Comparison (F(1,30) = 1.02, p = .32,
 = .007), and the interactions of Numerical Comparison by Grammatical Number (F(1,30) = 0.03, p = .869,
 = .001) and that of between Group and Numerical Comparison (F(1,30) = 0.17, p = .681,
 < .001) were not significant. However, the Group by Grammatical Number (F(1,30) = 2.99, p = . 094,
 = .019) and three-way interaction between Group, Numerical Comparison, and Grammatical Number (F(1,30) = 4.07, p = .053,
 = .035) approached significance. This three-way interaction was driven by a significant difference between the two groups in the Singular condition, specifically in the 1 vs. 4 numerical comparison. This result suggests that typically developing children after hearing singular cues increase their preference to the image with a single object, while children with DS do not. As the interaction was only marginal, this result will not be discussed. See ‘Appendix B’ for detailed statistics.
Results of the plural task. Children from both groups increased their PTL to the image with the larger quantity after listening to a sentence with plural markers; however, they failed to increase their PTL to the single object when they heard a sentence with singular markers. Orange squares represent datapoints of children with DS, while blue diamonds represent those of typically developing children, collapsed by numerical comparison, for each Grammatical Number condition. Red circles represent the mean (± 95 CI%) PTL difference scores with data of the two groups collapsed. Dotted lines represent chance level (0). **p < .01. See online for the color version of this figure.

To further evaluate the reliability of these marginal results, we computed their corresponding Bayes Factors (BFs), using the R package BayesFactor (Rouder, Love, Marwick, & Morey, Reference Rouder, Love, Marwick and Morey2015). As this package computes BF using simulations (n = 200,000), error estimates are provided. BFs represent the proportion of evidence for one model (e.g., alternative hypothesis or model 1) over another (e.g., null hypothesis or model 2). Values larger than 1 provide evidence for alternative hypothesis/model 1, while values smaller than 1 for the null hypothesis/model 2. Guidelines to interpret BFs (Jeffreys, Reference Jeffreys1961) consider 1 to 3 ‘anecdotal’ evidence, > 3 to 10 ‘substantial’ evidence, > 10 to 30 ‘strong’ evidence, > 30 to 100 ‘very strong’ evidence, and > 100 ‘decisive’ evidence for alternative hypothesis/model 1. Likewise, a BF of < 1 to 0.333 provides ‘anecdotal’ evidence, < 0.333 to 0.100 ‘substantial’ evidence, < 0.100 to 0.033 ‘strong’ evidence, < 0.033 to 0.010 ‘very strong’ evidence, and < 0.010 ‘decisive’ evidence for null hypothesis/model 2.
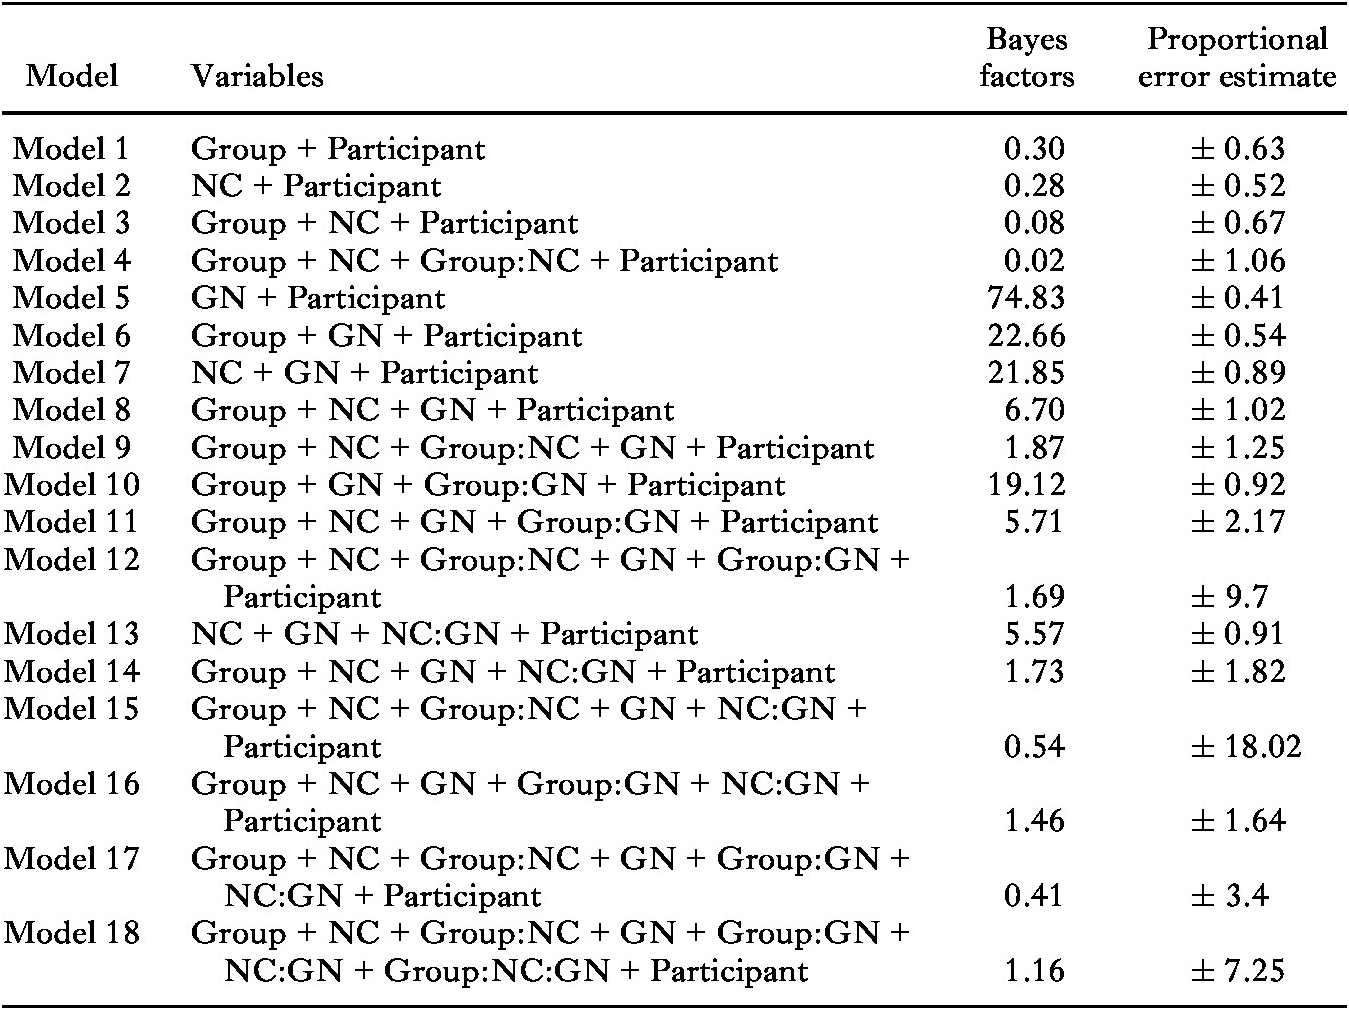
BFs provided further support to the results of the traditional ANOVA. The best model included an effect of Grammatical number (BF10 = 74.83, ± 0.41%), which can be considered as ‘very strong’ evidence. The model that included the main effects of Group and Grammatical Number along with the interaction between these two factors had a BF10 = 19.12 (± 0.92%), considered as ‘strong’ evidence, and the three main effects, the three possible two-way interaction, and the three-way interaction had a BF10 = 1.16 (± 7.25%), which is considered ‘anecdotal’. All tested models can be found in ‘Appendix C’. Finally, we compared the model containing only the main effect of Grammatical Number to the model that considered the interaction between Grammatical Number and Group. This analysis had a BF10 = 3.91 (± 1.01%), suggesting that the first model is the most parsimonious one between the two models. As both the Frequentist and the Bayesian analyses converged on the most reliable result being the main effect of Grammatical Number, the discussion is centered on this result.
Number task. To evaluate children’s numerical comparison skills, we performed a (2) Group × (2) Numerical Comparison mixed-design repeated measures ANOVA with Group (DS and TD) as the between-subjects factor and Numerical Comparison (one vs. two and one vs. four objects) as the within-subjects factor with PTL as the dependent variable. The analysis yielded a main effect of Number (F(1,30) = 7.96, p = .008,
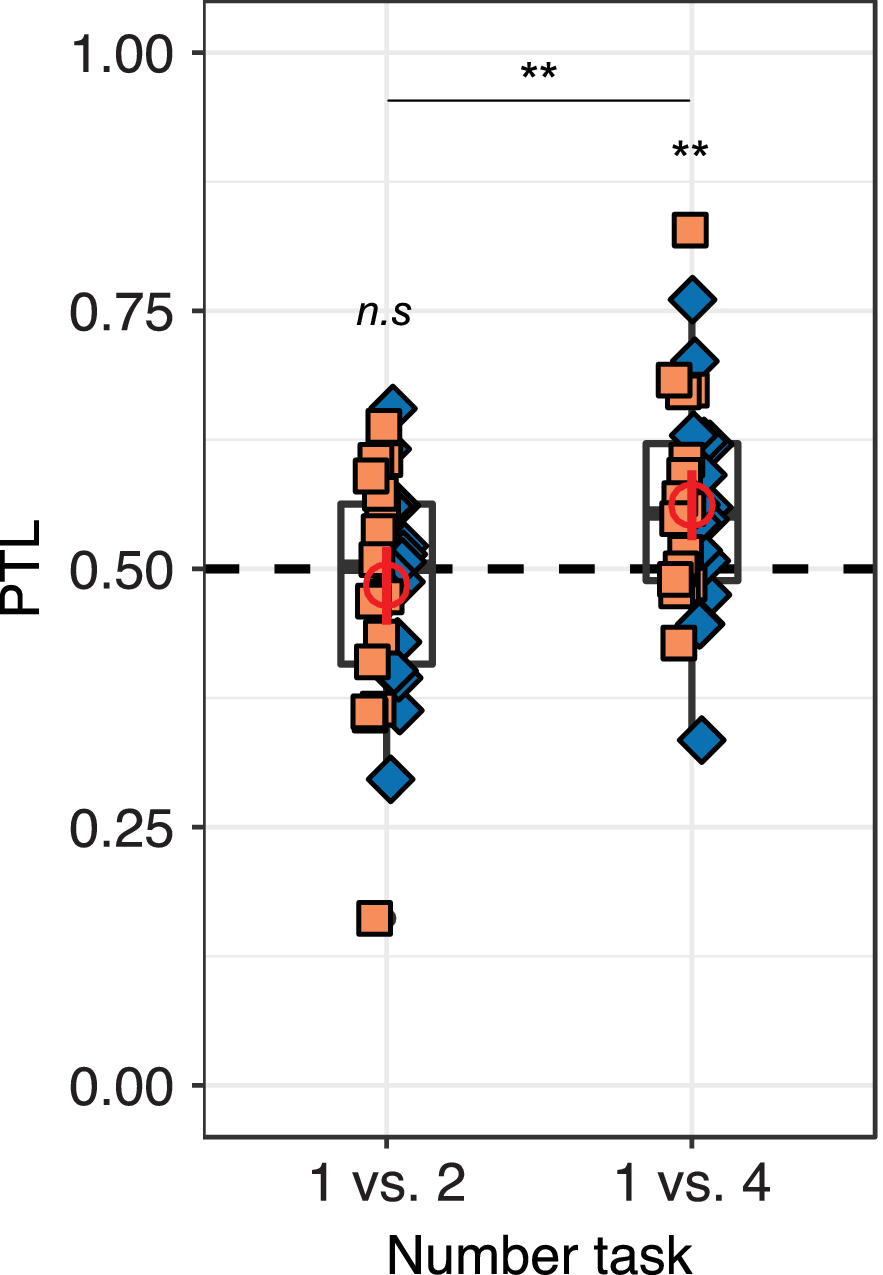
 = .121). This effect was driven by a significant preference for looking at the collection with more than one object in the one vs. four comparison (M = 0.56, SD = 0.10, t(31) = 3.42, p = .002, Cohen’s d = 0.60), but not in the one vs. two comparison (M = 0.48, SD = 0.11, t(31) = –0.81, p = .42, Cohen’s d = 0.14) (see Figure 3).Footnote
3 There was no main effect of Group (F(1,30) = 0.004, p = .951,
 < .001) nor interaction (F(1,30
 0.24, p = .628,
 = .004).
Results of the number task. Children from both groups showed a preference for looking at the collection with more than one object in the one vs. four comparison but not in the one vs. two comparison. Orange squares represent datapoints of children with DS, while blue diamonds represent those of typically developing children. Red circles represent the mean (± 95 CI%) PTL with data of the two groups collapsed. Dotted lines represent chance level (0.5). **p < .01. See online for the color version of this figure.

Finally, we calculated the bootstrapped, bias-corrected and accelerated (Bca) confidence intervals (CI) for the effect sizes (Cohen’s d) using the bootES package (Kirby & Gerlanc, Reference Kirby and Gerlanc2013) of the statistical programming language R, utilizing 200,000 permutations with replacement. This method avoids several assumptions in parametric methods about the shape of the data distribution by approximating the distribution from the data itself; it repeatedly draws samples, with replacement, from the original data sample.
The effect size against chance level (0) for the PTL difference scores in the plural condition (Cohen’s d = 0.57, 95% CI [0.19, 1.00]) was medium, while that for the singular condition was small and unreliable: the 95% bootstrap CI included zero (Cohen’s d = –0.24, 95% CI [–0.58, 0.12]). Finally, in the number task, the effect size was medium and reliable only for the preference for the collection of four objects (i.e., preference above chance level, 0.5); the CI did not include zero (Cohen’s d = 0.60, 95% CI [0.23, 0.93]).
Relationship between plural cue comprehension, receptive vocabulary, and numerical comparison abilities
To evaluate whether singular/plural comprehension was associated with children’s performance in the number task or their receptive vocabulary raw score, we performed Pearson correlations between the PTL difference scores and the mean PTL in the number task – with the two numerical comparisons collapsed – and the receptive vocabulary raw scores. Singular and plural comprehension scores were not related to performance in the number task (r singular (30) = 0.01, p = .97; r plural (30) = 0.04, p = .81) or to receptive vocabulary (r singular (30) = 0.26, p = .14; r plural (30) = 0.01 p = .97).
Eye-movements during numerical comparison: exploratory analysis
Eye-tracking data not only provides information about children’s looking preferences, but also has the potential of uncovering their underlying cognitive processes. Eye-tracking studies have shown that children with DS scan almost the entire collection of dots while comparing large quantities (Karmiloff-Smith et al., Reference Karmiloff-Smith, D’Souza, Dekker, Van Herwegen, Xu, Rodic and Ansari2012). Here, as exploratory analyses, we classified the looking patterns of children with DS to ask whether: (a) they are qualitatively different from those of typically developing children; and (b) whether children’s performance in the number task (i.e., PTL scores) can be characterized as a counting process or a comparison process. We term these exploratory analyses because they were not part of the original design of the study; they were motivated by recent interest in the eye-movements of children with DS during numerical comparison tasks (Van Herwegen, Ranzato, Karmiloff-Smith, & Simms, Reference Van Herwegen, Ranzato, Karmiloff-Smith and Simms2019).
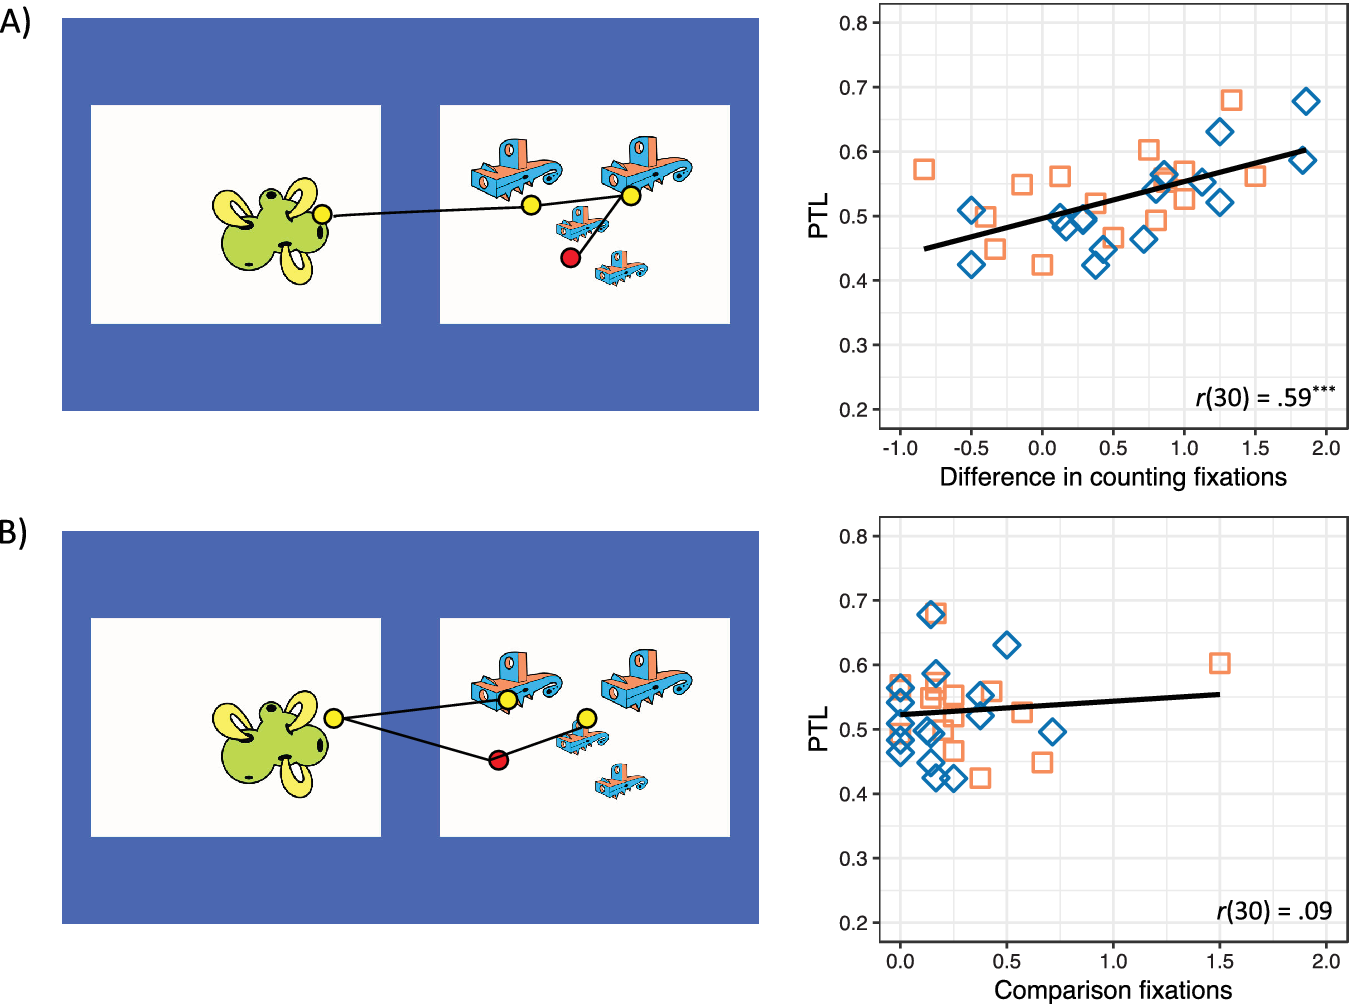
We classified children’s fixations as instances of counting or comparing. Using a classification similar to that of Plummer, DeWolf, Bassok, Gordon, and Holyoak (Reference Plummer, DeWolf, Bassok, Gordon and Holyoak2017), we classified the third consecutive fixation within an AOI as a counting fixation (see Figure 4a). Subsequent consecutive fixations within that same AOI were also classified as counting fixations. For example, if a child showed four consecutive fixations within the same image, the last two fixations would be classified as counting fixations.
Regardless of the group or numerical comparison, children who used a counting-like strategy, but not comparison-like one, during the number task were those who showed a preference for the larger quantity. Panel (A) (left) provides a visual representation of a counting fixation. Only fixations after the second consecutive fixation within an AOI (red circle) were considered counting fixations. Panel (B) (left) provides a visual representation of a comparison fixation. After the second consecutive crossing of the middle of the screen, subsequent fixations that also crossed the middle of the screen were considered comparison fixations (red circle). The right sides of panels (A) and (B) show, respectively, the scatter plots of the relationship between the PTL scores in the number task (collapsed by numerical comparison) and the counting fixation difference, and the number of comparison fixations. Orange squares and blue diamonds represent, respectively, datapoints for children with DS and typically developing children. ***p < .001. See online for the color version of this figure.

Comparison fixations were those that occurred in a sequence of three consecutive fixations where the middle of the screen was crossed twice (see Figure 4b). If the subsequent consecutive fixations also crossed the middle of the screen, they were also classified as comparison fixations. For instance, if in a sequence of four consecutive fixations the middle of the screen was crossed three times, the last two fixations would be classified as comparison fixations.
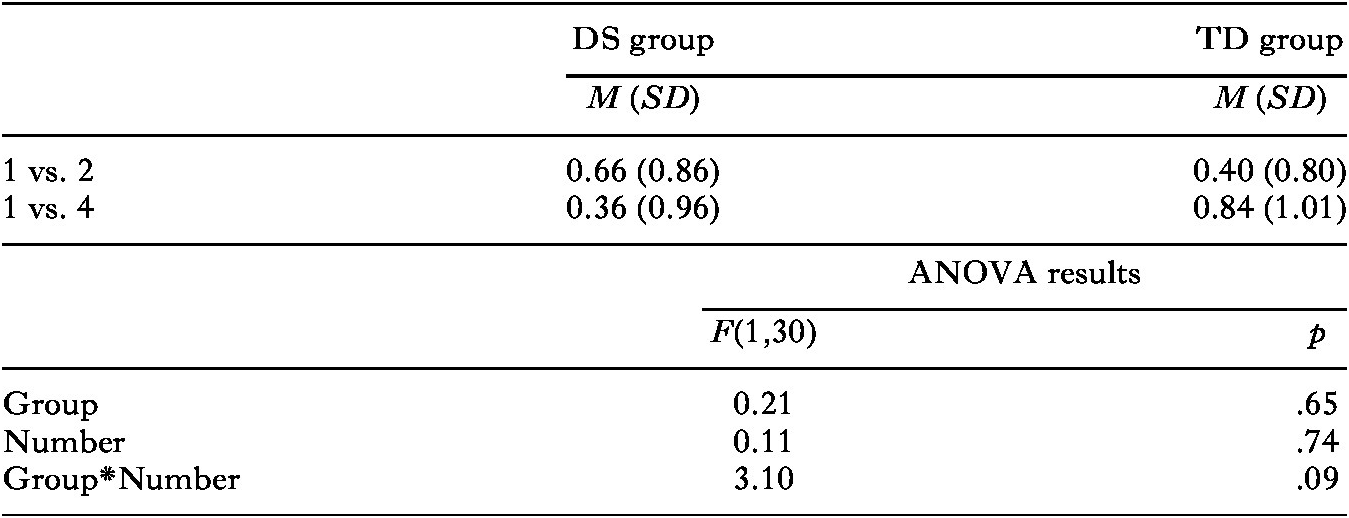
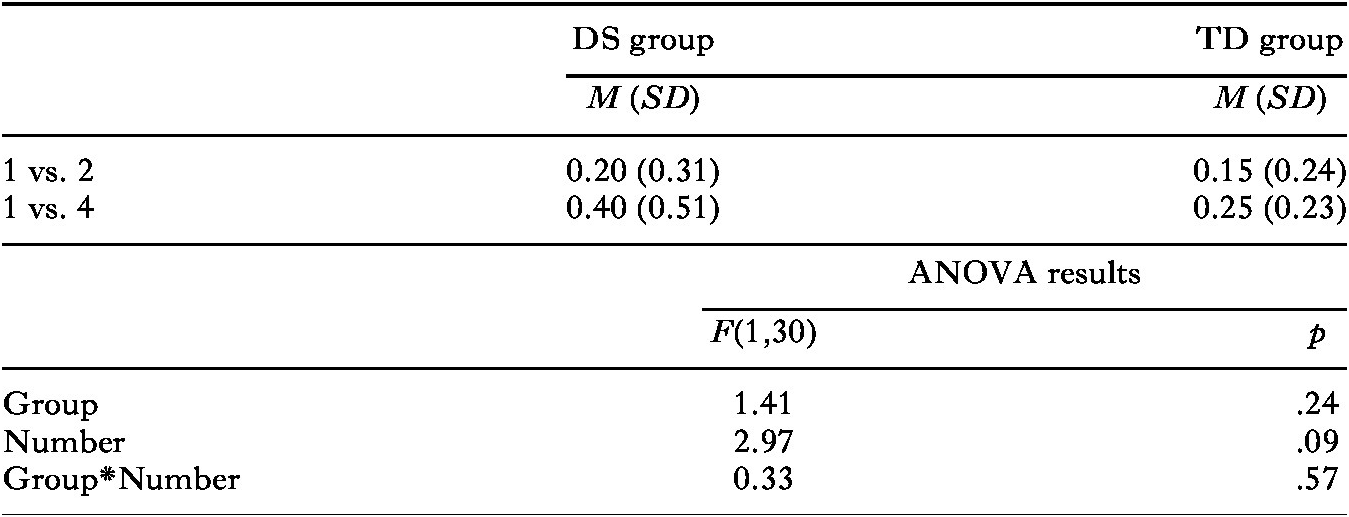
To test whether children with DS and their typically developing peers differed in their number of counting and comparison fixations, we performed two separate (2) Numerical Comparison × (2) Group ANOVAs with Numerical Comparison (one vs. two and one vs. four) as the within-subjects factor and Group (DS and Typical Development) as the between-subjects factor, one with the difference between counting fixations to the target and the distractor as the dependent variable, and the other with the total number of comparison fixations. Tables 2 and 3 show the means and standard deviations along with the detailed statistics for these analyses for the counting fixation difference and the number of comparison fixations, respectively. None of these analyses yielded a main effect of Group, Numerical Comparison, or significant interactions (all ps > .09). These results found further support according to Bayesian analyses. The BF10 for the marginal interaction between Group and Numerical Comparison for the counting fixations and the Numerical Comparison main effect for the comparison fixation were 0.12 ± 0.97% and 1.19 ± 0.41%, respectively, with the first one providing moderate evidence against the interaction while the other provides anecdotal evidence for the Numerical Comparison effect.
Finally, to test whether children’s PTL scores were characterized by a comparison or counting behavior, we performed Pearson’s correlations with children’s PTL, and the counting fixation difference and the comparison fixations collapsed by numerical comparison. The results showed that only the counting fixation difference was related to children’s PTL scores (r(30) = 0.59, p < .001), not the comparison fixations (r(30) = 0.09, p = .61). Crucially, these association strengths were significantly different (Z = 2.42, p = .015).
Mean (SD) counting fixation difference by Group and Numerical comparison and ANOVA results

Together, these results suggest that children with DS and typically developing children with a similar mental age have comparable eye-movement patterns while discriminating numerical quantities. They also suggest that, regardless of the group, children who used a counting-like strategy during the task were those who showed a preference for the larger quantity. These results suggest the need for further exploration of eye-movement patterns of children with DS.
Mean (SD) comparison fixations by Group and Numerical comparison and ANOVA results

4. Discussion
This study investigated whether children with DS have preserved comprehension of the predominant morphosyntactic plural marker in Spanish, and whether this comprehension is linked to their ability to distinguish a single object from a collection of two or four objects, and/or to their receptive vocabulary skills. Using two preferential looking tasks, we found that children with DS and typically developing children matched by receptive vocabulary mental age correctly mapped redundant plural markers to collections of two and four objects, but failed to map multiple singular markers to an object. However, upon hearing the question “Where are there more?”, children from both groups looked at a collection of four objects but not at one of two objects. These findings suggest that the comprehension of Spanish plural morphosyntactic markers by children with DS is comparable to that of typically developing children with the same receptive vocabulary mental age, and that these linguistic markers may help children at this age distinguish one object from a collection of more than one.
As a demonstration of their understanding of Spanish plural morphology, Spanish-speaking children with DS and typically developing children increased their looking time at a collection of more than one object after hearing a sentence with redundant plural markers. This result replicates previous findings with typically developing children acquiring Spanish (Arias-Trejo, Cantrell et al., Reference Arias-Trejo, Abreu-Mendoza and Aguado-Servín2014) and English (Davies et al., Reference Davies, Xu Rattanasone and Demuth2017; Kouider et al., Reference Kouider, Halberda, Wood and Carey2006). Consistently, our effect size for children’s understanding of plural markers (Cohen’s d = 0.57, 95% CI [0.19, 1.00]) was comparable to those reported in previous studies: Arias-Trejo, Cantrell et al. (Reference Arias-Trejo, Abreu-Mendoza and Aguado-Servín2014) (Cohen’s d = 0.90), Davies et al. (Reference Davies, Xu Rattanasone and Demuth2017) (Cohen’s d = 0.53), and Kouider et al. (Reference Kouider, Halberda, Wood and Carey2006) (Cohen’s d = 0.61).Footnote 4
Previous studies have shown that neither typically developing, Spanish-learning two-year-olds (Arias-Trejo, Cantrell et al., Reference Arias-Trejo, Abreu-Mendoza and Aguado-Servín2014) nor typically developing, English-learning children of the same age (Davies et al., Reference Davies, Xu Rattanasone and Demuth2017) show an understanding of singular markers. In fact, a recent study with older children (three- and four-year-olds) has suggested that singular acquisition may follow a more protracted developmental pattern than plural acquisition (Davies, Xu Rattanasone, Schembri, & Demuth, Reference Davies, Xu Rattanasone, Schembri and Demuth2019). The failure of children in this study to associate singular markers is consistent with these findings. Several explanations have been given. One is that children have a natural preference for images with multiple objects (Carey, Reference Carey, Campbell and Smith1978). Others have suggested that singular grammatical markers are not as informative as plural ones (Lukyanenko & Fisher, Reference Lukyanenko and Fisher2016): there is one object in a collection of multiple objects. One last possibility, specifically for the Spanish language, is that singular markers are not as redundant as plural markers. In Spanish, the masculine singular determiner (un) ends with a /-n/, while the feminine one (una) ends with an /-a/, but plural determiners, regardless of their gender information, always end with an /-s/. This lack of regularity between masculine and feminine markers may hinder the acquisition of Spanish singular markers. Consistent with this interpretation, when there are multiple consistent singular markers, as is the case of the English copula verb is with the quantifier a, children show an understanding of them (Kouider et al., Reference Kouider, Halberda, Wood and Carey2006).
Do children with DS have difficulty in discriminating one object from a collection of more than one? Together, the results of the plural and number tasks suggest that they do not. In the plural task, they understood the plural cues, which as a first step required making the perceptual singular/plural distinction. In the number task, they succeeded in making the critical comparison, that is, of one vs. four objects. But why did children in both groups fail to distinguish one object from two? There are at least two non-mutually exclusive explanations. One is the visual control we employed of total cumulative area. Previous infant studies have shown that when these two types of quantity information – area and number – are pitted against one another, children fail to show a preference based on numerical information (Feigenson, Carey, & Hauser, Reference Feigenson, Carey and Hauser2002; Feigenson, Carey, & Spelke, Reference Feigenson, Carey and Spelke2002). By controlling cumulative area, other non-numerical types of information increase with numerical information (Leibovich, Katzin, Harel, & Henik, Reference Leibovich, Katzin, Harel and Henik2017). In the case of this study, density information was more salient in the one vs. four than in the one vs. two comparison. The other explanation is related to the ambiguity of the quantifier más ‘more’. Although previous studies have successfully used this quantifier to refer to numerical quantities (Abreu-Mendoza & Arias-Trejo, Reference Abreu-Mendoza and Arias-Trejo2015), it can also refer to continuous quantity information (e.g., total cumulative area, individual size, or density), and there is evidence suggesting that children learn its meaning in a domain-neutral form (Odic, Pietroski, Hunter, Lidz, & Halberda, Reference Odic, Pietroski, Hunter, Lidz and Halberda2013). The one vs. two comparison not only had numerical and density information that was more difficult to distinguish than that in the one vs. four comparison, but the quantifier ‘more’ might also have been more ambiguous. Finally, using novel objects instead of the real-world objects that were used in a previous study (Abreu-Mendoza & Arias-Trejo, Reference Abreu-Mendoza and Arias-Trejo2015) could also have led children to focus on non-numerical quantities. Future studies could use familiar objects and a different visual control from the total cumulative area employed here to reduce the salience of individual object size.
Is plural morphosyntax necessary for the distinction between a single object and a collection of more than one? Prior research has suggested that, if there is any causal relationship between these two abilities, it would be the opposite: the distinction between a single object and a collection of more than one would support the acquisition of singular–plural linguistic markers (Li et al., Reference Li, Ogura, Barner, Yang and Carey2009; Walles, Robins, & Knott, Reference Walles, Robins and Knott2014). Our findings may appear to be at odds with this conclusion, as children from both groups were able to distinguish one from two and four in the plural task but were only able to distinguish one from four in the number task. However, unlike the quantifier ‘more’, plural cues make unambiguous reference to the number of whole objects and not non-numerical quantity. Consistently, English-speaking children’s pluralization is less frequent when the referent is a collection of pieces of an object, rather than of whole objects. According to one study, four-year-olds are less inclined to pluralize when they are shown pieces of objects (e.g., one shoe divided into three pieces) than when they are prompted to accept that a character with those pieces has more objects than another character with fewer pieces but more whole objects (e.g., two shoes) (Brooks, Pogue, & Barner, Reference Brooks, Pogue and Barner2011).
A main limitation of our study is the sample size. Although 16 children per group is a commonly reported sample size in preferential looking and eye-tracking tasks, both with typically developing children and special populations, and our analyses showed sufficient statistical power to detect medium effect sizes, generalizations from small samples should still be taken with caution. Furthermore, our sample size could also have contributed to the marginal two- and three-way interactions, which would have suggested a difference between children with Down syndrome and their typically developing peers in their understanding of grammatical numerical cues, specifically in their understanding of singular cues. To look for further evidence, we complemented frequentist analyses (traditional ANOVA) with a Bayesian approach which, in contrast to hypothesis testing approaches, relies on model comparison. The Bayesian approach supported our frequentist analyses: the model that suggested a difference between plural and singular comprehension, but a lack of group differences, was at least 3.9 times more likely than any of the two marginal interactions. Difficulties in reaching and recruiting children and exclusion criteria hinder sample sizes; however, new technologies such as online platforms to study cognitive development (Scott, Chu, & Schulz, Reference Scott, Chu and Schulz2017) are emerging that may ameliorate this difficulty. Another limitation is that, although children with DS understood multiple plural cues, the mean verbal mental age of children of this group (3;6) was a year older than the age at which typically developing children start to understand these cues. Future studies could investigate whether children with DS understand them at a younger age.
This study contributes to recent efforts to understand the difficulty that children with DS have in learning basic numerical abilities, such as counting, and the relationship of this difficulty with their linguistic abilities (Abreu-Mendoza & Arias-Trejo, Reference Abreu-Mendoza and Arias-Trejo2017; Dolscheid & Penke, Reference Dolscheid and Penke2018). According to some authors (Le Corre & Carey, Reference Le Corre and Carey2007), singular/plural markers provide one of the first meanings of number words by providing an earlier meaning for the number one, at least in English. There is evidence that children who speak Japanese and Chinese, languages with no singular/plural morphemes, learn the meaning of the number word one months later than children who speak English (Le Corre, Li, Huang, Jia, & Carey, Reference Le Corre, Li, Huang, Jia and Carey2016; Sarnecka, Kamenskaya, Yamana, Ogura, & Yudovina, Reference Sarnecka, Kamenskaya, Yamana, Ogura and Yudovina2007). Our results suggest that, as their understanding of plural morphology is preserved, children with DS may use the singular/plural distinction to build their meaning of one.
In conclusion, children with DS, with a receptive vocabulary mental age equivalent to that of typically developing children aged 3;6, successfully map redundant, multiple Spanish morphosyntactic markers to collections of more than one object.
Appendix A
Mean Proportion of Target Looking (PTL) by Group, Cue-phase (pre- and post-cue phase), Grammatical Number, and Numerical Comparison

Note. Chance level for PTL is 0.5
Appendix B
Additional analyses
To further explore the marginal three-way interaction between Grammatical Number, Numerical Comparison, and Group, we performed separate follow-up (2) Numerical Comparison × (2) Group ANOVAs for each Grammatical Number (singular and plural) with Numerical Comparison (1 vs. 2 and 1 vs. 4) as within-subjects factor and Group (Typical Development (TD) and Down Syndrome (SD) groups) as between-subjects factor. The ANOVA for the Singular condition showed a non-significant effect of Numerical Comparison (F(1,30) = 0.76, p = .39,
 = .01), and a marginal main effect of Group (F(1,30) = 3.40, p = .075,
 = .57), which was qualified by a marginal interaction between the two factors (F(1,30) = 3.92, p < .057,
 = .58). Follow-up t-tests showed that the interaction was driven by a significant difference between the TD group and the group of children with DS in the 1 vs.4 comparison (t(30) = 2.95, p = .006, Cohen’s d = 1.06). Follow-up t-test against chance level (0) indicated that typically developing children increased their proportion to target looking to the image with one object after hearing a singular sentence (t(15) = 2.27, p = .04, Cohen’s d = 0.57), while children with DS marginally increased their preference to image with multiple objects (t(15) = 2.05, p = .06, Cohen’s d = 0.5). There was no significant differences between groups in the 1 vs. 2 comparison, and their PTL, using both groups collapsed, did not differed against chance level (0) (t(30) = 1.55, p = .13, Cohen’s d = 0.27).
The ANOVA for the Plural trials did not showed significant main effects (Group, F(1,30) = 0.17, p = .67,
 = .003; Numerical Comparison, F(1,30) = 0.25, p = .62,
 = .004), or interaction (Group by Numerical Comparison, F(1,30) = 1.31, p = .26,
 = .021). As shown in the main text, when collapsing the data of the two numerical comparisons and the two groups, the PTL is significant above chance level (0).
Results of the marginal three-way interaction between Group, Numerical Comparison and Grammatical Number in the Plural task. Orange squares represent datapoints of children with DS, while blue diamonds represent those of typically developing children. Red circles represent the mean (± 95 CI%) PTL. Dotted lines represent chance level (0.5).

Appendix C
Bayes factors for the all the models tested

Note. GN = Grammatical Number, NC = Numerical Comparison. The colon symbol (:) indicates interactions.