1. Introduction
Authigenic carbonate rocks forming where methane or oil effuse from the sediments into the bottom waters act as an archive of life in chemosynthesis-based ecosystems at marine seeps (Peckmann & Thiel, Reference Peckmann and Thiel2004; Campbell, Reference Campbell2006). The key biogeochemical process at seeps is the anaerobic oxidation of methane (Boetius et al. Reference Boetius, Ravenschlag, Schubert, Rickert, Widdel, Gieseke, Amann, Jørgensen, Witte and Pfannkuche2000). It results in carbonate precipitation forming seep limestones even way below the carbonate compensation depth (e.g. Ritger, Carson & Suess, Reference Ritger, Carson and Suess1997; Greinert, Bohrmann & Elvert, Reference Greinert, Bohrmann and Elvert2002) and the production of hydrogen sulphide that sustains benthic sulphide-oxidizing bacteria and thiotrophic bacteria in the tissues of chemosymbiotic metazoans (Sibuet & Olu, Reference Sibuet and Olu1998). A growing number of Phanerozoic seep deposits has been described to date (Campbell, Reference Campbell2006; Teichert & van de Schootbrugge, Reference Teichert and van de Schootbrugge2013 and references therein). Their fossil inventory revealed a successive colonization of seep environments by different groups of metazoans in the course of Earth history, commonly followed by the sooner or later disappearance of these groups of highly specialized taxa.
Methane-seep faunas were first discovered in the early 1980s in the Gulf of Mexico and are nowrecognized at most continental margins (Paull et al. Reference Paull, Hecker, Commeau, Freeman-Lynde, Neumann, Golubic, Hook, Sikes and Curray1984; Baker et al. Reference Baker, Ramirez-Llodra, Tyler, German, Boetius, Cordes, Dubilier, Fisher, Levin, Metaxas, Rowden, Santos, Shank, Van Dover, Young, Warén and McIntyre2010). Their highly specialized taxa are closely related to those at deep-sea hydrothermal vents and many rely on chemotrophic symbionts for nutrition (Paull et al. Reference Paull, Jull, Toolin and Linick1985). Although the rise of the modern, mollusc-dominated vent and seep fauna began during the Cretaceous Period, the main players at present-day vents and seeps appeared in early Cenozoic time (Campbell & Bottjer, Reference Campbell and Bottjer1995; Kiel & Little, Reference Kiel and Little2006; Kiel, Reference Kiel and Kiel2010; Vrijenhoek, Reference Vrijenhoek2013). Biogeographically, however, the Cenozoic fossil record of methane seeps is highly skewed towards the active continental margins of the Pacific Ocean where uplift of deep-water sediments is frequent (Goedert & Squires, Reference Goedert and Squires1990; Majima, Nobuhara & Kitazaki, Reference Majima, Nobuhara and Kitazaki2005; Campbell et al. Reference Campbell, Francis, Collins, Gregory, Nelson, Greinert and Aharon2008). In contrast, fossil occurrences in the Atlantic realm are restricted to the Caribbean region (Gill et al. Reference Gill, Harding, Little and Todd2005; Kiel & Peckmann, Reference Kiel and Peckmann2007) and the Mediterranean basin (Taviani, Reference Taviani1994).
Here we evaluate the fauna of middle Eocene seep deposits from the northern Mediterranean basin (Istria, Croatia; Venturini et al. Reference Venturini, Selmo, Tarlao and Tunis1998) in the light of the early evolution of the modern vent and seep fauna, establish the biogeochemical processes that led to the formation of the seep deposits, describe processes that imprinted their lithology and reconstruct the composition of fluids and the mode of seepage.
2. Geological setting and material
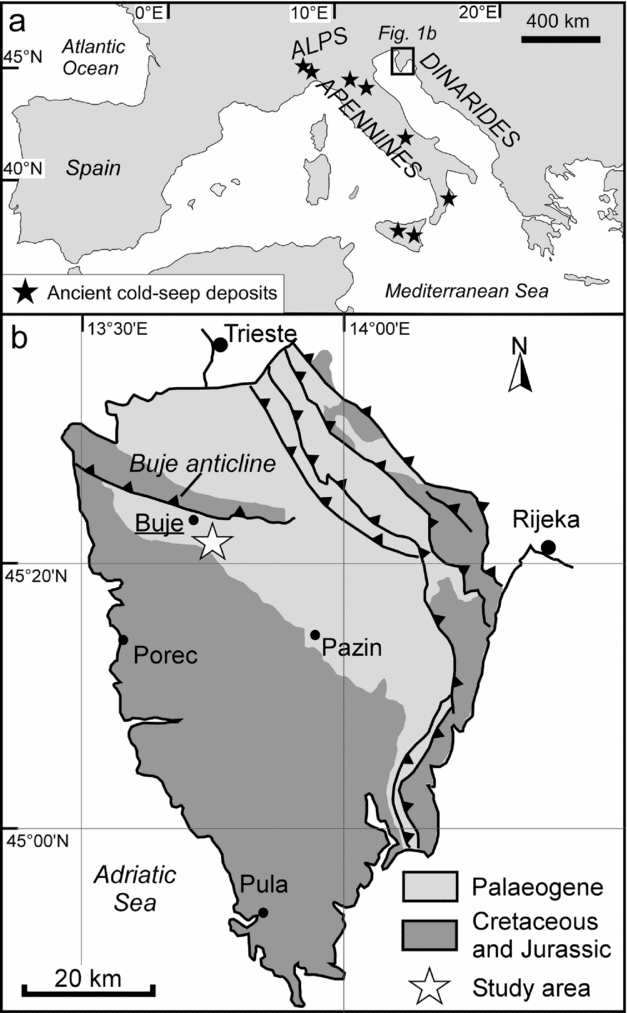
The Istria peninsula, shared by Croatia, Slovenia and Italy, borders the northeastern Adriatic Sea. During Eocene time, Istria was a part of the Dinaric foreland zone that experienced a strong subsidence in response to the formation of an orogenic wedge (e.g. Živkovic & Babić, Reference Živkovic and Babić2003). The study area (Fig. 1a, b), located in the Croatian part of northwestern Istria, is characterized by a regional WNW–ESE-oriented anticlinal structure, commonly referred to as the Buje anticline or Buje Karst, whose origin is related to the formation of the Dinarides (Matičec, Reference Matičec1994). At the southern margin of the Buje anticline the foreland sequence is composed of more than 150 m of Lutetian lacustrine to shallow-marine foraminiferal limestones (Drobne & Pavlovec, Reference Drobne and Pavlovec1991) and of at least 350 m of Lutetian to Priabonian turbidite deposits (referred to as Flysch Units;Marinčić et al. Reference Marinčić, Šparica, Tunis and Uchman1996; Pavšič & Peckmann, Reference Pavšič and Peckmann1996; Živkovic & Babić, Reference Živkovic and Babić2003) that transgressively overlie an Aptian to Cenomanian sequence of shallow-marine carbonates (Venturini et al. Reference Venturini, Selmo, Tarlao and Tunis1998). The Flysch deposits, in which the studied limestones are enclosed, consist of interbedded siliciclastic sandstones and marlstones as well as rare carbonate megabeds with basal breccias, representing calciturbidites (Venturini et al. Reference Venturini, Selmo, Tarlao and Tunis1998). The occurrence of turbidites indicates deposition by gravity flows in a deep-sea environment. The majority of the fine-grained marlstones, on the other hand, represent hemipelagic background sedimentation in a basinal setting (Pavšič & Peckmann, Reference Pavšič and Peckmann1996). The occurrence of ichnogenera including Paleodictyon, as well as foraminifers and ostracods suggests deposition in between 700 and 1200 m of water depth (Gohrbandt et al. Reference Gohrbandt, Kollmann, Küpper, Papp, Prey, Wieseneder and Woletz1960; Pavšič & Peckmann, Reference Pavšič and Peckmann1996).
Working area. (a) Distribution of the main domains of Cenozoic seep deposits in the Mediterranean area. (b) Geological sketch of the Istria region and location of the Buje seep deposits (45° 24′ 31″ N, 13° 40′ 01″ E).
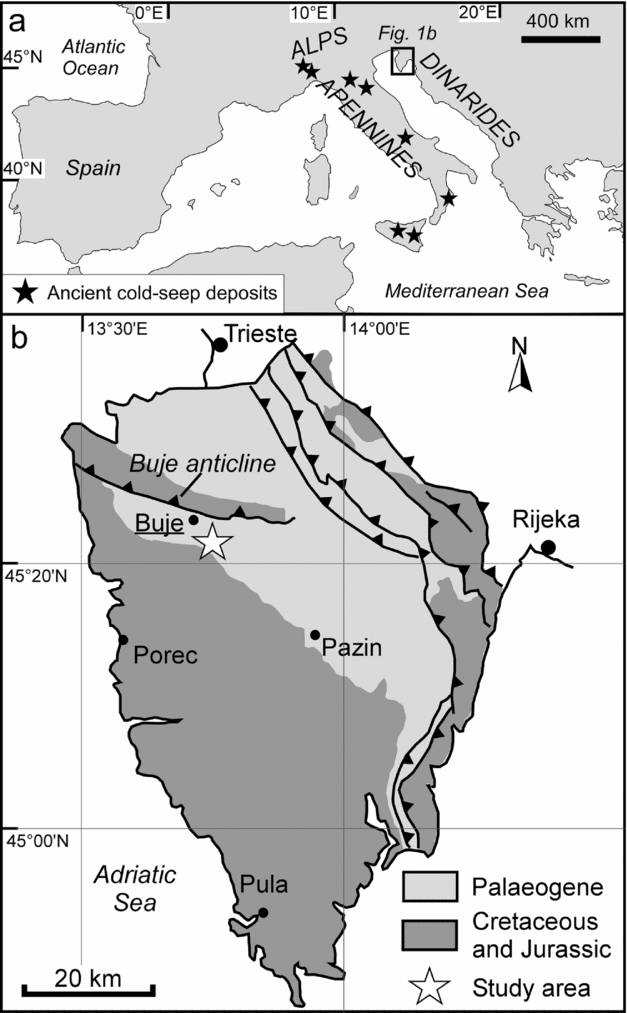
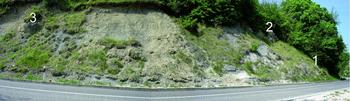
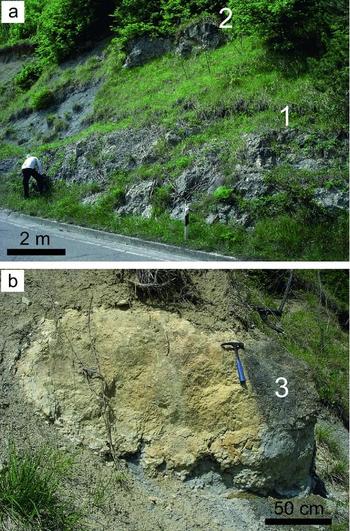
The exotic blocks of limestone occurring in the vicinity of the town of Buje (Fig. 1b; 45° 24′ 31″ N, 13° 40′ 01″ E) were first described by Venturini et al. (Reference Venturini, Selmo, Tarlao and Tunis1998). The deposits studied here correspond to the ‘nearby Buje petrol station’ section of Venturini et al. (1998, their figs 4, 5). In the captions of their figures 10, 11, 13 and 14 as well as table 1, Venturini et al. (Reference Venturini, Selmo, Tarlao and Tunis1998) referred to this locality as ‘Buje’. The other two outcrops described by Venturini et al. (1998) were no longer accessible during field work in 2011. In the ‘nearby Buje petrol station’ outcrop three limestone bodies are exposed in a road section on the eastern outskirts of Buje (Figs 2, 3). These deposits are enclosed in a sequence of fine-grained marls intercalated with few thin turbidites. The lowermost deposit (Buje 1) is about 4 m thick and laterally extends for approximately 20 m in outcrop; the Buje 2 and 3 deposits are approximately 5 m and 2 m in width and 2 m and 1 m in height, respectively.
Composite image of studied Buje 1 to 3 seep deposits assembled from three photographs.

Outcrop photographs of the studied seep carbonates. (a) Buje 1 and 2 seep deposits. Note that the Buje 1 seep deposit is faintly stratified. (b) The lenticular Buje 3 seep deposit.

3. Methods
Sampling of the carbonate deposits (Buje 1, 2, and 3) was carried out in spring 2011. Selected samples were prepared for palaeontological, petrographical and geochemical investigations. All fossil specimens are deposited in the Geowissenschaftliches Museum, Georg-August-University Göttingen, Germany (GZG). Thin-sections (15 × 10 cm and 10 × 7.5 cm) were studied with transmitted light and cathodoluminescence microscopy using a CITL 8200MK3, operating at about 17 kV and 400 mA. Thin-sections were further analysed for their UV-fluorescence on a Nikon microscope with a UV-2A filter block, using ultraviolet light (illumination source 450–490 nm). Scanning electron microscopy (SEM) and qualitative element recognition were performed with a Cambridge Instruments Stereoscan 360 scanning electron microscope equipped with a Link System Oxford Instruments energy-dispersive microprobe (EDS).
For stable isotope analyses, mineral phases were drilled from the surface of slabs with a hand-held micro drill. Measurements of carbon and oxygen isotopes were performed with a Finnigan MAT 251 mass spectrometer using the carbonate device types ‘Kiel’ and ‘Bremen’ against natural carbon dioxide from Burgbohl (Rheinland, Germany). A Solnhofen limestone was used as a standard, which was calibrated against the international standard NBS 19. Values are reported in the δ-notation relative to Vienna Pee Dee Belemnite (VPDB) standard. Long time standard deviation (1σ) for this measurement was 0.05 ‰ for δ13C and 0.07 ‰ for δ18O values.
Lipid biomarkers were extracted from two carbonate blocks (Buje 1 and 2 deposits), yielding almost identical patterns. Samples were prepared and decalcified as described in Birgel et al. (Reference Birgel, Thiel, Hinrichs, Elvert, Campbell, Reitner, Farmer and Peckmann2006b ). After saponification with 6 % KOH in methanol, the samples were extracted with a microwave extraction system (CEM Discovery) at 80 °C and up to 250 W with dichloromethane/methanol (3:1) three times. The resulting extracts were separated into four fractions by column chromatography (500 mg DSC-NH2 cartridges, Supelco) as described in Birgel et al. (Reference Birgel, Elvert, Han and Peckmann2008). Carboxylic acids were measured as their methyl ester (ME) derivatives. All fractions were measured using an Agilent 7890 A gas chromatography (GC) system coupled to an Agilent 5975 C inert MSD spectrometer. The GC-MS system was equipped with a 30 m HP-5 MS UI fused silica capillary column (0.25 mm i.d., 0.25 μm film thickness). The carrier gas was He. The GC temperature programme used for both fractions was as follows: 60 °C (1 min); from 60 to 150 °C at 10 °C min−1 then to 320 °C at 4°C min−1; 25 min isothermal. Identification of compounds was based on GC retention times and comparison with published mass spectra. No separation of crocetane and phytane was achieved with the used column. The relative abundance of these compounds was assessed by the different fragmentation patterns, especially by the change in relative abundances of the masses 169 (characteristic for crocetane) and 183 (characteristic for phytane) within the mixed crocetane/phytane peak. Compound-specific carbon isotope analyses were carried out with a Thermo Fisher Trace GC Ultra connected via a Thermo Fisher GC Isolink interface to a Thermo Fisher Delta V Advantage spectrometer. GC conditions were identical to those described above. Carbon isotopes are expressed as δ13C values relative to the VPDB standard. The carbon isotope measurements were corrected for the addition of ME-derivatives. Several pulses of carbon dioxide with known δ13C values at the beginning and the end of the runs were used for calibration. Instrument precision was checked using a mixture of n-alkanes (C14 to C40) with known isotopic composition. The analytical standard deviation was < 0.7 ‰.
4. Results
4.a. Fauna
Microfossils are abundant in the studied carbonate rocks, for the most part being represented by benthic (Bolivina sp., Stilostomella spp., Uvigerina spp. and Heterolepa spp.) and planktonic (Turborotalia sp., Acarinina sp. and Hantkenina sp.) foraminifera. The occurrence of Hantkenina sp. agrees with an upper Lutetian–Bartonian age (cf. Pavšič & Peckmann, Reference Pavšič and Peckmann1996).
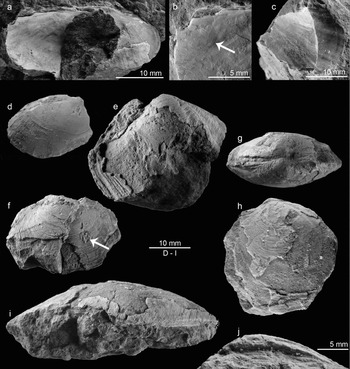
Macrofossils were found only sporadically in the Buje 1 deposit and were almost absent in the Buje 2 and Buje 3 deposits. Most common is a lucinid bivalve, which is also the largest shell, followed by a thyasirid and a solemyid bivalve. In addition to these bivalves, a few callianassid claws and other crustacean fragments were found. The bivalves include: (1) two specimens of a solemyid, the larger one 32 mm long and 10 mm high with the anterior end missing; it shows an elongate S-shaped band extending from the posteroventral corner of the anterior adductor muscle scar to the dorsal shell margin and had an external ligament, and is therefore referred to Acharax (Fig. 4a–c). (2) Two specimens of a Nucula; the larger one is 20 mm long and 15 mm high, and although the taxodont hinge is missing in these specimens, they have the general shape of a Nucula and show the radial striation and crenulate ventral margin common to this genus (Fig. 4d). (3) Four specimens belonging to Thyasira owing to their general shape and strong posterior sulcus (Fig. 4e); the largest is 40 mm long. The ‘undetermined Veneroida (?Kelliidae)’ figured by Venturini et al. (Reference Venturini, Selmo, Tarlao and Tunis1998, p. 225, fig. 11) may also belong to this Thyasira species. (4) Seven specimens and fragments of an oval lucinid bivalve with an edentulous, narrow hinge without triangular excavation below the umbo, and a maximum length of 52 mm (Fig. 4f–j) belonging to the genus Amanocina. The lucinid is most likely the same species as the ‘?Lucina’ figured by Venturini et al. (1998, p. 225, fig. 10).
Bivalves from the Buje 1 seep deposit. (a–c) The solemyid Acharax: (a) large specimen (GZG.INV.82757), (b) detail showing the S-shaped band on the anterodorsal shell margin (arrow), and (c) small fragment showing radial ribs on the anterior part of the shell (GZG.INV.82758). (d) The protobranch Nucula (GZG.INV.82759). (e) Large specimen of Thyasira showing the posterior sulcus (GZG.INV.82760). (f–j) The lucinid Amanocina: (f) specimen with naticid drill hole (arrow; GZG.INV.82761); (g, h) specimen showing the narrow escutcheon (GZG.INV.82762); (i, j) large specimen (GZG.INV.82763) in dorsal view (i) and view of the edentulous hinge (j).

4.b. Petrography and stable isotopes
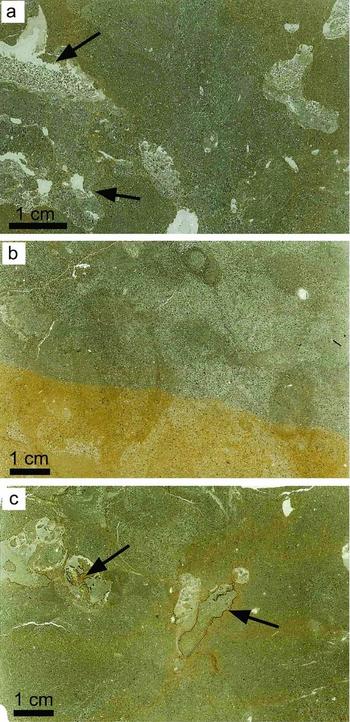
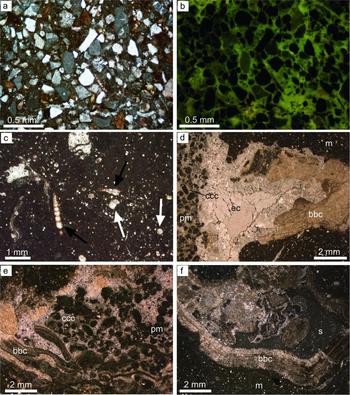
The lithology of the three Buje carbonate deposits (Buje 1 to 3) is quite similar. The limestones consist of fossiliferous and bioturbated mudstone and wackestone (Fig. 5). The matrix is made up of dark brown micrite, revealing a bright autofluorescence (Fig. 6a, b). Terrigenous particles are angular, including abundant quartz and rare feldspar grains as well as lithic clasts. Apart from detrital grains, the micritic matrix contains abundant biogenic detritus, mostly tests of foraminifera (Fig. 6c). Some millimetre- to centimetre-wide, irregular cavities occur; the cavities are interpreted to result from bioturbation, representing successively filled burrows. Some cavities show geopetal infill (Fig. 6d). The cavities are filled by sediment and authigenic phases including peloids, homogenous micrite, laminated micrite, a phase referred to as cauliflower micrite and different generations of carbonate cements (Fig. 6d–f). Peloidal fabrics are particularly abundant (Fig. 6e). They consist of ovoidal peloids, showing an intense fluorescence, surrounded by a non-fluorescent calcite microspar. On the basis of shape and composition, peloids are interpreted to represent faecal pellets. Banding in the authigenic, laminated micrites is sub-parallel to cavity walls (Fig. 6e). In places the laminated micrite is broken into pieces, forming fragments surrounded by calcite cement.
Scanned thin-sections of the three Buje seep deposits: (a) Buje 1, (b) Buje 2, (c) Buje 3. The limestones represent bioturbated mudstone and wackestone; arrows indicate geopetal cavities (a) and black corrosion rims (c).

Petrography of Buje seep deposits. (a) Angular clasts cemented by matrix micrite, plane-polarized light. (b) Same detail as (a) showing the brightly fluorescent micrite; fluorescence image. (c) Fossiliferous wackestone containing planktonic (white arrows) and benthic (black arrows) foraminifera; plane-polarized light. (d–f) Irregular cavities filled with peloidal micrite, sediment and different generations of carbonate cements; plane-polarized light. Abbreviations: m – matrix micrite; pm – peloidal micrite; ccc – circumgranular calcite cement; bbc – banded and botryoidal cement; s – sediment; ec – equant calcite cement.

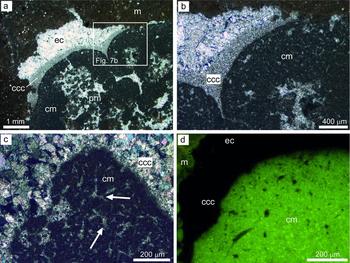
The cauliflower micrite is an obviously authigenic variety of micrite found in some of the cavities. It is represented by aggregates of mottled, microcrystalline calcite (Fig. 7a, b). Its aggregates exhibit a domal, grooved shape, resembling cauliflower. Micron-sized irregular pores, filled by calcite microspar, are present within these domes, generating a sponge-like texture (Fig. 7c). The fluorescent cauliflower micrite (Fig. 7d) is commonly covered by a circumgranular calcite cement (Fig. 7b, c). The remaining porosity in the cavities was subsequently filled by two main generations of cement: (1) banded and botryoidal aggregates of fibrous aragonite cement, mostly recrystallized to calcite, and (2) a drusy mosaic of equant calcite cement. Carbonate cements are overall not abundant in the seep deposits, being restricted to the cavities believed to result from bioturbation.
Petrography of cauliflower micrite. (a) Domal and grooved cauliflower micrite that grew on peloidal micrite and was postdated by circumgranular calcite and equant calcite cement, plane-polarized light. (b) Detail of (a). (c) Close up view of the cauliflower micrite with internal reticulate porosity filled by microspar (arrows); crossed-polarized light. (d) The cauliflower micrite exhibits an intense autofluorescence; fluorescence image. Abbreviations: m – matrix micrite; pm – peloidal micrite; ccc – circumgranular calcite cement; cm – cauliflower micrite; ec – equant calcite cement.

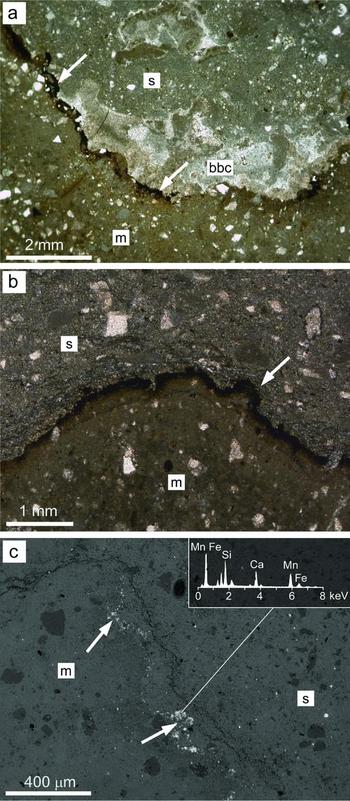
The micritic matrix of the Buje deposits records episodes of carbonate corrosion. The surfaces of the affected aggregates of micrite are highly irregular, and commonly covered by a black rim of an opaque mineral up to a few tens of microns in thickness (Fig. 8a, b). Backscatter and EDS observations revealed that these rims consist of scattered bright grains (Fig. 8c) characterized by high contents of iron and manganese.
Corrosion patterns. (a) Highly irregular cavity surface covered by a black rim (arrows); plane-polarized light. (b) Close up view of the dark irregular rim (arrow); plane-polarized light. (c) Bright spots on corrosion surfaces reveal an enrichment in iron (Fe) and manganese (Mn); see inserted EDS spectrum; SEM micrograph of thin-section, backscatter view. Abbreviations: m – matrix micrite; bbc – banded and botryoidal cement; s – sediment.

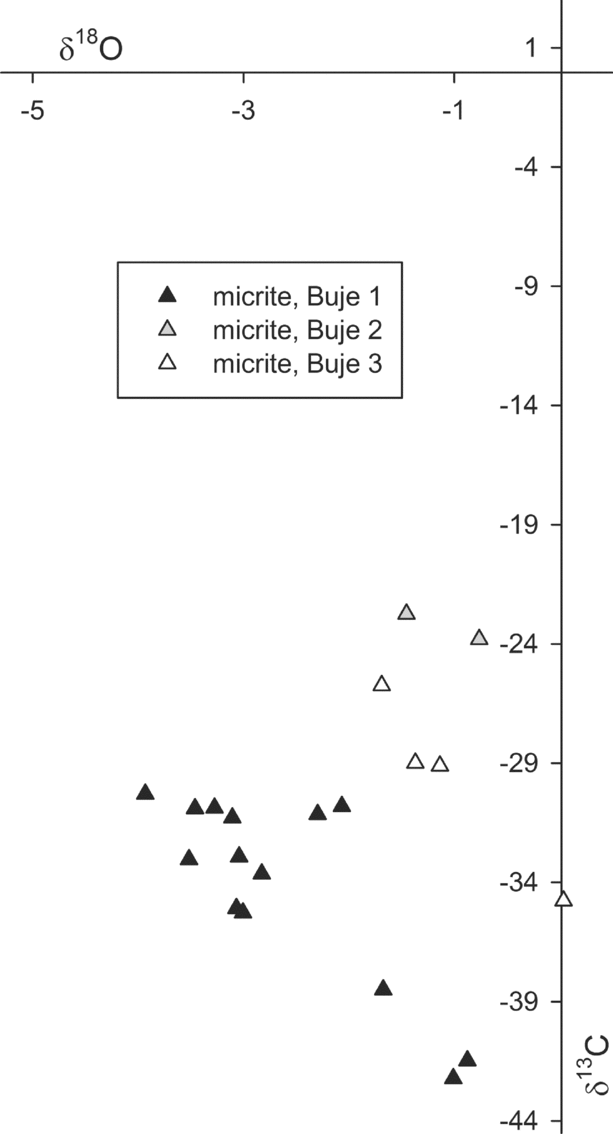
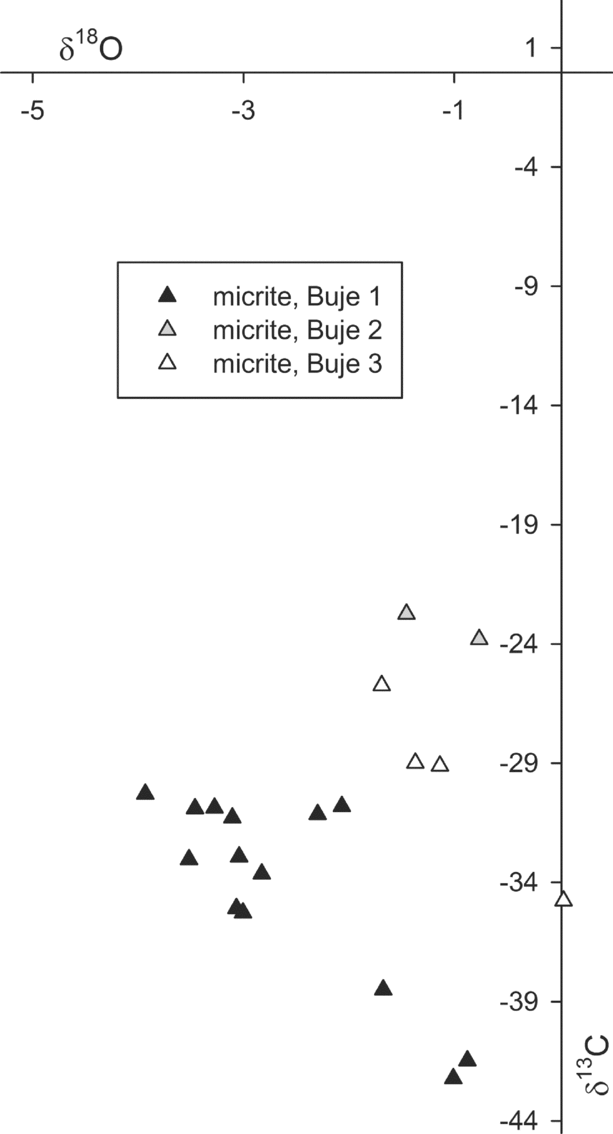
The volumetrically dominant micrite of the Buje carbonates has been analysed for its stable carbon and oxygen isotope composition; the amount of banded and botryoidal cement was not sufficient to allow for isotope analysis. The δ13C values of the micrite range from −42.2 to −22.7 ‰; the corresponding δ18O values range from −3.9 to 0.0 ‰ (Fig. 9). The Buje 1 deposit revealed the most negative δ13C and δ18O values, as low as −42.2 and −3.9 ‰, respectively, with most δ13C values falling between −35.2 and −30.2 ‰. Buje 2 and Buje 3 deposits show overall similar isotope values with less 13C and 18O depletion compared to the Buje 1 deposit.
Cross-plot of the carbon and oxygen stable isotope compositions in per mil versus VPDB standard of micrite forming the Buje seep deposits.
4.c. Biomarkers
Hydrocarbons, carboxylic acids and alcohols were analysed. However, lipid biomarkers in the alcohol fraction are only poorly preserved, and are thus not useful for the interpretation of the depositional environment. The major group of compounds in the hydrocarbon fraction is isoprenoid hydrocarbons (Fig. 10a). Among them are the head-to-tail linked isoprenoid phytane (approximately 60 % of the combined peak) and the tail-to-tail linked isoprenoid crocetane (approximately 40 %); their combined peak is the highest peak in this fraction. The next most abundant isoprenoids are the tail-to-tail linked isoprenoid pentamethylicosane (PMI) and the head-to-head linked isoprenoid biphytane (bp-0). Other, minor constituents are monocyclic biphytane (bp-1) with one cyclopentane ring and the tail-to-tail linked isoprenoid squalane, as well as the head-to-tail linked isoprenoid pristane. Other than isoprenoids, few straight-chain n-alkanes are present. Their overall distribution is patchy with the exception of n-C23, resembling the inventory of modern and ancient, non-oil stained seep carbonates and sediments (e.g. Thiel et al. Reference Thiel, Peckmann, Schmale, Reitner and Michaelis2001; Peckmann et al. Reference Peckmann, Senowbari-Daryan, Birgel and Goedert2007; Chevalier et al. Reference Chevalier, Bouloubassi, Birgel, Taphanel and López-García2013). Apart from aliphatic lipid biomarkers, few cyclic compounds, mainly steranes and one hopanoid, were found. Among the steroids, the most abundant are C28 and C29 steranes. Other detected steroids are lanostanes, which have been described in some seep carbonates (Birgel & Peckmann, Reference Birgel and Peckmann2008). The most abundant cyclic terpenoid found is the hopanoid hop-17(21)-ene.
Lipid biomarker patterns of the Buje 1 seep deposit; numbers in italics indicate compound-specific δ13C values in per mil versus VPDB standard. Gas chromatograms (total ion current) of hydrocarbon (a) and carboxylic acid (b) fractions. (a) Circles – n-alkanes; white triangles – regular, head-to-tail linked isoprenoids; black triangles – irregular, tail-to-tail linked isoprenoids; grey triangles – irregular, head-to-head linked isoprenoids (biphytanes); Cr – crocetane; Ph – phytane; PMI – pentamethylicosane; Sq – squalane; black squares – steranes; istd – internal standard. (b) Circles – n-fatty acids; i – iso-fatty acids; ai – anteiso-fatty acids; M – monoenoic fatty acids; white triangles – regular, head-to-tail linked isoprenoidal acids; PMI – pentamethylicosanoic acid; ββ-32-HA – 17β(H),21β(H)-bishomohopanoic acid; istd – internal standard.
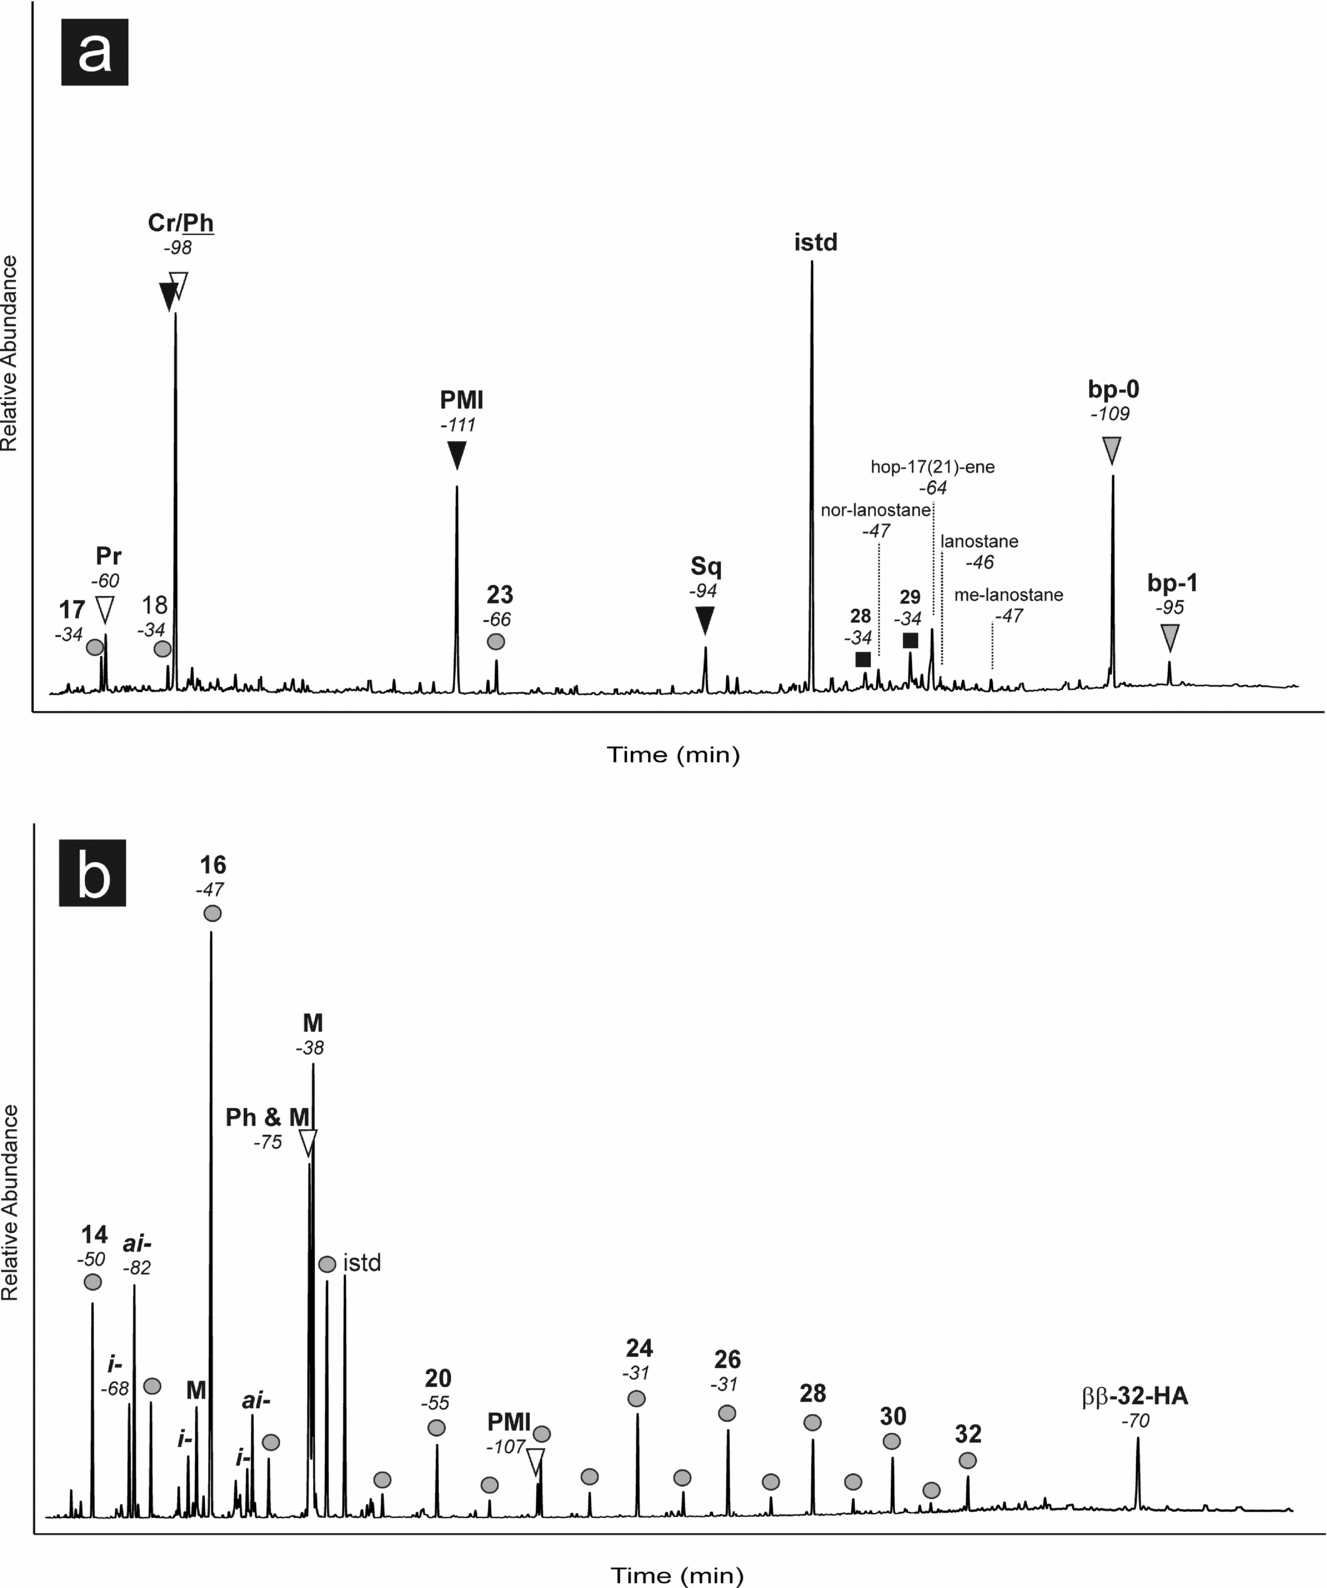
The isoprenoids have the most negative δ13C values with −111 ‰ and −109 ‰ for PMI and bp-0, respectively. The head-to-tail linked isoprenoid pristane (−60 ‰) and the n-alkane n-C23 (−66 ‰) revealed intermediate values (Fig. 9), whereas other short-chain n-alkanes are significantly less 13C-depleted (−34 ‰). The δ13C values of the steranes fall in the same range as the short-chain and long-chain n-alkanes. The lanostanes are more 13C-depleted with an average value of −47 ‰. Hop-17(21)-ene is more 13C-depleted (−64 ‰) than the lanostanes.
The carboxylic acid fraction is dominated by n-fatty acids ranging from C14 to C32 (Fig. 10b). The fatty acids are characterized by an overall even-over-odd predominance. Highest contents were found for short-chain n-C16 fatty acid. Other abundant compounds are n-C16 and C18 fatty acids with one double bond. Apart from n-fatty acids, terminally branched fatty acids are abundant, especially those comprising 15 carbons. Other compounds in the carboxylic acid fraction are phytanoic acid and PMI acid. Phytanoic acid co-elutes with a C18:1 fatty acid. Only one hopanoic acid, 17β(H),21β(H)-bishomohopanoic acid, was identified.
The strongest 13C depletions in the carboxylic acids were found for the isoprenoid PMI acid (−107 ‰). Although combined with the isotopic signature of the co-eluting n-C18:1 fatty acid, phytanoic acid is still considerably 13C-depleted (−75 ‰). Other compounds with significant depletion in 13C are the terminally branched iso- and anteiso-C15 fatty acids with δ13C values of −68 ‰ and −82 ‰, respectively, as well as 17β(H),21β(H)-bishomohopanoic acid (−70 ‰). The short-chain n-fatty acids yielded values of around −50 ‰, whereas the long-chain fatty acids revealed higher values (average −31 ‰).
5. Discussion
5.a. Biogeographic and evolutionary aspects
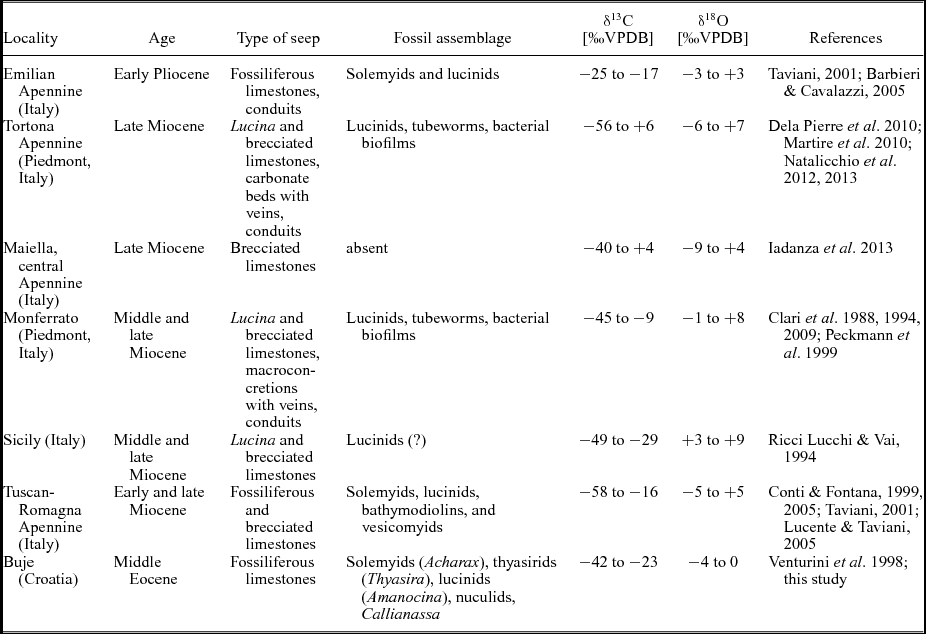
Methane seepage and associated faunal communities in the Mediterranean realm are known from the late Mesozoic period when large lucinid bivalves and rhynchonellide brachiopods inhabited cold seeps along the northern shore of the Tethys Ocean (Gaillard, Rio & Rolin, Reference Gaillard, Rio and Rolin1992; Campbell & Bottjer, Reference Campbell and Bottjer1995; Peckmann et al. Reference Peckmann, Thiel, Michaelis, Clari, Gaillard, Martire and Reitner1999; Kiel, Reference Kiel2013) and from the Miocene onwards, largely along the Apennine chain in Italy (Ricci Lucchi & Vai, Reference Ricci Lucchi and Vai1994; Taviani, Reference Taviani, Reitner, Quéric and Arp2011). These Neogene seep deposits are generally referred to as ‘Calcari a Lucina’ (Clari et al. Reference Clari, Gagliardi, Governa, Ricci and Zuppi1988; Taviani, Reference Taviani1994). Among them, the Miocene deposits contain essentially a modern seep fauna consisting of large bathymodiolin, vesicomyid and lucinid bivalves, while the few Pliocene examples appear to have a reduced character of the modern Mediterranean Sea seep fauna (Table 1; Taviani, Reference Taviani, Goffredo and Dubinsky2014). Many of the taxa that inhabit vents and seeps today originated in early Cenozoic time (Kiel & Little, Reference Kiel and Little2006; Amano & Kiel, Reference Amano and Kiel2007; Kiel & Amano, Reference Kiel and Amano2013; Vrijenhoek, Reference Vrijenhoek2013). The middle Eocene Buje deposits can thus provide insights into the early evolution of the seep fauna and its biogeography.
Schematic overview of the Palaeogene and Neogene seep deposits across the Mediterranean

The only seep deposits coeval with the Buje seeps are those of the middle Eocene Humptulips Formation in western Washington State, USA, and thus from the Pacific realm (Goedert & Squires, Reference Goedert and Squires1990). They share the common solemyids, the large thyasirids and the edentulous lucinids, although the latter are represented by different genera in the two regions (cf. Goedert & Squires, Reference Goedert and Squires1990; Saul, Squires & Goedert, Reference Saul, Squires and Goedert1996; Kiel, Reference Kiel2013). The Humptulips seep deposits differ, however, by the presence of large, high spired gastropods (Goedert & Kaler, Reference Goedert and Kaler1996; Kiel, Reference Kiel2008) and vesicomyid bivalves (Squires & Goedert, Reference Squires and Goedert1991; Amano & Kiel, Reference Amano and Kiel2007), which appear to be absent from the Buje deposits. The Humptulips limestones also include the earliest bathymodiolin mussels discovered so far (Kiel & Amano, Reference Kiel and Amano2013). From one of the seep deposits at Buje, Venturini et al. (Reference Venturini, Selmo, Tarlao and Tunis1998) reported several specimens of the mytilid ‘Modiolus’ that could potentially represent an as-yet unidentified bathymodiolin mussel; unfortunately, that particular deposit was no longer accessible during our field work and the identity of this mussel remains elusive. The fauna of the Buje seep deposits is only a first glimpse into the Eocene seep fauna of the central Tethys Ocean and is unlikely to represent the full diversity of the regional pool of seep-inhabiting taxa. However, if taken at face value, the absence of the main modern taxa (bathymodiolins and vesicomyids) from Buje at a time when these taxa were present at Pacific seeps is in agreement with molecular phylogenetic analyses (Lorion et al. Reference Lorion, Kiel, Faure, Masaru, Ho, Marshall, Tsuchida, Miyazaki and Fujiwara2013; Roterman et al. Reference Roterman, Copley, Linse, Tyler and Rogers2013; Stiller et al. Reference Stiller, Rousset, Pleijel, Chevaldonne, Vrijenhoek and Rouse2013) and quantitative biogeographic analyses (Bachraty, Legendre & Desbruyères, Reference Bachraty, Legendre and Desbruyères2009; Moalic et al. Reference Moalic, Desbruyères, Duarte, Rozenfeld, Bachraty and Arnaud-Haond2012), which indicate a Pacific origin of the modern vent and seep fauna.
Compared to the ‘Calcari a Lucina’ seep deposits in the Italian Miocene (Fig. 1a; Clari et al. Reference Clari, Fornara, Ricci and Zuppi1994; Taviani, Reference Taviani1994) and the modern Mediterranean seep fauna (Olu-Le Roy et al. Reference Olu-Le Roy, Sibuet, Fiala-Médoni, Gofas, Salas, Mariotti, Foucher and Woodside2004; Ritt et al. Reference Ritt, Sarrazin, Caprais, Noël, Gauthier, Pierre, Henry and Desbruyères2010; Taviani et al. Reference Taviani, Angeletti, Ceregato, Foglini, Froglia and Trincardi2013), the middle Eocene seep fauna at Buje shows clear differences (Table 1). Solemyids are rare in the Neogene to modern seeps in the Mediterranean Sea (Taviani, Angeletti & Ceregato, Reference Taviani, Angeletti and Ceregato2011; Rodrigues, Duperron & Gaudron, Reference Rodrigues, Duperron and Gaudron2011) in contrast to Buje, where they are common. Also the large Thyasira is a distinctive feature of the Buje seeps, while thyasirids are absent from the ‘Calcari a Lucina’ deposits (Taviani, Reference Taviani, Reitner, Quéric and Arp2011; S. Kiel, pers. obs.), and in the modern Mediterranean seep fauna they are represented only by a small (~ 10 mm) species (Olu-Le Roy et al. Reference Olu-Le Roy, Sibuet, Fiala-Médoni, Gofas, Salas, Mariotti, Foucher and Woodside2004). The lucinids in the Miocene to modern Mediterranean seeps clearly belong to different genera than the lucinid at Buje (Olu-Le Roy et al. Reference Olu-Le Roy, Sibuet, Fiala-Médoni, Gofas, Salas, Mariotti, Foucher and Woodside2004; Taviani, Reference Taviani, Reitner, Quéric and Arp2011; Kiel & Taviani, unpub. data), which belongs to the widespread Early Cretaceous to Oligocene genus Amanocina.
5.b. Microbial activity steering carbonate formation and destruction
The Buje carbonate deposits show several petrographical and geochemical lines of evidence that agree with a microbial origin sustained by hydrocarbon seepage. Not only do the negative δ13C values as low as −42 ‰ agree with methane seeping (cf. Paull et al. Reference Paull, Chanton, Neumann, Coston, Martens and Showers1992; Peckmann & Thiel, Reference Peckmann and Thiel2004), but also microfabrics, such as peloidal and clotted micrite, laminated micrite, and banded and botryoidal cement filling cavities, are typical of seep carbonates (e.g. Peckmann & Thiel, Reference Peckmann and Thiel2004). Finally, lipid biomarkers characteristic for methane seepage are found in the Buje deposits, confirming their microbial origin resulting from methane oxidation. Among the observed compounds, the most 13C-depleted acyclic isoprenoids such as mixed phytane/crocetane (−98 ‰), PMI (−111 ‰) and acyclic biphytane (−109 ‰) are molecular fossils of methanotrophic archaea (e.g. Elvert, Suess & Whiticar, Reference Elvert, Suess and Whiticar1999; Peckmann & Thiel, Reference Peckmann and Thiel2004; Birgel et al. Reference Birgel, Thiel, Hinrichs, Elvert, Campbell, Reitner, Farmer and Peckmann2006b ; Peckmann, Birgel & Kiel, Reference Peckmann, Birgel and Kiel2009). These biomarkers are accompanied by molecular fossils of sulphate-reducing bacteria, such as iso- and anteiso-C15 fatty acids (Elvert et al. Reference Elvert, Boetius, Knittel and Jørgensen2003; Birgel et al. Reference Birgel, Peckmann, Klautzsch, Thiel and Reitner2006a ). As commonly observed in seep deposits, the lipids of the sulphate-reducing bacteria involved in anaerobic oxidation of methane are less 13C-depleted (−82 ‰ for anteiso-C15 FA) than the lipids of methanotrophic archaea (e.g. Peckmann & Thiel, Reference Peckmann and Thiel2004).
At first glance, the petrographical characteristics and stable isotope and lipid biomarker patterns of the Buje deposits are not much different from other ancient Mediterranean seep deposits (e.g. Peckmann et al. Reference Peckmann, Thiel, Reitner, Taviani, Aharon and Michaelis2004; Clari et al. Reference Clari, Dela Pierre, Martire and Cavagna2009; Natalicchio et al. Reference Natalicchio, Dela Pierre, Clari, Birgel, Cavagna, Martire and Peckmann2013). However, the Buje seep deposits show some peculiarities, for example the occurrence of cauliflower micrite. These dome-shaped precipitates are made up of fluorescent clotted micrite and formed in situ within cavities, properties that typify the products of organomineralization (cf. Reitner et al. Reference Reitner, Gautret, Marin and Neuweiler1995; Dupraz et al. Reference Dupraz, Reid, Braissant, Decho, Norman and Visser2009). Two possible modes of formation are envisaged: (1) mineralized microbial mats or (2) sponges. (1) Mineralized biofilms have already been documented in Eocene seep deposits from western Washington State (Peckmann et al. Reference Peckmann, Goedert, Heinrichs, Hoefs and Reitner2003) and in Miocene seep deposits from the Italian Apennine (Peckmann et al. Reference Peckmann, Thiel, Michaelis, Clari, Gaillard, Martire and Reitner1999). The cauliflower shape, representing a domal, accretionary mode of growth on a millimetre to centimetre scale in a cryptic environment, is different from previous reports of much thinner mineralized biofilms within cracks of pre-existing seep carbonate. Based on the larger size of the Buje cauliflower micrite and its domal growth habit along with its intense autofluorescence, it seems feasible that this micrite resulted from the mineralization of microbial mats that performed anaerobic oxidation of methane. The validity of this scenario is enforced by the presence of subsurface microbial mats of anaerobic oxidation of methane-performing prokaryotes at active seeps in the Black Sea (Treude et al. Reference Treude, Knittel, Blumenberg, Seifert and Boetius2005). (2) Alternatively, the domal growth, clotted microfabric and reticulate porosity of the cauliflower micrite resemble the outcome of sponge taphonomy (e.g. Delecat, Peckmann & Reitner, Reference Delecat, Peckmann and Reitner2001). Because no spicules have been observed, it is unlikely that cauliflower micrite represents fossils of spicular sponges. Even in the case of siliceous spicules, the spicules would have probably been preserved in the authigenic seep carbonate. Where sponges have been reported in ancient seep deposits, their overall preservation including spicules was good in the case of Mesozoic examples (Peckmann et al. Reference Peckmann, Thiel, Michaelis, Clari, Gaillard, Martire and Reitner1999) and excellent in the case of Cenozoic examples (Goedert & Squires, Reference Goedert and Squires1990; Rigby & Goedert, Reference Rigby and Goedert1996). If the sponge interpretation is correct, the sponges were probably non-spicular, belonging to a group informally referred to as keratose demosponges (J. Reitner, pers. comm.). Despite lacking spicules, the taphonomy of the keratose sponges results in micritic carbonate fabrics that can still be recognized in Phanerozoic rocks (Luo & Reitner, Reference Luo and Reitner2014). Seep-dwelling sponges have been reported from a number of modern sites (Olu-Le Roy et al. Reference Olu-Le Roy, Sibuet, Fiala-Médoni, Gofas, Salas, Mariotti, Foucher and Woodside2004 and references therein). Some demosponges have even been shown to contain endosymbiotic methanotrophic bacteria (Vacelet et al. Reference Vacelet, Fiala-Médioni, Fisher and Boury-Esnault1996; Olu-Le Roy et al. Reference Olu-Le Roy, Sibuet, Fiala-Médoni, Gofas, Salas, Mariotti, Foucher and Woodside2004; Baco et al. Reference Baco, Rowden, Levin, Smith and Bowden2010).
The abundant irregular corrosion surfaces partially covered by iron and manganese precipitates indicate dissolution of carbonate. Such dissolution features coupled with iron and manganese enrichment have commonly been interpreted as the product of microbially driven corrosion, as for example reported for reef carbonates (Reitner et al. Reference Reitner, Thiel, Zankl, Michaelis, Wöhrheide, Gautret, Riding and Awramik2000; Tribollet et al. Reference Tribollet, Golubic, Radtke, Reitner, Reitner, Quéric and Arp2011). Analogous features have also been observed in ancient (Campbell, Farmer & Des Marais, Reference Campbell, Farmer and Des Marais2002; Peckmann et al. Reference Peckmann, Goedert, Heinrichs, Hoefs and Reitner2003; Birgel et al. Reference Birgel, Peckmann, Klautzsch, Thiel and Reitner2006a ) and modern (Matsumoto, Reference Matsumoto1990; Himmler et al. Reference Himmler, Brinkmann, Bohrmann and Peckmann2011) seep carbonates and were interpreted as biologically induced corrosion features as well. Matsumoto (Reference Matsumoto1990) was the first to suggest that carbonate corrosion at seeps is driven by bacterial aerobic methane oxidation and sulphide oxidation. Both processes have the potential to lower the pH and may thus promote carbonate dissolution (Himmler et al. Reference Himmler, Brinkmann, Bohrmann and Peckmann2011; Tribollet et al. Reference Tribollet, Golubic, Radtke, Reitner, Reitner, Quéric and Arp2011). Molecular fossils of sulphide-oxidizing bacteria cannot be easily identified in ancient rocks, since these lipids are of low specificity and prone to degradation (cf. Arning et al. Reference Arning, Birgel, Schulz-Vogt, Holmkvist, Jørgensen, Larsson and Peckmann2008). In contrast, the former presence of aerobic methanotrophs at seeps can be constrained by lipid biomarkers including lanostanes and some hopanoids (Peckmann et al. Reference Peckmann, Thiel, Michaelis, Clari, Gaillard, Martire and Reitner1999, Reference Peckmann and Thiel2004; Birgel & Peckmann, Reference Birgel and Peckmann2008; Sandy et al. Reference Sandy, Lazăr, Peckmann, Birgel, Stoica and Roban2012). The low δ13C values of lanostanes and hopanoids in the Buje limestones agree with aerobic methanotrophs as source organisms, although other sources cannot be excluded in case of the 13C-depleted hopanoids (cf. Blumenberg et al. Reference Blumenberg, Krüger, Nauhaus, Talbot, Oppermann, Seifert, Pape and Michaelis2006; Eickhoff et al. Reference Eickhoff, Birgel, Talbot, Peckmann and Kappler2013). The potential of aerobic methanotrophs to cause carbonate dissolution has recently been proven in laboratory experiments (Krause et al. Reference Krause, Aloisi, Engel, Liebetrau and Treude2014). Based on the confirmation that this mechanism is indeed capable of inducing carbonate dissolution and the detection of molecular fossils of aerobic methanotrophs, carbonate corrosion archived in the Buje seep limestones is best explained by aerobic methanotrophy.
5.c. Constraints on fluid flow
The occurrence of both anaerobic oxidation of methane – as revealed by 13C-depleted biomarkers and 13C-depleted authigenic carbonates – and aerobic oxidation of methane – as revealed by 13C-depleted biomarkers and carbonate corrosion – indicates discontinuous oxygenation conditions in the subsurface close to the seafloor at the Buje seep sites.
The precipitation of the 13C-depleted micrite driven by anaerobic oxidation of methane occurred in anoxic environments within the pore space of the detrital background sediment, leading to the occlusion of the sedimentary matrix. After the pore space was successively filled by micrite, carbonate precipitation was largely restricted to some cavities resulting from preceding bioturbation, and allowing for the formation of fibrous, banded and botryoidal aragonite cement and clotted micrite. Based on the evidence for carbonate corrosion and the preservation of diagnostic biomarkers, at least some of the aerobic methanotrophic bacteria most probably lived in oxic sediments, rendering it unlikely that these biomarkers were exclusively sourced from bacteria dwelling in the water column above the seeps.
A set of observations indicates that the mode of seepage was diffusive rather than advective. The Buje seep limestones largely consist of authigenic micrite cementing background sediments. Such a pattern with the dominance of micrite over early diagenetic aragonite cements is typical for diffusive seepage (e.g. Peckmann, Birgel & Kiel, Reference Peckmann, Birgel and Kiel2009; Haas et al. Reference Haas, Peckmann, Elvert, Sahling and Bohrmann2010). Similarly, the faint stratification apparent in the Buje 1 deposit is an additional argument in favour of this interpretation. Similarly, the circumstance that biphytane occurs in much higher contents than crocetane agrees with the dominance of archaea of the so-called ANME-1 group (Blumenberg et al. Reference Blumenberg, Seifert, Reitner, Pape and Michaelis2004; Niemann & Elvert, Reference Niemann and Elvert2008; Rossell et al. Reference Rossell, Elvert, Ramette, Boetius and Hinrichs2011), another observation in favour of diffusive seepage (Nauhaus et al. Reference Nauhaus, Treude, Boetius and Krüger2005; Peckmann, Birgel & Kiel, Reference Peckmann, Birgel and Kiel2009). ANME-1 archaea, like ANME-2 archaea, are commonly associated with sulphate-reducing bacteria of the Desulfosarcina/Desulfococcus branch of the Deltaproteobacteria (Knittel & Boetius, Reference Knittel and Boetius2009). The bacterial partners of the ANME-1 archaea can be discerned from those of the ANME-2 archaea by a much higher proportion of ai-C15 fatty acid (Blumenberg et al. Reference Blumenberg, Seifert, Reitner, Pape and Michaelis2004; Niemann & Elvert, Reference Niemann and Elvert2008), a compound that is particularly abundant in the Buje limestones (see Fig. 10b). All these observations argue in favour of diffusive seepage. It should, however, be kept in mind that other factors than just seepage activity can influence the distribution of ANME-1 versus ANME-2 archaea and the abundance of aerobic methanotrophs as well. An obvious factor for example is temperature, whereby higher temperatures are known to favour ANME-1 over ANME-2 archaea (Nauhaus et al. Reference Nauhaus, Treude, Boetius and Krüger2005).
It is interesting to note that some Cretaceous seep deposits for which diffusive seepage has been envisaged contain biomarkers of aerobic methanotrophs as well (Peckmann, Birgel & Kiel, Reference Peckmann, Birgel and Kiel2009; Sandy et al. Reference Sandy, Lazăr, Peckmann, Birgel, Stoica and Roban2012), although the majority of seep deposits lack these compounds (e.g. Peckmann & Thiel, Reference Peckmann and Thiel2004). Because the sulphate–methane transition zone (SMTZ) tends to be situated deeper within the sediments at sites of diffusive seepage than at sites of advective seepage (e.g. Sahling et al. Reference Sahling, Rickert, Lee, Linke and Suess2002; Luff & Wallmann, Reference Luff and Wallmann2003), we suggest that the preservation of lipids of aerobic methanotrophs is favoured in limestones forming at seeps typified by diffusive seepage – this is not meant to say that aerobic methanotrophs are necessarily more abundant at diffusive seeps. With aerobic methanotrophy being able to extend to greater sediment depth at diffusive seeps, the likelihood probably increases that the lipids of aerobic methanotrophs become engulfed in authigenic seep carbonates at a later stage upon dilatation of the zone of anaerobic oxidation of methane. If seepage continues for extended periods of time – as envisaged for the thick Buje 1 deposit – the prolonged formation of methane-derived carbonates, thus, assures the preservation of process markers of those biogeochemical processes that occurred in close proximity to the strata affected by anaerobic oxidation of methane. This effect will be intensified upon variations of seepage intensity that allow for vertical displacement of the SMTZ (cf. Feng, Chen & Peckmann, Reference Feng, Chen and Peckmann2009). An upward movement of the SMTZ caused by an increase in seepage intensity and accompanied by a shift in carbonate formation to a shallower depth will particularly favour the preservation of the lipids of aerobic methanotrophs.
6. Conclusions
The fossil record and molecular age estimates indicate that the dominant taxa of the modern vent and seep fauna appeared during Eocene time. The fossil record of seep communities of this age, however, is highly skewed towards the Pacific region and thus the macrofauna of the Buje seep deposits provides a first glimpse into the seep fauna of the Tethyan region. The absence of the main modern taxa (bathymodiolin mussels and vesicomyid clams) from the Buje seeps agrees with other lines of evidence suggesting that the modern vent and seep fauna originated in the Pacific Ocean. The Buje seep fauna also indicates a dynamic evolution of seep faunas in the Tethyan/Mediterranean basin: it resembles Cretaceous to early Palaeogene seep faunas from other parts of the world, whereas the late Miocene ‘Calcari a Lucina’ fauna in Italy resembles other Miocene to modern seep faunas worldwide; the Pliocene seep faunas from northern Italy have the somewhat restricted character of Mediterranean seep fauna today that probably resulted from the extinction of the more ‘oceanic’ Miocene seep faunas during the Messinian salinity crisis.
The Buje seep deposits formed as a consequence of anaerobic oxidation of methane as revealed by the presence of 13C-depleted biomarkers of methanotrophic archaea and associated sulphate-reducing bacteria. Apart from these anaerobic prokaryotes, aerobic methanotrophic bacteria lived at the middle Eocene seeps. Their metabolism apparently led to a local decrease in pore water pH values, which resulted in the dissolution of carbonate minerals. The large size of the Buje 1 deposit suggests that seepage activity was long lasting. (1) Its faint stratification, (2) the dominance of authigenic micrite over early diagenetic fibrous cement, (3) biomarker patterns of the prokaryotes performing anaerobic oxidation of methane, and (4) possibly the preservation of the lipids of aerobic methanotrophs indicate that seepage activity was mostly diffusive rather than advective.
Acknowledgements
We thank Leopold Slawek (Vienna, Austria) for thin-section preparation, Gerhard Hundertmark (Göttingen, Germany) for photography, Monika Segl (Bremen, Germany) for carbon and oxygen isotope analysis of carbonate samples, Birgit Wild and Andreas Richter (both Vienna, Austria) for help with compound-specific carbon isotope measurements, Joachim Reitner (Göttingen, Germany) for comments on keratose sponges, Donata Violanti (Torino, Italy) for help with identification of foraminifera, and two anonymous referees for comments that helped improve the manuscript. Financial support was provided by the Deutsche Forschungsgemeinschaft through grant Ki802/6–1 to SK.