

Introduction
All breeding plans for commercial egg laying stocks have one major objective in common; to increase the genetic potential of a laying hen population in order to produce a maximum number of marketable eggs at minimum cost in a given production cycle. In terms of this overall breeding target and according to Besbes et al. (Reference BESBES, DUCROCQ and PROTAIS2002), three main traits; egg number, egg quality and feed efficiency have first priority on selection. Additional selection traits include the capability of resistance and the laying hens’ behaviour as shown by Preisinger (Reference PREISINGER1997). Together with many subtopics of these selection traits, there are more than 20 different aspects which have to be included in the selection index or at least in the final selection decision. Besbes and Ducrocq (Reference BESBES and DUCROCQ2003), Flock et al. (Reference FLOCK, SCHMUTZ and PREISINGER2007) and Preisinger (Reference PREISINGER1997) have described most of these characteristics. To determine the power of each single selection trait, an evaluation of the different market needs for the next year is necessary. Since the decision in 1999 to ban conventional cages in the EU by the year 2012, there has been a trend towards cage-free housing for laying hens in Europe, but in accordance with the International Egg Commission (IEC, Reference IEC2007), cage facilities worldwide still dominate. Varying housing systems are connected to different requirements of the laying hen (Besbes, Reference BESBES2001).The behaviour of hens, for example, is of less importance in cages, but is gaining interest regarding group housing. When not housed in cages, layers have to visit nest boxes in group housing systems to produce clean saleable eggs and thus save on the farmer's income. Nest acceptance is therefore one new selection trait which has to be included in the selection index, especially since preferences of mainly European egg producers are higher for hens with good nesting behaviour. Furthermore, laying performance and egg quality traits for group housing systems are still of high economic relevance. In general, these traditional selection traits are based on data of hens that are housed in single bird cages, however, differences between testing and production environment of tested pedigree layers could reduce selection response in commercials. A new testing possibility that enables individual performance testing in cage free housing systems is therefore desirable. Based on the literature of Cooper and Appleby (Reference COOPER and APPLEBY1995) as well as of Lundberg and Keeling (Reference LUNDBERG and KEELING1999), direct observations as well as video analysis are suitable to describe the hen's behaviour. These methods are, however, very costly in terms of labour and time, and therefore, not feasible in a comprehensive performance test of breeding companies. Alternatively, Lohmann Tierzucht and the Bavarian State Research Centre Freising, Weihenstephan have developed a transponder-based recording system which automatically captures hen-specific laying performance and behaviour. The functionality of this special nest box and pop hole, as well as the obtained information from tested flocks should be summarised in this following review.
Methods of performance testing in layers
The controlled housing in single bird and group cages has been considered as the most favourable environment for testing birds and lines which are dedicated for caged production units. Performance testing in single bird cages provides exact hen specific data for the most important selection traits. Thus, daily egg numbers, feed intake and egg quality characteristics can be captured with justifiable efforts and in sufficient amounts for very reliable genetic analyses. Group cages, housed with full and half sib hens, enable phenotypic data recording for general behaviour and the hens’ plumage condition as well as their extent of production in one family. Other behaviour related traits such as nest acceptance, for welfare and economic reasons, which of increasing interest cannot be captured in cage systems. Therefore, hens have to be tested under floor housing conditions and preferably individually (Preisinger, Reference PREISINGER1997). For realisation purposes, a special nesting system was developed which is subsequently described here. Furthermore, a second recording method, the Electronic Pop Hole (EPH) was created to analyse ranging behaviour.
Weihenstephan Funnel Nest Box (FNB)
The Weihenstephan Funnel Nest Box (FNB) is a newly developed single nest box which, in accordance to Icken (Reference ICKEN2009), can be used to capture individual performance and behaviour traits of layers in floor housing. When developing the FNB, the biggest challenge was to select one hen from the whole flock without any disturbance of the hen's natural behaviour. One possibility is to fix several trap devices at the entrance of the nest box. As long as no hen is inside the nest box, the trap devices swing in both directions: into the nest box and out of the nest box. However, as soon as one hen enters the nest box, the funnel nest floor tilts causing the trap device to be pushed in the direction out of the nest. This simple mechanism guarantees that a hen can decide by itself when she wants to enter and leave the nest. For hen identification, each hen is tagged with a passive transponder (Texas Instruments, HDX, ISO, 23.10 * 3.85 mm) as Thurner et al. (Reference THURNER, WENDL, PREISINGER, FRÖHLICH, BÖCK and WEINFURTNER2005) described. This transponder is fixed to the leg of the hen using a Leg Band (Roxan ID, modified). An antenna, which is integrated in the funnel nest floor, receives the transponder signal as soon as a hen is in the nest and therefore, each hen is identified from the time she enters until she leaves the nest box.
Additionally, the specially-designed funnel nest box which is shown in Figure 1, helps to orientate the hen to place its head towards the nest entrance for a better reading performance as well as guarantees that every egg rolls out of the nest immediately after being laid. The egg is registered at the seesaw egg sensor directly after leaving the nest box. All eggs in a nest box are collected in the order of lay in the egg collecting tube located behind the nest box. The combination of the transponder signal, the signal from the egg sensor and the position of the egg in the egg collecting tube, enables the assignment of each egg to the individual hen.
The reliability of the correct assignment ‘hen to egg’ was tested with a small percentage of additional housed hens which laid coloured eggs as compared to those in the main flock. For these coloured eggs, the position of each egg in the collecting tubes was manually recorded on a daily basis. Afterwards, it was checked whether a white or brown layer had been assigned to a white or brown egg. The results show that 96% of these other coloured eggs were correctly assigned. The reasons for incorrect allocation were: double nest occupation (<1%, e.g. an egg was laid while two hens were in the nest box and a correct assignment was therefore not possible), incorrect egg identification (~ 2%, e.g. a soft shelled egg blocked the seesaw egg sensor causing subsequently laid eggs to pile up and could therefore not be registered), plausibility problems (< 1%, e.g. two eggs were assigned to one hen on the same day) and non-specific errors (~ 1%, e.g. the position of another coloured egg was not written down correctly). These results are similar to results observed from a video surveillance resulting in nearly 98% of correctly recorded nest entrances and exits and can be read in Thurner et al. (Reference THURNER, WENDL, PREISINGER, FRÖHLICH, BÖCK and WEINFURTNER2005).
Weihenstephan Funnel Nest Box (FNB).

Electronic Pop Hole (EPH)
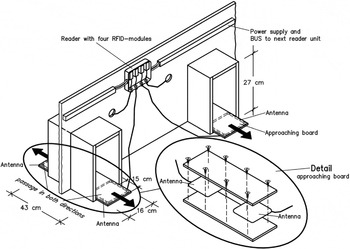
To get reliable information about the individual ranging behaviour of laying hens over a long period of time, four Electronic Pop Holes (EPH) were installed in the same barn which is equipped with 48 FNB. According to Icken et al. (Reference ICKEN, CAVERO, SCHMUTZ, THURNER, WENDL and PREISINGER2008b), the hens can reach an adjacent free-range area through these EPHs. Data recording system is similar to the transponder – antenna principle in FNB. Each EPH is equipped with two antennas which are integrated into the approaching boards that are attached to the pop holes on both sides to ease the passage through the pop hole as shown in Figure 2. The direction of the passage through the EPH can be determined with the order of the transponder readings at both antennas. The time of each reading at an antenna is recorded by a reader which can operate four antennas. A software package based on a specific evaluation routine, determines the whereabouts of each hen (barn, pop hole or winter garden) throughout the day including the length of time spent at each location. These data makes it possible to determine the time of the day when the hens went into the roofed winter garden, and the total time spent in the outside area including the total behaviour pattern.
Electronic Pop Hole (EPH).

Captured phenotypes with both systems - FNB and EPH
The simultaneous recording of data for laying performance, egg quality, nesting and ranging behaviour of each individual pedigree hen in group housing, give additional phenotypic information for breeding value estimation. As described by Icken (Reference ICKEN2009), the FNB provides data about the moment each hen lays her egg, allowing each egg to be assigned to the individual hen, thereby calculating the laying performance of each hen at a given time frame. The exact oviposition time enables the analyses of individual laying patterns. Based on the time spent in the nest box, nest to hen ratios can be deduced in terms of optimal housing densities. As published by Icken et al. (Reference ICKEN, CAVERO, SCHMUTZ, THURNER, WENDL and PREISINGER2008b) for the first time, the EPH enables data recording of the single trait free-range acceptance which can also be captured specifically for each hen. Subsequently, results from analysis of these newly recorded phenotypes on pedigree hens as well as their relevance to the breeding program and selection procedures of layers are described.
laying performance
In accordance with Flock et al. (Reference FLOCK, SCHMUTZ and PREISINGER2007), high egg numbers and low production costs are required worldwide, regardless of the housing system. This means one main target has to be achieved under highly varying management and environmental conditions.
Presuming good egg quality characteristics, the number of eggs laid in cages is mostly equal to the number of saleable eggs however, as explained by Icken et al. (Reference ICKEN, THURNER, CAVERO, SCHMUTZ, WENDL and PREISINGER2009), the aspect of nest acceptance has to be added when talking about saleable eggs in floor housing. First of all, eggs that are displaced in the system generate a lot of effort when collecting each single egg manually. Furthermore, these so-called ‘floor eggs’ are often non-saleable. They are contaminated with manure and, in countries where egg washing is prohibited, the farmers are not allowed to sell them, which drastically lowers the sales profit. From this point of view, the requirements for hens in floor housing are much higher than in cages, and phenotypic data recording in cages is not sufficient. Laying performance tests on the basis of the FNB ensure data recording of the entire selection trait in floor housing: saleable nest eggs. This simultaneous recording of the two important characteristics, nest acceptance and egg number in one trait, is of additional benefit to the selection process. However, a larger number of selection criteria may reduce the power of each single criterion in the selection index, especially if the traits are negatively genetically correlated.
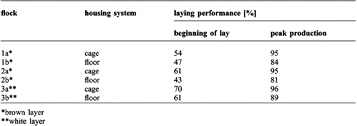
Icken (Reference ICKEN2009) shows results of three different flocks which were each tested in FNBs for five months. The number of hens tested varied between the flocks from 256 to 281 hens. Forty-eight FNBs were available for all flocks which result in nest to hen ratios of around 1:5 or respectively, 1:6. Simultaneously, full sibs of these layers were also tested in single bird cages. A comparison of their performance data (Table 1), shows differences in the performance level of strains in different housing systems.
Average laying performance for brown and white layer sibling-flocks, individually tested in a floor system or respectively, in single bird cages.
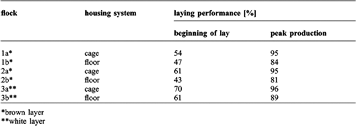
*brown layer
**white layer
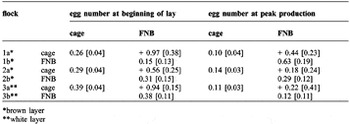
Data recording started at the age of 20 weeks and were carried out for five months in the FNB. For analysis purposes, the entire observation period has been divided into two different parts, the beginning of lay (first and second month of lay), and the period of peak production (second to fifth month of lay). For both parts of the laying cycle, the hens which were tested in the FNB showed, as according to Table 1, reduced laying performance and therefore produced a lower number of saleable nest eggs than the hens in cages. In addition to some displaced floor eggs, the number of saleable nest eggs in the floor system was decreased by a small percentage of incorrectly allocated eggs which had not been counted. In this study, however, the known higher performance potential of the white layer breed as compared to the brown layer breed (International Random Sample Test in Ustrasice 2008/2009), was confirmed for both housing systems. Based on this, genetic parameters such as heritabilities and genetic correlations were estimated (Table 2). At the beginning of lay, the estimated heritabilities for the egg number were, with one exception, higher than those for the period of peak production. This is in accordance with many other studies whereby increasing egg production shows lower heritabilities in terms of decreasing variance (Savaş, Reference SAVAŞ1998). Nurgiartiningshi et al. (Reference NURGIARTININGSHI, MIELENZ, PREISINGER, SCHMUTZ and SCHÜLER2002) referred to heritability estimates of h²=0.02 to 0.42 for the trait egg number, which are on a low to medium level. Therefore, the heritability of h²=0.63 in Table 2 seems to be very high, i.e. at least for flock 1b. Additionally, Table 2 represents genetic correlations between full-sibs, tested in the FNB or cages, respectively. With relatively high genetic correlations of rg = +0.6 to rg= +0.9 for the egg number at the beginning of lay, it can be assumed that there is nearly no genotype environment interaction for this trait unlike at peak production where the estimated correlations are much lower (rg= +0.18 to rg= +0.44) with relatively high standard errors. This suggests that genotype environment interactions might exist for the egg number at peak production.
Heritabilities (diagonal) and genetic correlations as well as their standard errors [SE] for the trait number of saleable nest eggs.

*brown layer
**white layer
nesting behaviour
Further potential selection traits, which are completely new for laying hen performance tests, include the time spent in a nest box as well as the exact oviposition time and the deviated characteristics of the laying hens’ ovulation cycle. In accordance to Icken et al. (Reference ICKEN, THURNER, CAVERO, SCHMUTZ, WENDL and PREISINGER2009), the time spent in a nest box significantly varies between nest visits with or respectively, without oviposition and additionally between white and brown layer strains as shown in Table 3. Brown layers stay for an average of 30 minutes in the FNB when laying an egg, whereas white layers stay 45 minutes inside the nest. Ineffective nest visits, where hens leave the FNB without having laid an egg are much shorter. In such cases, brown layers occupy the FNB for an average of 10 minutes and white layers, for about 30 minutes. Other published nest occupation times for different layer strains range widely, according to Cooper and Appleby (Reference COOPER and APPLEBY1995) and Lundberg and Keeling (Reference LUNDBERG and KEELING1999), from four minutes to more than one hour for one single nest visit. Similar to the occupation times investigated by Icken et al. (Reference ICKEN, THURNER, CAVERO, SCHMUTZ, WENDL and PREISINGER2009), are the results of Wall et al. (Reference WALL, TAUSON and ELWINGER2004). Among others, they tested the same white strain as Icken et al. (Reference ICKEN, THURNER, CAVERO, SCHMUTZ, WENDL and PREISINGER2009) and determined an average time of 41 minutes for each nest visit.
Average oviposition time and duration of stay in the nest for brown and white layers.

Together with the emphasised daytime requirement for oviposition by Icken et al. (Reference ICKEN, CAVERO, SCHMUTZ, THURNER, WENDL and PREISINGER2008a), there is a short time frame during the day in which all nest boxes are fully loaded. In a lighting regime of 16 hours light and 8 hours darkness, it was found that most brown eggs were laid about two hours after the lights were turned on, whereas a high percentage of the white egg layers started looking for a nest three hours after daylight had begun. As shown in Figure 3, the brown egg layers had already reached the maximum rate of daily production at just three hours after the lights came on, whereas the white-egg layers laid most of their eggs six hours after the beginning of daylight. The nest visits of the White Leghorn line were mainly within a period of two hours, whereas the brown-egg line spread its nest visits to more than four hours. Such a short time period in which most of the eggs were laid has been observed by many other authors such as Lillpers (Reference LILLPERS1993) and Zakaria et al. (Reference ZAKARIA, PLUMSTEAD, ROMERO-SANCHEZ, LEKSRISOMPONG, OSBORNE and BRAKE2005), though the time of the day for this period of egg production activity differed between studies. While Zakaria et al. (Reference ZAKARIA, PLUMSTEAD, ROMERO-SANCHEZ, LEKSRISOMPONG, OSBORNE and BRAKE2005) observed broiler breeder flocks with maximum egg production in the morning, Lillpers (Reference LILLPERS1993) noticed that, between 31 and 51 weeks of age, the early afternoon was the main egg laying period for White Leghorn layers which were housed in individual cages.
Distribution of oviposition time during the day for two different strains.

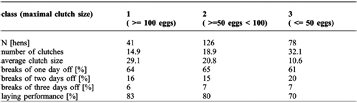
Furthermore, the exact oviposition time is an indirect trait to describe in detail the laying pattern of each individual hen. The most important characteristics are therefore clutch size and time interval between consecutively laid eggs. Many studies have been done on this topic, namely those of Atwood (Reference ATWOOD1929), Bednarczyk et al. (Reference BEDNARCZYK, KIECTZEWSKI and SWACZKOWSKI2000), Icken et al. (Reference ICKEN, THURNER, CAVERO, SCHMUTZ, WENDL and PREISINGER2009) and McClung et al. (Reference MCCLUNG, WANG and JONES1976), however, with the exception of Icken et al. (Reference ICKEN, CAVERO, SCHMUTZ, THURNER, WENDL and PREISINGER2008a) and Atwood (Reference ATWOOD1929), all data were captured on layers which were housed in cages. While Atwood (Reference ATWOOD1929) used labour intensive trap nests, Icken et al. (Reference ICKEN, CAVERO, SCHMUTZ, THURNER, WENDL and PREISINGER2008a) recorded the exact oviposition time with the described FNB, automatically and on a higher number of hens. Icken et al. (Reference ICKEN, CAVERO, SCHMUTZ, THURNER, WENDL and PREISINGER2008a) analysed more than 120,000 nest visits by 263 layers which were taken in a time frame of one year. During the entire observation period, more than 78% of all clutches were bigger than two eggs. Sporadic layers, with clutch sizes of only one egg, were observed mainly at the beginning of lay. The biggest clutch size includes 150 eggs. From 20 weeks of age onwards, the average clutch size for all layers was 12 eggs per clutch. Based on the data of each clutch, the hens have at least one day off. Table 4 shows the percentage of breaks with regard to their duration. More than 61% of all breaks were only one day long. More than four days off in between two clutches were particularly taken into consideration during an infection period in the flock. A classification of the layers by their biggest clutch size in Table 4 shows that more than 50% of the layers belong to the second class with a maximal clutch size of between 50 and 100 eggs. Their average clutch size as well as the average number of clutches is in between the layers that belong to the classes 1 and 3. As expected, the biggest average clutch size with 29 eggs was calculated for the layers of class 1. Associated with the clutch size, the highest laying performance was also calculated for the layers of class one, followed by the hens of the categories 2 and 3 (Table 4).
Mean number of laying sequences and their length, as well as the fraction percentage of 1, 2, 3 and more days off per hen group.
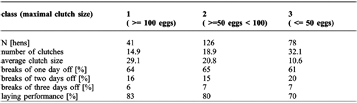
The low laying performance of category three in Table 4 is mainly attributed to the high clutch number which is associated with a high number of breaks. However, the duration of each break seems to be of less importance for the performance rate. The authors, however, expect an influence of the previous clutch length on the breaking length. In accordance to a positive genetic correlation (rg = +0.49) between the clutch size and the subsequent pause duration, the tendency for longer breaks following an increasing laying sequence, was confirmed. Additionally, Atwood (Reference ATWOOD1929) emphasised that an increasing time interval is related to a decrease in clutch size. Due to these correlations, the lower laying performance of hens with a time interval of more than 24 hours and 15 minutes between two consecutively laid eggs as published in Icken et al. (Reference ICKEN, CAVERO, SCHMUTZ, THURNER, WENDL and PREISINGER2008a), can also be explained. In this study, it was shown that hens with a time interval of between 24 hours to 24 hours and 15 minutes, had the highest laying performance, even higher than the hens with a time interval of less than 24 hours.
The heritabilities for the time interval and the clutch size are in accordance to Icken et al. (Reference ICKEN, CAVERO, SCHMUTZ, THURNER, WENDL and PREISINGER2008a). While the estimated heritability for the time interval was less than 10%, the heritability of the clutch size was h² = 0.25. Therefore, the heritability of the clutch size is on the same level as the direct nesting behaviour traits: oviposition time and the time spent in the nest. On the basis of a repeatability model, Icken (Reference ICKEN2009) estimated heritabilities for different flocks at different ages. In total, the average heritability for the oviposition time was h² = 0.23 and for the time spent in the nest, h² = 0.27 is giving enough power for genetic improvement.
ranging behaviour
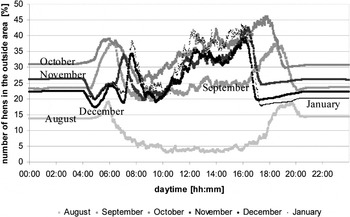
Aside from nesting behaviour, another upcoming trait is the free-range behaviour of layers. Statistical analysis of the ‘Statistische Bundesamt Deutschland’ from 2009, show that the number of laying hens housed in free-range systems has had an annual rise of more than 10%, i.e. from 4.2 m birds in 2004 to 6.5 m in 2008. Although hens do have access to a free-range area in such housing systems, only a few hens actually use this range (Harlander-Matauschek et al., Reference HARLANDER-MATAUSCHEK, FELSENSTEIN, NIEBUHR and TROXLER2006; Icken et al., Reference ICKEN, CAVERO, SCHMUTZ, THURNER, WENDL and PREISINGER2008b). According to Icken et al. (Reference ICKEN, CAVERO, SCHMUTZ, THURNER, WENDL and PREISINGER2008b), 16% of the hens did not use the winter garden at all. These hens were not even registered once at one of the four EPH throughout the whole observation period. During a six month observation, the percentage of hens that used the covered outside area at least once per month, increased up to 78% of the tested layers. According to Hegelund et al. (Reference HEGELUND, SOERENSEN, KJAER and KRISTENSEN2005), who estimated correlations between weather conditions and utilisation of the outside area, a reduction of the share during winter was expected for this study, but not confirmed. Based on these results, age and familiarisation of the hens with the environment seem to have a higher influence on the hen's ranging behaviour. At the start of the observation period, only a few hens risked a passage through the pop hole, but once a layer had been out, she would go to the outside area daily which conforms to an observation of Müller et al. (Reference MÜLLER, HILLIG, VON BORELL and THIES2001). The intra-day distribution of the share of hens in the outside area for each month is illustrated in Figure 4. It shows that a high percentage of hens (up to 30%) stayed outside over-night. The dangers of buzzards or foxes could be excluded in this test, because of the installed fence and plastic roof. With the exception of the first testing month of August, Figure 4 shows a uniform free-range pattern from September to January. After waking up, many of the hens stayed outside. When most of the hens in this study started laying, i.e. three to four hours after lighting began, as according to Icken et al. (Reference ICKEN, THURNER, CAVERO, SCHMUTZ, WENDL and PREISINGER2010), the layers went inside. During the summer months, Bubier and Bradshaw (Reference BUBIER and BRADSHAW1998) observed, similar to this investigation, the highest number of hens in the outside area during the early evening hours.
Intra-day distribution of the percentage of hens in the outside area.

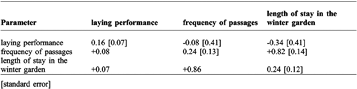
With the aid of EPHs, another flock was analysed by Icken et al. (Reference ICKEN, CAVERO, SCHMUTZ, THURNER, WENDL and PREISINGER2008b) for the time each hen spent in the free-range area as well as the frequency of passages between the barn and outside. In a 12-month observation period, the average length of stay per visit to the winter garden increased from 13 to 32 minutes with ongoing familiarisation. Hens using the winter garden did this an average of 11 times per day. Multiplied by an average stay of 25 minutes per winter garden visit, the overall time spent in the free-range area was around 4.5 hours per hen and day. The authors estimated genetic parameters for these daily and hen-specific recorded ranging data. Additionally, the simultaneous performance testing in FNBs enables an estimation of heritabilities on the egg number of the same hens. In Table 5 are the genetic and phenotypic correlations between the traits; laying performance, frequency of passages and length of stay in the winter garden on the off-diagonal tabled. Heritabilities are diagonally arranged. All genetic parameters have been estimated from the age of 48 weeks onwards. For both free-range traits, the estimated heritabilities are on a medium level with h² = 0.24, and therefore higher than for the laying performance. However, as reported by Nurgiartiningshi et al. (Reference NURGIARTININGSHI, MIELENZ, PREISINGER, SCHMUTZ and SCHÜLER2002) and Savaş (Reference SAVAŞ1998), the estimated heritability of h² = 0.16 for the egg number (Icken et al., Reference ICKEN, CAVERO, SCHMUTZ, THURNER, WENDL and PREISINGER2008b) is an expectedly low level. The genetic correlations were negative between both parameters for the ranging behaviour and the laying performance. Only a slightly negative trend could be found in the correlation between the traits; frequency of passages and laying performance, whereas a strong negative correlation (rg= -0.34) was detected between the traits; length of stay in the winter garden and laying performance. Hens which are often in the free range area seem to stay there quite long and may therefore not return to the nest boxes in the barn for laying. Otherwise it has to be assumed that the laying performance was measured with the Funnel Nest Box, whereas only eggs that were laid in the Funnel Nest Box were registered and the floor eggs were not assigned to the hen. The close genetic correlations between the frequency of passages and the length of stay in the winter garden was expected and validated by the high phenotypic correlations (rg= +0.82 and rp= +0.86). The phenotypic correlations of the ranging behaviour traits with the laying performance were very low. Thus, a connection between the traits appears to be implausible. Based on other studies, no comparable analysis regarding genetic correlations between different ranging behaviour parameters and the laying performance has ever been referred to in literature. Therefore, the results in the paper of Icken et al. (Reference ICKEN, CAVERO, SCHMUTZ, THURNER, WENDL and PREISINGER2008b) seem to be the first information about these traits which is also true for the calculated heritability estimates.
Genetic correlations (above the diagonal), heritability estimates (along the diagonal) and phenotypic correlations (below the diagonal) together with the corresponding standard errors for the traits laying performance, frequency of passages and length of stay in the winter garden.
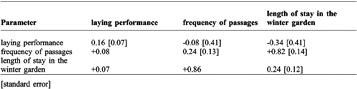
[standard error]
Conclusions
The individual testing of laying performance and behaviour traits in group housing systems is a big advancement for layer breeding companies, allowing them to adjust the genetic potential of future layer strains. By using the newly developed FNB and EPH, it is possible to capture upcoming and therefore new selection traits in sufficient complexity for genetic analysis. Simultaneous data recording of different selection traits in the same environment additionally enables analysis about the interrelationships. This is especially in regard to potentially unfavourable correlations to other selection traits of major importance, for example, the negative genetic correlation between the ranging behaviour and laying performance has to be considered when taking selection decisions. Currently, the biggest advantage of the FNB is the simultaneous data recording of the hen specific egg number and the nest acceptance. Therewith, the breeding company is able to reduce the number of displaced eggs from a genetic point of view. All other new information taken from the FNB and EPH are also worthwhile indicators in terms of new phenotypes for new and adjusted breeding goals in layers.