I. INTRODUCTION
Mn + 1AXn phases, where M is an early transition metal, A is an A-group element, X is either carbon (C) or nitrogen (N), and n = 1–3,Reference Barsoum1 have aroused great interest in the last decade. The MAX phase structure can be described as nanolaminates of strongly bonded M-X layers interleaved with weakly bonded M-A layers. Also, MAX phases possess both metallic and ceramic characteristics, such as high electrical and thermal conductivities but also high thermal stability,Reference Hettinger, Lofland, Finkel, Meehan, Palma, Harrell, Gupta, Ganguly, Raghy and Barsoum2–Reference Hajas, Scholz, Ershov, Hallstedt, Palmquist and Schneider5 and high stiffness.Reference Sun, Li, Ahuja and Schneider6–Reference Radovic, Barsoum, Ganguly, Zhen, Finkel, Kalidindi and Curzio9 Moreover, some MAX phases are oxidation-resistant,Reference Lin, Li, Wang and Zhou10–Reference Hajas, To Baben, Hallstedt, Iskandar, Mayer and Schneider15 due to the formation of a protective layer composed of the oxides of the A-elementReference Lin, Li, Wang and Zhou10, Reference Lee and Nguyen12, Reference Hajas, To Baben, Hallstedt, Iskandar, Mayer and Schneider15 and/or the M-element.Reference Lin, Li, Wang and Zhou13, Reference Barsoum, Tzenov, Procopio, El-Raghy and Ali14 Recently, the oxidation resistance of Cr2AlC coatings has been reported to exhibit a similar activation energy as bulk Cr2AlC and NiAl.Reference Hajas, To Baben, Hallstedt, Iskandar, Mayer and Schneider15 The self-healing ability of MAX phases is currently generating significant interestReference Song, Pei, Sloof, Li, De Hosson and van der Zwaag16 and a model for the oxide/MAX phase interface has recently been communicated.Reference Sigumonrong, Zhang, Zhou, Music, Emmerlich, Mayer and Schneider17
The bonding character of V2AlC (space group P63/mmc) may be described as a mixture of covalent-ionic and, due to the d resonance in the vicinity of the Fermi level, metallic.Reference Schneider, Mertens and Music18 The density of V2AlC is 4.87 g/cm3Reference Etzkorn, Ade and Hillebrecht19 and the lattice parameters are a = 2.91 Å and c = 13.10 Å.Reference Lofland, Hettinger, Harrell, Finkel, Gupta, Barsoum and Hug3, Reference Schneider, Mertens and Music18 Furthermore, bulk modulus values were reported in the range of 152–215 GPa,Reference Hettinger, Lofland, Finkel, Meehan, Palma, Harrell, Gupta, Ganguly, Raghy and Barsoum2, Reference Lofland, Hettinger, Harrell, Finkel, Gupta, Barsoum and Hug3, Reference Sigumonrong, Zhang, Zhou, Music and Schneider20 while the heat conductivity was measured to be of 45 W/mK.2 No significant stability difference between the spin-polarized and the non-spin-polarized configurations of V2AlC were reported in Ref. Reference Schneider, Mertens and Music18.
Bulk V2AlC can be fabricated by reactive hot isostatic pressing (HIP)Reference Gupta and Barsoum21 and reactive hot pressing (HP)Reference Bowman, Wallace, Yarnell, Wenzel and Storms22 at ≥1000 °C using V, Al, and C elemental powders as starting materials. During heating, Al reacts with V forming Al3V and Al8V5 at temperatures ≤700 °C.Reference Bowman, Wallace, Yarnell, Wenzel and Storms22 Upon increasing the temperature further, the amount of Al8V5 increased by a reaction between Al3V and V.Reference Bowman, Wallace, Yarnell, Wenzel and Storms22 V2AlC was detected at 1000 °C and VC was found at 1200 °C. The amount of these two phases increased at the expense of C and Al8V5. V2AlC was obtained as the main phase at 1400 °C with VC and V4AlC3 present as impurity phases.Reference Bowman, Wallace, Yarnell, Wenzel and Storms22 V2AlC can also be obtained by thin film synthesis, e.g., by DC magnetron sputtering using a MAX phase targetReference Gebhardt, Hajas, Scholz, Hallstedt, Cappi, Song, Telle and Schneider23 and elemental V, Al, and C targetsReference Schneider, Mertens and Music18, Reference Sigumonrong, Zhang, Zhou, Music and Schneider20 at substantially lower formation temperatures as compared with bulk synthesis. Based on Ref. Reference Sigumonrong, Zhang, Zhou, Music and Schneider20, the formation of Al3V and Al8V5 intermetallic phases was observed at 550 °C, while at 650 °C the formation of V2AlC and V2C was reported.Reference Sigumonrong, Zhang, Zhou, Music and Schneider20 Hence, during vapor phase synthesis of V2AlC transition metal carbides have been reported as intermediate phases before the MAX phase is formed. It is worth noting that processing during bulk synthesis, e.g., HIP or HP, is generally closer to thermodynamic equilibrium than vapor phase condensation. During thin film deposition kinetically limited processes may cause the formation of metastable phases, whereas substrate heating and/or energetic particle bombardment may reduce kinetic constraints,Reference Eklund, Beckers, Jansson, Högberg and Hultman24 and thereby significantly influence the structure evolution.Reference Petrov, Barna, Hultman and Greene25 As a consequence of this, magnetron sputtering permits the synthesis of phase-pure transition phases to study the phase formation of MAX phases, not in a phase mixture as during bulk processing, but in a controlled annealing experiment with a phase-pure and hence, well-defined starting material. Recently, this approach has been used to study the crystallization kinetics of x-ray amorphous V2AlC powder that was synthesized by magnetron sputtering. It was shown that V2AlC could be formed at around 600 °C from the amorphous phase. The activation energy for this reaction was measured to be 308 kJ/mol.Reference Abdulkadhim, To Baben, Schnabel, Hans, Thieme, Polzer, Polcik and Schneider26
In this work, V–Al–C thin films were deposited on α-Al2O3 $(11\mathop 2\limits^ - 0)$wafers by DC magnetron sputtering using a powder metallurgical composite target with 2:1:1 MAX phase stoichiometry in an industrial deposition chamber. Postannealing was carried out in argon (Ar) for 1 h at temperatures ranging from 550 to 850 °C. XRD, TEM, and ab initio data were used to characterize the thermal stability and the phases formed.
II. EXPERIMENT
A. V–Al–C thin film deposition
The depositions of V–Al–C thin films were carried out by using DC magnetron sputtering in an industrial chamber (CC800/8, CemeCon AG, Wuerselen, Germany). A powder metallurgical composite target was used in this instance with a size of 500 × 88 × 10 mm3 (provided by Plansee Composite Materials GmbH, Lechbruck am See, Germany) and a MAX phase stoichiometry of V:Al:C = 2:1:1. Al, V, and VC powders were used for the target production. One-side polished single crystal α-Al2O3 $(11\mathop 2\limits^ - 0)$ wafers (10 × 10 × 0.53 mm3) were used as substrates, which were ultrasonically cleaned in methanol and acetone prior to deposition. The substrate orientation was chosen based on previous work showing local epitaxy between deposited V2AlC and Al2O3
 $(11\mathop 2\limits^ - 0)$.Reference Sigumonrong, Zhang, Zhou, Music, Emmerlich, Mayer and Schneider17 Fixed on stainless steel plates with a distance of 40 mm facing the sputter target, more than 40 wafers can be deposited in one processing batch. The base pressure was 4 mPa. Sputtering was carried out in Ar at 338 mPa with a target power density of 9 W/cm2, resulting in a deposition rate of approximately 3.8 nm/s. During deposition, the substrate temperature was controlled to be approximately 500 °C.
B. Annealing treatment
For assessing the thermal stability of the V–Al–C thin films, isothermal annealing experiments in 1 atm of Ar (purity 99.999%), at temperatures of 550, 650, 750, and 850 °C measured at the backside of the substrate were carried out for 1 h. The heating and cooling rates were 400 °C/h.
C. Characterization
After deposition and subsequent to each annealing experiment, phase analysis by x-ray diffraction (XRD) was performed. A Bruker AXS D8 Discover General Area Detector Diffraction System (GADDS; Bruker AXS GmbH, Karlsruhe, Germany) in a grazing incidence configuration was used using Cu Kα radiation. The voltage and current were set as 40 kV and 40 mA, respectively. The substrate tilting angles were varied for XRD measurement and the incidence angle was chosen to be one half of the 2θ angle of the expected diffraction planes. Pole figures were mapped by using the Schulz reflection method.Reference Schulz27 Energy-dispersive x-ray spectroscopy (EDX) with an EDAX Genesis 2000 detector attached to a scanning electron microscope JEOL JSM-6480 (JEOL, Tokyo, Japan) was used to quantify the film composition. The electron beam penetration depth was approximately 1 μm. A V–Al–C sample, quantified withwave length-dispersive x-ray spectroscopy (WDS), was used as a standard reference for EDX measurement. Field emission scanning electron microscopy (FESEM) using a JAMP-9500 F (JEOL, Tokyo, Japan) was applied to reveal the films cross-sectional morphology. Cross-sectional TEM samples of the as-deposited film and the sample annealed at 650 °C were prepared using a focused ion beam (FIB) workstation FEI Strata FIB 205. All the TEM investigations presented in this paper were performed on a 200 kV field emission gun TEM FEI Tecnai F20 ST (FEI Company, Hillsboro, OR) equipped with EDX analysis, an energy filter GATAN GIF 2000 (Gatan, Inc., Tokyo, Japan) and a Fishione high-angle annular dark-field imaging (HAADF)-Detector. The phase analysis from selected area electron diffraction (SAED) patterns was done using DifftoolsReference Mitchell28 and the JEMS software.Reference Stadelmann29
D. Ab initio calculations
For the calculation of total energy and energy of formation of the phases proposed in this article, density functional theory (DFT)Reference Kohn and Sham30 was used as implemented in the Vienna ab initio simulation package (VASP). The following parameters were used: Generalized gradient approximations-based projector augmented wave potentials,Reference Kresse and Joubert31 reciprocal-space integration with a Monkhorst–Pack scheme,Reference Monkhorst and Pack32 the tetrahedron method with Blöchl corrections for the total energy,Reference Blöchl33 0.01 meV electronic relaxation convergence, and energy cutoff of 500 eV. The k-points grid was tested for convergence and a grid of 5 × 5 × 3 was chosen. All structures were relaxed with respect to the atomic positions, lattice parameter a and hexagonal aspect ratio c/a. The unit cells were constructed using special quasirandom structures (SQS)Reference Zunger34 as described in Sec. III in detail. For this, the Warren–Cowley short-range-order parameterReference Cowley35 within three coordination shells was used to account for randomness in the nonmetal sublattice as implemented in the locally self-consistent Green’s function software package.Reference Abrikosov, Niklasson, Simak, Johansson, Ruban and Skriver36, Reference Abrikosov, Simak, Johansson, Ruban and Skriver37 The energy of formation Ef was calculated by the following formula:
 $$E_f \, = \,{1 \over {\sum {n_i } }}\left( {E_{tot} - \sum {n_i \cdot E_i } } \right),$$
where Etot is the total energy of the compound, ni is the number of atoms of species i in the compound, and Ei is the energy of the species in its reference state. Bcc-V, fcc-Al, and diamond were used as references for V, Al, and C, respectively.
III. RESULTS AND DISCUSSION
A. As-deposited V–Al–C thin films
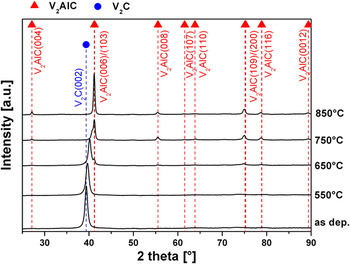
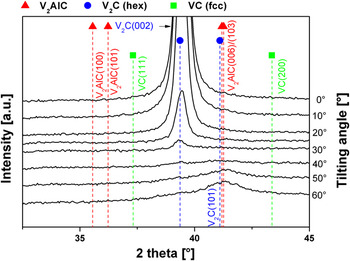
The chemical composition of the as-deposited films measured by EDX is V1.8AlC, close to the sputter target composition. The diffractograms of the as-deposited film obtained with the incidence angle of 20° are shown in Fig. 1. A single peak at 39.39° is indexed as hexagonal β-V2C(0002). By tilting the sample by 60°, another peak at 41.22° (Fig. 2) is identified as β-V2C $(10\mathop 1\limits^ - 1)$. As no other diffraction signals are observed, the as-deposited film appears to exhibit the β-V2C crystal structure. The structure is based on a hexagonal close-packed metal lattice, with C atoms randomly on octahedral interstitial sites.Reference Bowman, Wallace, Yarnell, Wenzel and Storms22 The formation of a solid solution with aluminum replacing vanadium and smaller carbon concentration in β-V2C structure, namely (V,Al)2Cx, has been reported before.Reference Abdulkadhim, To Baben, Schnabel, Hans, Thieme, Polzer, Polcik and Schneider26 The lattice parameters derived from XRD are c = 4.54 Å and a = 2.89 Å. It is worth noticing that β-V2C belongs to the same space group (P63/mmc) as V2AlC.
XRD patterns of the as-deposited film and the annealed films.

XRD patterns of the as-deposited film using sample tilting.

The orientation relationship between the as-deposited film and the substrate is characterized by pole figures. The (V,Al)2Cx(0002) pole figure [Fig. 3(a)] reveals a basal plane orientation parallel to Al2O3 $(11\mathop 2\limits^ - 0)$ substrate surface. (V,Al)2Cx
 $(10\mathop 1\limits^ - 1)$ pole figure [Fig. 3(b)] illustrates 6-fold symmetry along the rotation angle (ϕ). The tilting angle (Ψ) between
 $(10\mathop 1\limits^ - 1)$ and (0002) plane is 60°. The rotation and tilting of the grains are within approximately ±5°, indicating a slight misorientation of the films <000l> axis with the substrate surface normal as well as a misorientation between the adjacent film grains. The (V,Al)2Cx(0002) and
 $(10\mathop 1\limits^ - 1)$ pole figures obtained herein match well with the simulated one [Fig. 3(c)]. By mapping the pole figures of the substrate and the film simultaneously, the in-plane orientation relationship is determined to be (V,Al)2Cx(0002)//Al2O3
 $(11\mathop 2\limits^ - 0)$ and (V,Al)2Cx
 $[\mathop 1\limits^ - \mathop 1\limits^ - 20]$//Al2O3
 $[\mathop 1\limits^ - 100]$.
Measured pole figures of the as-deposited film on (a) hexagonal (V,Al)2Cx(0002) plane, (b)  $(10\mathop 1\limits^ - 1)$plane, and (c) simulated pole figure.

The cross sectional TEM micrograph of the as-deposited film is shown in Fig. 4(a), indicating the development of a columnar growth structure after initial deposition of a uniform interface layer with a thickness of 30–50 nm. The column width is in the range of 30–50 nm. The composite SAED pattern [Fig. 4(b)] taken from the marked region in Fig. 4(a) confirms the orientation relation between (V,Al)2Cx and Al2O3: (V,Al)2Cx(0002)//Al2O3 $(11\mathop 2\limits^ - 0)$, (V,Al)2Cx
 $[\mathop 1\limits^ - \mathop 1\limits^ - 20]$//Al2O3
 $[\mathop 1\limits^ - 100]$. The arced reflection streaks in the SAED patterns in Fig. 4(b) are typically observed in highly textured films, indicating that the orientation of the texture axis <000l> and the interface to the substrate are not exactly perpendicular and show some transversal variation.Reference Tang and Laughlin38 From the combination of XRD and TEM data, it is clear that the as-deposited film is growing highly textured on Al2O3
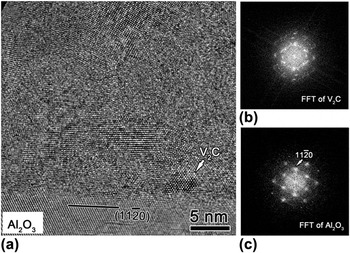
 $(11\mathop 2\limits^ - 0)$. High Resolution TEM (HRTEM) combined with Fast Fourier Transformation (FFT) (Fig. 5) provides evidence for local epitaxial film growth. However, limited by the small size of the epitaxial region, it is impossible to index the orientation relationship at the interface. It is reasonable to assume that the basal plane (000l) texture evolves due to surface energy minimization during growth,Reference Ohring39 indicating sufficient mobility at these growth conditions to overcome kinetically limited growth.
(a) Cross section image and (b) SAED pattern of the as-deposited film and the Al2O3 substrate. The inserted part is the enlarged region of the enclosed diffraction pattern indicating (V,Al)2Cx(0002)//Al2O3 $(11\mathop 2\limits^ - 0)$.

(a) High resolution TEM (b) with FFT patterns of (V,Al)2Cx, and (c) substrate Al2O3 detected at the interface.

Energy-filtered transmission electron microscopy (EFTEM) elemental mapping as well as scanning transmission electron microscopy high-angle annular dark field imaging (STEM-HAADF) data indicates no segregation at the grain boundaries. Considering that the atomic radii of Al and V differ by 6.9% as compared with a size difference of 85.5% between Al and C, it is reasonable to assume that Al is populating V lattice sites, forming a solid solution. Ab initio calculations were performed to compare this solid solution proposal with the experimentally obtained lattice parameters. A 2 × 2 × 6 hexagonal close-packed metal lattice supercell was constructed containing 32 V and 16 Al atoms which were distributed randomly using SQS.Reference Bowman, Wallace, Yarnell, Wenzel and Storms22 On the 48 interstitial sites, which form a simple hexagonal sublattice, 16 C atoms were distributed randomly by considering SQS cells containing C and vacancies. As there are C–C repulsive interactions if two C atoms are located in interstitial positions adjacent to each other along the c-axis,Reference Cottrell40 ad hoc rearrangements on the nonmetal sublattice was performed to avoid this. The obtained lattice parameters a and c are 2.848 and 4.606 Å, respectively. This is in good agreement with the measured lattice parameters showing only a −1.5% deviation in a and +1.4% in c, respectively. The energy of formation Ef (V,Al)2Cx is −0.180 eV/atom indicating that the formation of (V,Al)2Cx is energetically favorable assuming V, Al, and C as reactants. In the following text, the as-deposited film will be denoted as hexagonal (V,Al)2Cx. For comparison, a 2 × 2 × 2 supercell of V2AlC containing the same number of atoms as in solid solution (V,Al)2Cx was also calculated and an energy of formation Ef MAX of −0.498 eV/atom was obtained, resulting in a driving force for V2AlC formation from (V,Al)2Cx of 30.6 kJ/mol.
The presence of the transition reaction products V2C and cubic (Ti,Al)C solid solution were also reported in the synthesis of V2AlC,Reference Sigumonrong, Zhang, Zhou, Music and Schneider20, Reference Abdulkadhim, To Baben, Schnabel, Hans, Thieme, Polzer, Polcik and Schneider26 V2GeC,Reference Wilhelmsson, Eklund, Högberg, Hultman and Jansson41 and Ti2AlCReference Wilhelmsson, Palmquist, Lewin, Emmerlich, Eklund, Persson, Högberg, Li, Ahuja, Eriksson, Hultman and Jansson42 MAX phases, respectively. The formation of the solid solution is attributed to kinetic limitations active during low temperature growth.Reference Wilhelmsson, Palmquist, Lewin, Emmerlich, Eklund, Persson, Högberg, Li, Ahuja, Eriksson, Hultman and Jansson42
B. Annealing
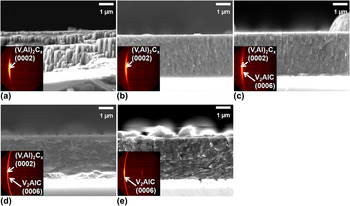
To evaluate the thermal stability of the as-deposited (V,Al)2Cx, samples were annealed in Ar in the temperature range of 550–850 °C. The chemical composition of the annealed films is V1.8AlC, identical to the as-deposited film. The microstructure evolution of the as-deposited (V,Al)2Cx and the films annealed between 550 and 850 °C are shown in the FESEM micrographs in Figs. 6(a)–6(e). The pronounced columnar structure of the as-deposited film [Fig. 6(a)] disappears upon annealing, as can be seen in Figs. 6(b) and 6(c). Meanwhile, a layered morphology was observed for the film annealed at 750 °C as shown in Fig. 6(d). The thickness of the layers is increased as the annealing temperature is increased. The inserts in Fig. 6 show XRD ring segments of the corresponding samples, the integrated intensities are shown in Fig. 1. It can be learned that as the temperature is increased, the basal plane texture of (V,Al)2Cx is maintained during annealing. The (V,Al)2Cx (0002) peak shifts toward higher 2θ angles. Concurrently, the V2AlC phase forms at ≥650 °C, and phase-pure V2AlC is obtained by annealing for 1 h at 850 °C. Therefore, the layered morphology could be related to the formation of V2AlC. The amount of V2AlC increases at the expense of (V,Al)2Cx.
Morphologies at cleaved cross sections of the (a) as-deposited and annealed films at (b) 550 °C, (c) 650 °C, (d) 750 °C, and (e) 850 °C. The inserts show XRD ring segments of the corresponding samples; the integrated intensities are shown in Fig. 1.

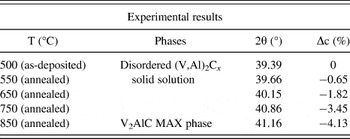
The annealing temperature-induced changes in (V,Al)2Cx c lattice parameter were determined based on the position of the (000l) peaks and are listed in Table I. The calculated changes relative to the as-deposited film in c lattice parameter were −0.65% and −3.45% for the annealing temperatures of 550 and 750 °C, respectively. For comparison, the c lattice parameter of V2AlC formed in this instance during annealing is with 0.30% larger and 0.38% smaller than previously reported theoretical and experimental data,Reference Schneider, Mertens and Music18 respectively. However, the V2AlC formed in this instance during annealing exhibits a 4.13% smaller c lattice parameter than the value of 3 × c of the as-deposited (V,Al)2Cx. Hence, we observe significant shrinkage in c lattice parameter of (V,Al)2Cx during annealing.
Measured c lattice parameter change with increased annealing temperature.

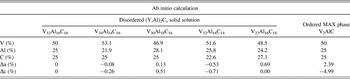
Ab initio calculations were carried out to evaluate the effect of compositional variations on the equilibrium volume and hence, lattice parameters. The following scenarios were addressed: both changes in composition on the metal sublattice and on the nonmetal sublattice were investigated, the former by combination of a 2 × 2 × 6 SQS hexagonal close-packed metal lattice supercell containing 34 (30) V and 14 (18) Al atoms with 16 randomly distributed carbon atoms and 32 vacancies as described in Sec. I, the latter by combination of the metal sublattice with 32 V atoms and 16 Al atoms as described in Sec. I of the results with a nonmetal sublattice with 14 (18) carbon atoms and 34 (30) vacancies randomly distributed as specified above. The chemical composition of the supercells as well as the change in lattice parameters ∆a and ∆c compared with the calculated values for (V,Al)2Cx described in Sec. I are given in Table II. It can be seen that increasing V to 53.1 at.% at the expense of Al results in a change in c lattice parameter of −0.26%, which is much smaller than the change of −3.45% observed after annealing at 750 °C. Similar argument may be done for all the other chemical changes investigated, e.g., increasing Al to 28.1% or C to 27.3%, or decreasing C to 22.6% leading to a change in c lattice parameter of 0.51%, 0.00%, and −0.71%, respectively. Hence, the change in lattice parameter c observed experimentally cannot be explained by change in chemical composition.
Ab initio calculations of the lattice parameters of disordered (V,Al)2Cx solid solution with varied chemical compositions and ordered V2AlC MAX phase.

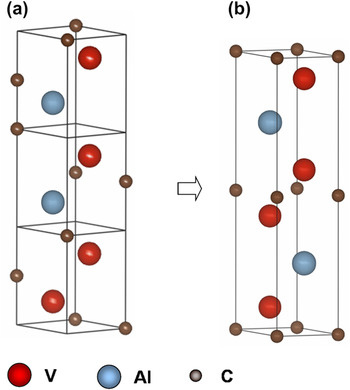
Interestingly, from a crystal structure point of view, it is evident that the V2AlC unit cell [Fig. 7(b)] can be constructed from three ordered (V,Al)2Cx super cells [Fig. 7(a)], where ordering on the metal sublattice leads to metal layers with a stacking sequence V-V-Al-V-V-Al and ordering on the nonmetal sublattice with layers of carbon and vacancies in a stacking sequence C-vac-vac-C-vac-vac results in the formation of V2AlC with a stacking sequence of V-C-V-Al-V-C-V-Al.
Crystal structures of (a) disordered (V,Al)2Cx and (b) ordered V2AlC MAX phase.

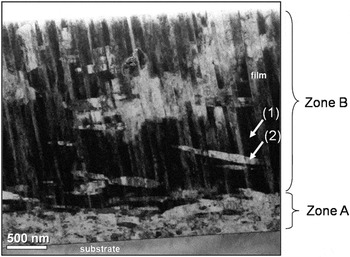
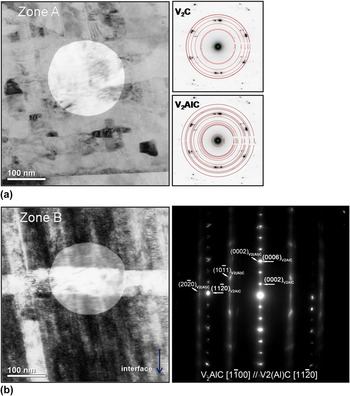
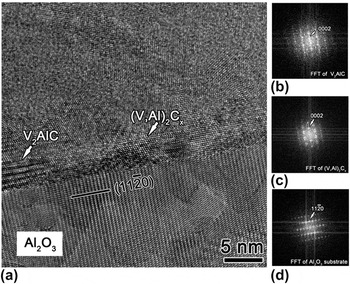
To evaluate whether atomic ordering leads to a change in lattice parameters, two partially ordered configurations were investigated by ab initio calculations and compared with the disordered solid solutions: one where the metal sublattice was ordered with a stacking sequence V-V-Al-V-V-Al combined with the disordered nonmetal sublattice used in Sec. I of the results; another where the disordered metal sublattice configuration from Sec. I of the results was combined with ordered nonmetal sublattice with a stacking sequence C-vac-vac-C-vac-vac. The calculated lattice parameters are listed in Table III. The c lattice parameter decreases by 1.95% and 2.75% due to ordering on the metal sublattice and the nonmetal sublattice, respectively. Therefore, ordering on either metal or nonmetal sublattices or a combination thereof could be responsible for the change in lattice parameter observed experimentally, where complete ordering of (V,Al)2Cx would lead to the formation of V2AlC. Hence, V2AlC may, in addition to nucleation and growth, also be formed by ordering. While we do not observe conclusive evidence for V2AlC formation by complete ordering, we do present evidence for temperature-induced ordering of as-deposited (V,Al)2Cx by XRD and ab initio data. TEM investigations were carried out on a sample annealed at 650 °C, where the formation of V2AlC was observed by XRD, see Fig. 1. A bright-field image of the film cross section is shown in Fig. 8, where two regions can be distinguished: Zone A, close to the interface with a thickness of 300–500 nm as well as Zone B, the remaining thin film. The bright field images and SAED patterns of Zone A and Zone B are shown in Figs. 9(a) and 9(b), respectively. The results indicate that Zone A exhibits more randomly oriented (V,Al)2Cx and V2AlC. HRTEM combined with FFT measured some nanometers above the interface within Zone A was performed to understand this growth behavior. Two regions with different stacking structures were marked with arrows in Fig. 10(a). The stacking structure of the left region marked in Fig. 10(a) appears to match quite well with 211-MAX phase.Reference Sigumonrong, Zhang, Zhou, Music, Emmerlich, Mayer and Schneider17 The FFT of this region is shown in Fig. 10(b). The right region marked in Fig. 10(a) with its FFT shown in Fig. 10(c) appears to be (V,Al)2Cx. The basal planes of both V2AlC and (V,Al)2Cx investigated in Fig. 10(a) are parallel to the substrate surface Al2O3 $(11\mathop 2\limits^ - 0)$, shown in Fig. 10(d). In addition, local epitaxy was observed at the interface, where the substrate contacts both phases, V2AlC and (V,Al)2Cx, respectively. It is also seen in Fig. 10(a) that the film grows in different orientations starting out 5 nm above the interface. This could be understood as the growth accommodation of the film due to substrate–film lattice mismatch. In addition, impurities such as residual oxygen, and/or waterReference Schneider, Hjoervarsson, Wang and Hultman43 in the industrial deposition chamber may also be relevant. Hence, the presence of low intensity V2AlC (110), (109), and (116) peaks in Fig. 1 may be a consequence of random nucleation and growth of V2AlC in this region. Zone B with a thickness of approximately 2.5 μm is characterized by two morphologies, columnar and transverse indicated by arrows (1) and (2) in Fig. 8, respectively. The bright-field image as well as the SAED pattern of the two combined morphologies in Zone B shown in Fig. 9(b) indicate the presence of (V,Al)2Cx and V2AlC. The (V,Al)2Cx pattern is very similar to the pattern observed for the as-deposited film, shown in Fig. 4. Laterally grown grains intersect several (V,Al)2Cx columnar grains and grain boundaries and correspond to V2AlC. This is consistent with the layered morphology observed after annealing to 750 and 850 °C shown in Figs. 6(d) and 6(e). The characteristic orientation relationship between the two phases in Zone B is determined as (V,Al)2Cx(0002)//V2AlC(0006) from four randomly chosen regions. The in-plane orientation between the two phases based on Fig. 9(b) is indexed to be (V,Al)2Cx
 $[11\mathop 2\limits^ - 0]$ //V2AlC
 $[1\mathop 1\limits^ - 00]$ indicating a 30° rotation of the crystallographic orientation of these two phases around the c-axis. This indicates that V2AlC is formed by nucleation and growth. Whether complete ordering results in V2AlC formation is unclear at this point, however evidence for temperature-induced ordering was presented.
Bright-field image of film annealed at 650 °C.

Bright-field images and composite SAED patterns of (a) Zone A and (b) Zone B.

(a) HRTEM at the interface, (b) FFT of V2AlC marked in (a), (c) FFT of (V,Al)2Cx marked in (a), and (d) FFT of the substrate.

Ab initio calculations of the lattice parameters of disordered, ordered metal sublattice, ordered nonmetal sublattice (V,Al)2Cx solid solutions, as well as ordered V2AlC MAX phase.

IV. CONCLUSIONS
V–Al–C thin films were deposited on Al2O3 $(11\mathop 2\limits^ - 0)$ substrates at 500 °C by DC magnetron sputtering using a powder metallurgical composite target with 2:1:1 MAX phase stoichiometry composition. TEM and XRD data suggest that a hexagonal Al-containing vanadium carbide solid solution was formed with a strong basal plane texture. The lattice parameter of the hexagonal solid solution (V,Al)2Cx was dependent on the annealing temperature: the c lattice parameter decreased by 3.45% after annealing for 1 h at 750 °C compared with the as-deposited film. Based on ab initio data, we suggest that this significant lattice shrinkage is a consequence of atomic ordering. Meanwhile, the formation of V2AlC was observed at 650 °C and phase-pure V2AlC was obtained at 850 °C. TEM images support the notion of V2AlC formation by nucleation and growth.
ACKNOWLEDGMENTS
The financial support by Deutsche Forschungsgemeinschaft (DFG) for project SCHN 735/18-1 is gratefully acknowledged. The authors would also like to thank Daesung Park for discussing the TEM images.