INTRODUCTION
For the successful radiotherapy treatment delivery, accurate positioning of patient on a day-to-day basis on the treatment couch at the predetermined treatment position is of utmost importance. Volumetric imaging is perhaps the best tool among the several imaging modalities that are available to the radiation oncology team members to achieve this goal. Cone-beam computed tomography (CBCT) is a major improvement in patient’s daily setup verification.Reference Sykes, Lindsay, Dean, Brettle, Magee and Thwaites 1 This is known as image-guided radiotherapy (IGRT)Reference McBain, Henry and Sykes 2 as patient position is verified using imaging before the actual treatment on treatment couch. In the era before CBCT, orthogonal megavoltage (MV) [two dimensional (2D)] images were acquired with the help of an electronic portal imaging device (EPID).Reference Herman, Balter and Jaffray 3 These images were matched with digitally reconstructed radiographs generated from the treatment planning system (TPS) on a reference computed tomography (CT). This leads to online correction in the setup. The orthogonal images used to match the treatment fields were generally matched to bony landmarks. This had a drawback in the sense that matching of low-contrast tissues was not possible when treating such tissues itself. In CBCT, kilovoltage (KV) X-rays give good soft tissue contrast and resolution for visualisation at the cost of negligible imaging doses to the patient and other organs at risk.Reference Islam, Purdie and Norrlinger 4 – Reference Hyer, Serago, Kim, Li and Hintenlang 6
However, CBCT images do not have the same quality as dedicated CT images because cone beam have more phantom scatter components when compared with a fan beam. One advantage of CBCT images is the ability to match the planning target volume (PTV) and bladder filling volumetrically in low-contrast tissues for each fraction using the actual CT dataset.
In addition, CBCT provides us with information on the impact of weight loss or tumour shrinkage during the course of treatment. Based on this information judgement of adaptive CT scanning can be made.Reference Ding, Duggan and Coffey 7 When a KV X-ray source is mounted on the treatment unit the geometric centre of the both units must coincide otherwise the deviation between these centres will lead to an erroneous setup of the patient. This deviation can become part of a setup error which can be correctable and uncorrectable.
With full rotation, CBCT images can be taken within 1–3 minutes and shifts (translational and rotational) generated after rigid registration between reference CT scan and CBCT. Linear accelerator is also equipped with an EPID as well as CBCT for on board imaging attached with the gantry, perpendicular to the treatment head. Cone-beam radiation generating source is different from the MV radiation source which leads a range of errors that can occur during patient setup.
Correctable errors are systematic errors that can be corrected by periodic quality assurance (QA) of the CBCT for 3D low-contrast visibility, 3D uniformity, 3D spatial resolution and 3D scaling.Reference Bissonnette, Moseley and Jaffray 8 , Reference Yoo, Kim and Hammoud 9 Uncorrectable errors cannot be corrected because these errors are due to inherent uncertainty. The variation in repeated measurements by CBCT depends upon the inherent uncertainty associated with the software and hardware, which needs to be calculated although these uncertainties are taken into consideration during planning of the clinical target volume (CTV) to PTV margin determination. The accuracy of CBCT imaging registration software with the actual CT dataset also leads to some inherent errors which need to be calculated. The significance of our study is to point out margins due to this inherent error. Determination of the translational shifts as well as the rotational shifts (6Ds) and the reproducibility is an important QA tool which explains the inherent uncertainty associated with such a volumetric imaging tools in determining the positional shifts.
MATERIAL AND METHODS
The study was performed on the X-ray volumetric imaging (XVI; version 4.5, Elekta AB, Stockholm, Sweden) which was CBCT integrated with the Elekta AxesseTM linear accelerator machine having six degree of freedom enabled HexaPOD couch and KV X-rays source (70–150 kVp) with a flat panel, amorphous silicon/caesium iodide detector.
QUASARTM Penta-Guide Phantom
Penta-Guide phantom (Modus Medical Devices, London, ON, Canada) was used to determine the inherent uncertainty in the shift determination for our study. The phantom was also used for daily QA of KV and MV isocentre coincidence in our department.Reference Sykes, Lindsay, Dean, Brettle, Magee and Thwaites 1 Each face of the Penta-Guide phantom was named and considered as a patient with head towards the gantry and lying in supine position. Considering this orientation, the phantom left was positive x, phantom superior (towards gantry) was positive y, phantom anterior (upwards) was positive z, for image matching and soft tissue differentiation between air and tissue the phantom was embedded with different diameters air-filled spheres and rings. The geometrical location of the spheres and the rings were such that both structures were properly visible in X-rays (KV and MV) and projectional image of sphere was fully overlapped with the corresponding projectional image of the rings in anterior and lateral projections. The rings and air-filled spheres were designed in such a way that both were properly visible. Air-filled spheres were used to provide enough soft tissue contrast. Placement of rings was such that at 100 cm source to axis distance (SAD) rings were aligned with spheres on anterior–posterior and right–left at projection. Out of five spheres one sphere was at the centre of the phantom which coordinate location was (0, 0, 0) cm. Two others spheres were superior to the isocentre at locations (−1·0, 3·0, 2·0) and (−2·0, 6·0, 4·0) cm, respectively, and remaining two spheres were inferior to the isocentre at (0·0, −3·0, 0·0) and (0·0, −6·0, 0·0) cm, respectively. Diameter of the central sphere was 1·2 cm and all remaining spheres were of same diameter 0·8 cm each. Size of rings and spheres were chosen in such a way that it gave appropriate contrast at the time of image matching with reference CT images.
The phantom was a cube of 16 cm thus 10 cm×10 cm field size at the surface of the phantom will appear as 9·2 cm×9·2 cm after demagnification factor of 92/100 for 100 cm SAD. Demagnified field sizes were marked by white marker. Cross hairs and bulls-eye rings were marked by black marker which was not magnified. There were total five bulls-eye rings at the centre of each faces of cube having different diameter of 2, 4, 6, 8, 10 mm and were used for setting phantom with help of laser.
Image acquisition and matching
The phantom was scanned at 2 mm slice thickness in the 16-slice CT scanner (Light Speed; Philips Medical Systems, Amsterdam, The Netherlands) and a reference image dataset (phantom body) were created in CMS XIO (V5·00·01·1) (CMS Elekta, Sunnyvale, CA, USA) TPS. A static 6 MV photon beam (any setup beam can be used) was placed on the phantom so that digital imaging and communications in medicine (DICOM) export and DICOM import were possible between TPS and XVI. The beam isocentre and the centre of the phantom both were same. The plan was imported in XVI workstation named as study and fast head and neck scanning protocol was taken for this study where gantry starts from 320° and end with 160° in clock wise direction. Each sites of patient had different tissue depth and different scanning length thus required different field of view (FOV) and also different imaging length. For opening different FOV, KV source contained different types of collimator and filter combination which were kept in a cassette and the cassettes contained two slots, one for collimator and other for filter.
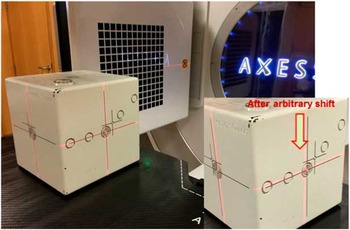
Cassettes name were based on the imaging FOV size as [small (S), medium (M), and large (L)]. Small ‘S’ collimator had 27·68×27·68 cm FOV, medium ‘M’ collimator had 42·64×42·64 cm FOV and large ‘L’ collimator had 52·40×52·40 cm FOV. Along with different FOV (S, M or L) the collimator were additionally labelled as (2, 10, 20, 15 and 15×15) for different axial field imaging length (along digital accelerator G–T axis), where label 2 denotes 35·16 mm (for medium FOV), 36·46 mm (for large FOV), label 10 denotes 135·42 mm (for small FOV), 135·42 mm (for medium FOV) and 143·23 mm (for large FOV), label 20 denotes 276·7 mm, label 15 denotes 178·5 mm (for medium FOV) and label 15×15 denotes 150·0 mm nominal irradiation length at isocentre. Except of collimator use, there was use of two filters, one was that imaging were done without any additional filtration (denoted as F0) and second one with the addition of a bowtie filter (Elekta, Crawley, UK) (denoted as F1), For our study, we had taken smaller FOV collimator (S20) labelled as 20 and no additional filter (F0 filter used). The phantom was placed on the treatment couch and aligned near machine isocentre (within 2 cm radius) using the treatment room lasers shown in Figure 1. Then the phantom was imaged using XVI and the CBCT image was matched with the reference image using the XVI software. In total, 196 projections were acquired in 200° gantry rotation, 100 kilo voltage potential (kVp) and 19·6 milliampere-second (mAs) during the process of image acquisition of Penta-Guide phantom. Reconstruction matrix size was 512×512, 16 bits, and image resolution was 0·518 mm/pixel.
Image acquisition of Penta-Guide phantom with Elekta AxesseTM linear accelerator.

Reconstruction algorithm used by XVI in this procedure was Feldkamp–Davis–Kress.Reference Feldkamp, Davis and Kress 10 The automatic image registration method was used for the image registration between acquired XVI dataset and actual CT dataset to avoid the errors introduced due to human interference. For air and tissue interference grey value (T+R) method was used for better image contrast matching between acquired and reference dataset. No slice averaging was used for reducing the uncertainty due to slice averaging as per our institutional protocol. The display mode on screen was used as green–purple, where green indicated perfectly matched area and purple indicated mismatched area between reference and acquired image dataset. The translational and rotational shifts were noted in all 6D and the method was repeated for 20 times a single day without moving the phantom till 30 consecutive working days.
Error evolution technique
The mean shifts and their standard deviations for all the 6D were determined for all the 20 instances of imaging. In an ideal situation the shifts shall remain the same in all 20 instances for all 6D for a particular day as the phantom was not moved in between and the standard deviation shall be zero for all these shifts. However, this was not the case to be and differences were observed. For any given day, the first set of shifts obtained was kept as reference and the deviations of the subsequent 19 sets from the reference set were scored. Mean differences and their standard deviations were determined. In this way, data were obtained for 30 consecutive working days.
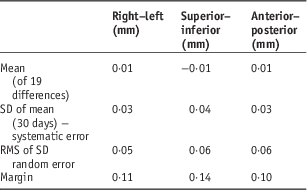
Van Herk formula was used for determining the influence of this uncertainty to PTV margin.Reference Van Herk 11 The formula contained two parts, one for systematic error and second for random error. The systematic and random errors were calculated only for translational shifts, rotational shifts were not incorporated into van Herk formula for margins calculation.
 $${\rm Margin}{\equals}((2\!\cdot\!5{\times}{\rm SD}\,(\Sigma )){\plus}(0\!\cdot\!7{\times}{\rm RMS}\,(\sigma )))$$
where SD (Σ) is standard deviation of the mean for 30 days readings and RMS (σ) the root mean square of the standard deviation of these mean readings.
RESULTS
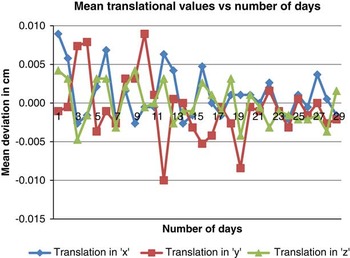
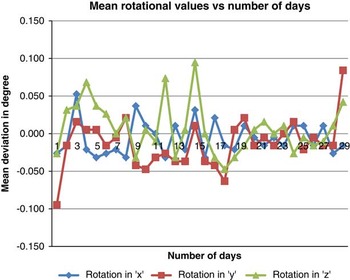
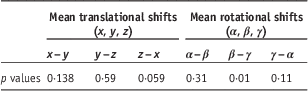
Paired sample t-test was performed between the mean values of translational shift (x, y, z) and rotational shifts (α, β, γ). No significant difference was observed (p>0·05) between the translational shifts x–y, y–z and z–x showing p value 0·14, 0·59 and 0·59, respectively. There was significant difference (p<0·05) between rotational shift β–γ (p value 0·01). Further, no significant difference was observed between rotational shift α–β (p value 0·31) and γ–α (p value 0·11) shown in Table 1. The mean translational and rotational shifts for 30 consecutive days were plotted in Figures 2 and 3, respectively.
Variation of mean translational shifts with number of days.

Variation of mean rotational shifts with number of days.

p values for difference between mean translational (x, y, z) and mean rotational (α, β, γ) shifts for 30 consecutive days

For the 30 days the observed mean standard deviations were 0·05, 0·05, 0·06 mm in the three translational (x, y and z) and 0·05°, 0·05°, 0·05° in the three rotational axes (about x, y, z) axes. These standard deviations indicate the inherent uncertainty in the determination of the shifts by the volumetric imaging method. In an ideal situation and perfectly functioning software these values shall be zero and the magnitude of their deviations from zero is a direct indicator of the satisfactory performance of the imaging tools. Tabulating the mean deviations and their standard deviations observed on each day for the 30 measurement days, the systematic and random errors in the determination of shifts by the XVI software were calculated (Table 2). The systematic errors were found to be 0·03, 0·04 and 0·03 mm, whereas the random errors were 0·05, 0·06 and 0·06 mm in the lateral, cranio-caudal and anterio-posterior directions, respectively. For the rotational shifts, the systematic errors were 0·02°, 0·03° and 0·03° and the random errors were 0·06°, 0·05° and 0·05° in the pitch, roll and yaw directions, respectively. The inherent uncertainties in every image guidance system should be assessed and baseline values established at the time of its commissioning. These shall be periodically tested as part of the QA protocol.
Mean standard deviation (SD), random error, systematic error and margins for uncertainty in X-ray volumetric imaging (XVI) tools

Abbreviation: RMS, root mean square.
DISCUSSION
Our findings confirm that there is difference in the mean values of translational and rotational shifts between all 30 days reading, even each day acquired reading are also showing difference for multiple time image acquisition on a single sitting due to inherent statistical nature of radiation interaction with the tissues, image formation and automatic registration between acquired data and reference CT data. The image slice averaging, widow width and level settings can also attribute to the inherent shifts for XVI tools. The gantry rotation about the phantom can be another source of uncertainty as full gantry rotation will contribute less uncertainty compared with partial gantry rotation due to availability of increased sample size in full gantry rotation. In our study, all the image acquisition parameters were taken as per our institutional protocol.
Although, the differences between mean translational shifts of different days readings (translational x–y, y–z and z–x) were not significantly different (p>0·05), due to more accurate matching between the acquired and reference CT image dataset of the phantom in translational direction. However, the significant difference was observed in rotational shift, about y and z axes of the phantom, due to inherent image registration error between acquired and reference images, showing more variation in rotational directions.
The mean translational shift calculated using van Herk formula is of the order of 0·01 mm, which is comparably of less order than the actual margin used for CTV to PTV margin for clinical purpose, during actual patient treatment. For the margin calculation due to inherent uncertainty of XVI imaging system, this margin has a potential clinical impact over the image acquisition of daily patient image verification, as it will provide a wrong target location due to more uncertainty involvement in the imaging tools, which plays a crucial role in IGRT treatment. Sykes et al.Reference Sykes, Lindsay, Dean, Brettle, Magee and Thwaites 1 have measured the cone-beam KV to MV isocentre coincidence and reported 0·5 mm standard deviation in all direction. No other study, describing inherent margin due to software, image registration and hardware has been reported. Although, image quality (IQ) of the CBCT has been analysed by Nakahara et al.Reference Nakahara, Tachibana and Watanabe 12 over 1 year period where they have shown a significant change in IQ of CBCT (CT number to density curve changed to 5%) and major changes were observed after repair of CBCT. With the proper QA the XVI system can be used for the target localisation, dose delivery, decision about adaptive planning of the tumour.Reference Thilmann, Nill and Tücking 13 – Reference Hellman 16
CONCLUSION
Our study concluded that there was an inherent uncertainty associated with the XVI tools, on the basis of these 6D shifts, margins were calculated and recorded as a baseline for the QA programme for XVI imaging tools by checking its reproducibility once in a year or after any major maintenance in hardware or upgradation in software. Although, the shift determined was of the order of submillimetre order, still that shift had great significance for the IQ control of the XVI tools. Every departments practising quality radiotherapy with such imaging tools should establish their own baseline value of inherent shifts and margins during the commissioning and must use an important QA protocol for the tools.
Acknowledgements
The authors would like to give their sincerely thanks to Vijendra Saini, Dr Anusheel Munshi and Dr B. R. K. Gupta for their help and support during preparation of the study.