





Introduction
The Caucasus region is recognized as a global biodiversity hotspot (Myers et al., Reference Myers, Mittermeier, Mittermeier, da Fonseca and Kent2000). Within this region, Lake Sevan is Armenia’s largest freshwater ecosystem and the only reservoir that retains its industrial significance. The lake is inhabited by 2 endemic fish species: Sevan trout Salmo ischchan Kessler 1877 and Sevan barbel Barbus goktschaicus Kessler 1877, as well as 1 endemic subspecies, Sevan scraper Capoeta sevangi De Filippi 1865, all listed as endangered and recorded in the Red Data Book of Armenia (Aghasyan and Kalashyan, Reference Aghasyan and Kalashyan2010). In contrast, the whitefish Coregonus lavaretus Linnaeus 1758 (C. lavaretus) was introduced into Lake Sevan from 1924 to 1927 using several batches of fertilized eggs or hatched larvae from 2 distinct whitefish taxa: the Lake Ludoga whitefish C. widegreni Malmgren 1863 and the Lake Chud whitefish C. lavaretus maraenoides Polyakov 1874 (Gabrielyan et al., Reference Gabrielyan, Vardanyan, Barseghyan and Khosrovyan2022). The estimated total stock of whitefish in Lake Sevan as of November 2024 amounted to 1293.7 tons (Ministry of Environment of the Republic of Armenia, 2025). The presence of a large established whitefish population in the lake may influence parasite transmission dynamics and host–parasite interactions within the ecosystem (Peeler et al., Reference Peeler, Oidtmann, Midtlyng, Miossec and Gozlan2011; Lymbery et al., Reference Lymbery, Morine, Gholipour Kanani, Beatt and Morgan2014).
Earlier parasitological surveys reported a diverse parasite fauna in whitefish from Lake Sevan, including protozoans, cestodes, trematodes, acanthocephalans and crustacean taxa (Olk et al., Reference Olk, Henriksen and Dolven2020; Vashchenko et al., Reference Vashchenko, Matvienko, Kravchenko and Mruk2021). Among them, protists such as Ichthiobodo necator Henneguy, 1883, Ichthyophthirius multifiliis Fouquet 1876, Trichophrya piscium Butschli 1889, different species of trichodinids, Chilodonella sp., cnidarian Chloromyxum sp., crustaceans from family Ergasiliade, Lernaea sp. and Argulus foliaceus Linnaeus 1758, leech Piscicola geometra Linnaeus 1758, a polyopisthocotylean Discocotyle sagittata Leuckart 1842, cestodes Proteocephalus exiguus La Rue 1911, P. longicollis Zeder 1800, and Triaenophorus crassus Forel 1868, acanthocephalans Echinorhynchus salmonis Müller 1784 and E. truttae Schrank 1788, and trematodes Diplostomum sp. and Ichthyocotylurus erraticus Rudolphi 1809 (I. erraticus) (Achatz and Tkach, Reference Achatz and Tkach2025, Vashchenko et al., Reference Vashchenko, Matvienko, Kravchenko and Mruk2021) have been reported. In particular, the metacercariae of the diplostomid trematode, I. erraticus, previously reported under name Cotylurus sp. (Razmaskin, Reference Razmaskin1964, Reference Razmaskin1966; Niewiadomska and Kozicka, Reference Niewiadomska and Kozicka1970), stand out due to their consistently high prevalence and intensity in Sevan whitefish, reaching up to 100% and over 600 metacercariae, respectively (Pavlova, Reference Pavlova1957; Vartanyan, Reference Vartanyan1993; Harrod and Griffiths, Reference Harrod and Griffiths2005a; Tolstenkov, Reference Tolstenkov2007; Voropaeva and Tolstenkov, Reference Voropaeva and Tolstenkov2008; Voropaeva et al., Reference Voropaeva, Tolstenkov and Oganesyan2010).
The life cycle of I. erraticus usually involves snails as the first intermediate host and fish, primarily Salmoniformes, as the second intermediate host and piscivorous birds as definitive hosts (Pieters et al., Reference Pieters, Hoyer, Verstappen, Wolters, Ijzer, de Jong, Cremers and Kik2014). Within Salmoniformes, the parasite shows a marked preference for fish of the genus Coregonus, particularly C. albula Linnaeus, 1758 and C. lavaretus. The metacercariae are commonly located in the pericardial cavity of fish, which are then ingested by piscivorous birds, completing the parasite’s life cycle (Pieters et al., Reference Pieters, Hoyer, Verstappen, Wolters, Ijzer, de Jong, Cremers and Kik2014). Although the direct pathogenicity of I. erraticus in fish is not always evident, high parasitic intensity can compromise fish fitness to cope with other stressors, becoming more susceptible to secondary pathogens (Dezfuli et al., Reference Dezfuli, Giari, Simoni, Shinn, Manera and Bosi2005; Harrod and Griffiths, Reference Harrod and Griffiths2005a, 2005b). Given the economic importance of Sevan whitefish, even sublethal effects of infection could have management implications (Barber et al., Reference Barber, Hoare and Krause2000; Pegg and Britton, Reference Pegg and Britton2014; Quiazon, Reference Quiazon2015; Allan et al., Reference Allan, Illing, Fakan, Narvaez, Grutter, Sikkel, McClure, Rummer and McCormick2020).
In general, fish-infecting metacercariae can have different effects on fish, depending on many factors, particularly the parasite species and the host’s immune response (Noga, Reference Noga2000). Some parasitic species induce significant pathological alterations, while others are associated with limited tissue damage, facilitating long-term persistence within the host. For example, diplostomids generally show no relevant pathological alterations, such as necrosis, cellular degeneration or inflammatory responses, in infected tissues, as observed in gilthead seabream Sparus aurata Linnaeus 1758 infected with Cardiocephaloides longicollis Rudolphi 1819, a brain-dwelling parasite (Born-Torrijos et al., Reference Born-Torrijos, van Beest, Merella, Garippa, Raga and Montero2023). In contrast, the metacercariae of diplostomid Apharyngostrigea cornu Zeder 1800 can cause haemorrhaging that leads to mortality, and Diplostomum species von Nordmann 1832 can induce severe retinal lesions, impairing fish vision (Padrós et al., Reference Padrós, Knudsen and Blasco-costa2018). I. erraticus metacercariae, while located in the heart, do not always cause degenerative changes in myocardial cells but can induce an inflammatory reaction and connective tissue proliferation (Dezfuli et al., Reference Dezfuli, Giari, Simoni, Shinn, Manera and Bosi2005). While there are previous descriptive records of I. erraticus metacercariae in freshwater fish in continental and northern Europe, to our knowledge, there is limited data on its impact on whitefish, and molecular data for this species remain limited.
Given the previously observed heavy infection levels of the whitefish with I. erraticus metacercariae in Sevan Lake, the aim of this study was to: (i) validate the species identification using morphological and molecular tools; (ii) assess its impact on the host (e.g. tissue reaction, age classes of infected fish, gonadal development and condition factor) and (iii) evaluate the diplostomid infection patterns in this host throughout 3 seasons.
Materials and methods
Host and data collection
Fish sampling was conducted in Lake Sevan, one of the largest high-altitude (alpine) freshwater lakes in Eurasia, fed by 28 rivers and streams. The lake is situated in Gegharkunik Province, at an altitude of 1900 m above sea level. It covers about one-sixth of Armenia’s total area. Sampling was carried out in multiple locations within Lake Sevan during spring, summer and autumn of 2024 (Figure S1, Table S1). A total of 300 whitefish were collected, reaching 100 specimens per season (Table 1). These were captured using 100 m long, 6 m high gill nets with mesh sizes of 30 × 30 mm, 40 × 40 mm and 45 × 45 mm, which were deployed from 06:00 until 18:00. Fish collection was conducted under a scientific fishing permit issued by the Ministry of Environment of the Republic of Armenia (Order No. 376-N, dated October 24, 2023), which allowed the annual capture of up to 500 whitefish specimens for scientific purposes.
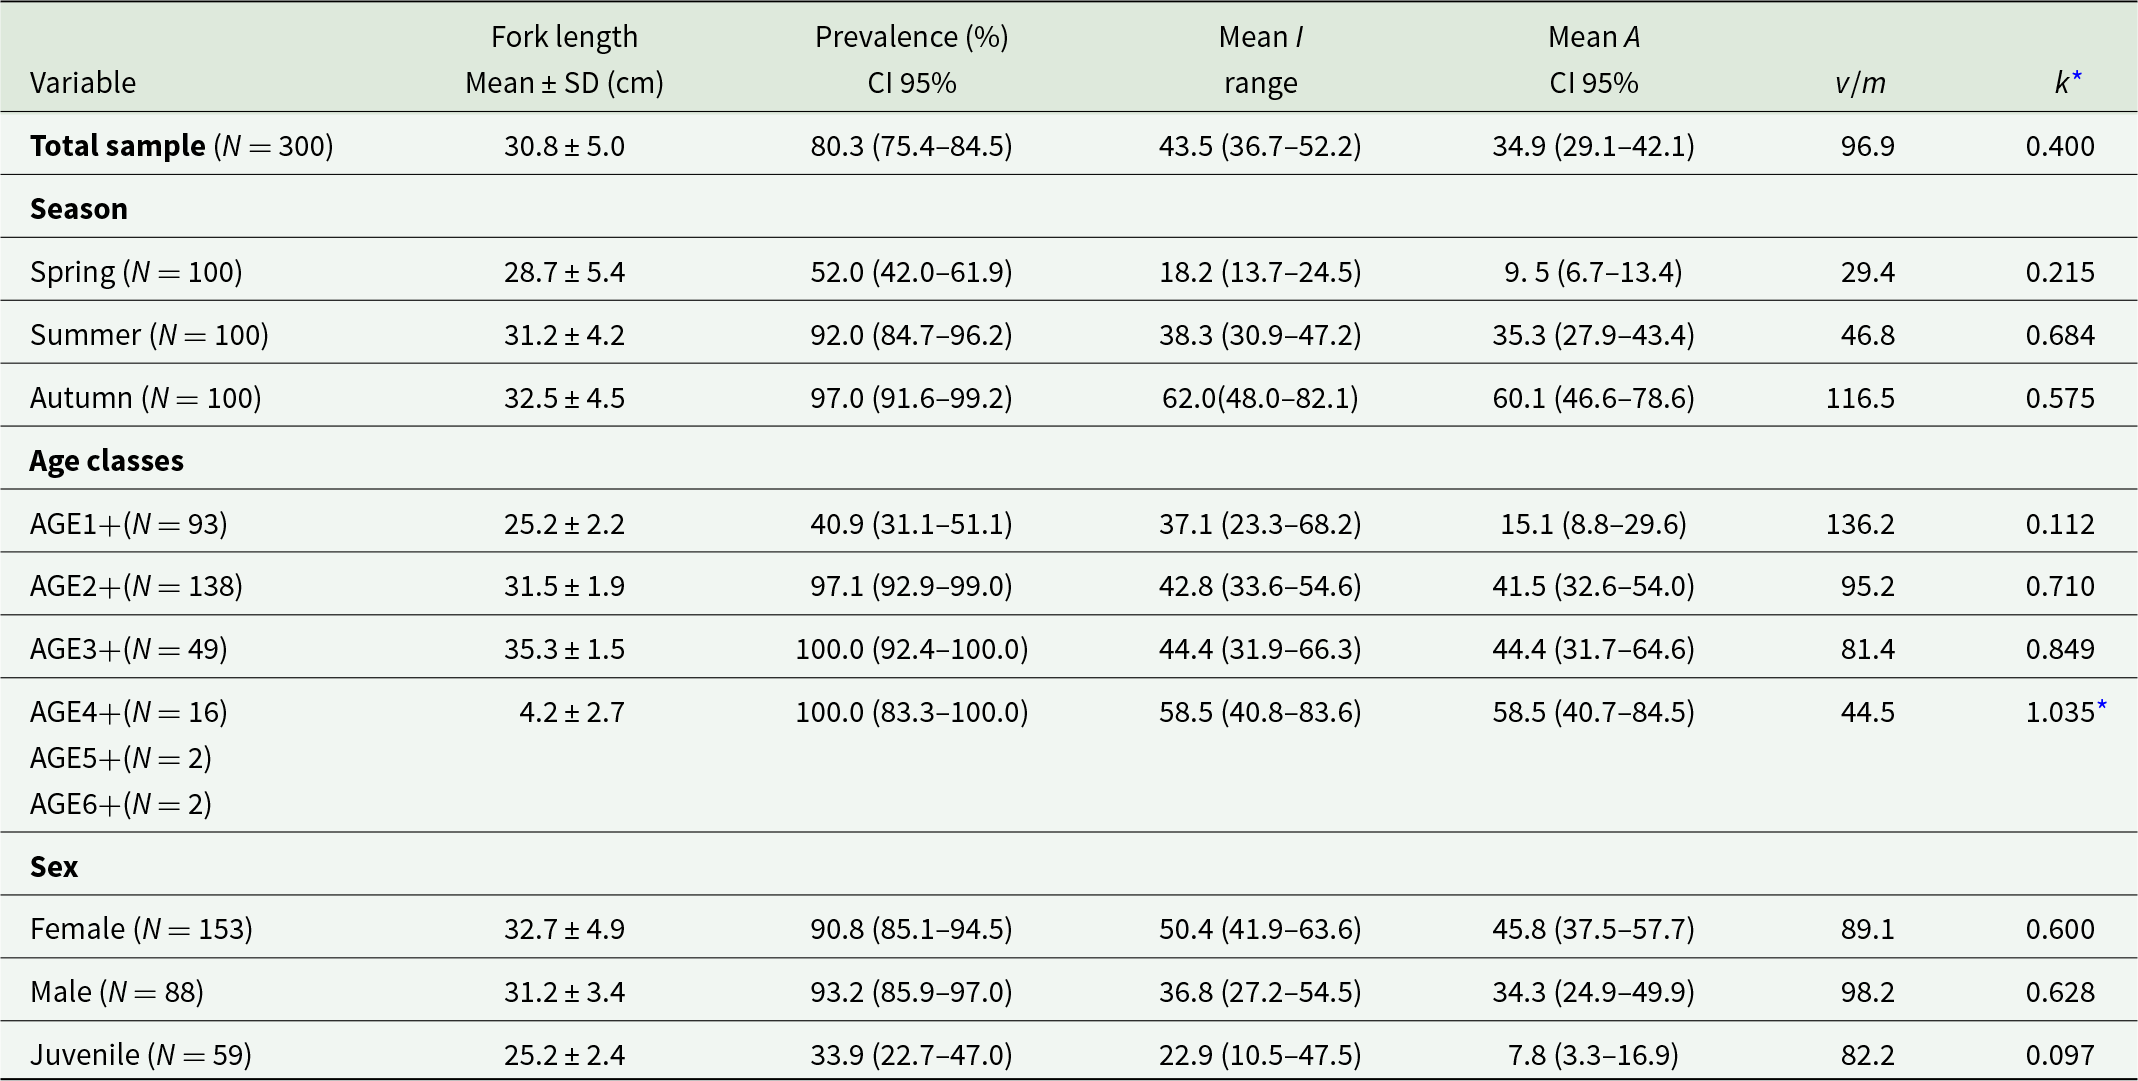
Total mean prevalence (%) with Stern’s exact 95% confidence limits (CI), mean intensity (I), mean abundances with bootstrap 95 % CI (A) and variance-to-mean ratio of parasites (v/m) Ichthyocotylurus erraticus Rudolphi 1809 in whitefish Coregonus lavaretus Linnaeus 1758 in Lake Sevan in 2024

Table 1 Long description
Rows report fork length mean plus or minus standard deviation in centimeters, prevalence percent with 95 percent confidence limits, mean intensity with range, mean abundance with 95 percent confidence limits, variance to mean ratio, and k star for the total sample and by season, age classes, and sex. Total sample size was 300 with fork length 30.8 plus or minus 5.0, prevalence 80.3 with 95 percent confidence limits 75.4 to 84.5, mean intensity 43.5 with range 36.7 to 52.2, mean abundance 34.9 with 95 percent confidence limits 29.1 to 42.1, variance to mean ratio 96.9, and k star 0.400. By season, spring had fork length 28.7 plus or minus 5.4, prevalence 52.0 with confidence limits 42.0 to 61.9, mean intensity 18.2 with range 13.7 to 24.5, mean abundance 9.5 with confidence limits 6.7 to 13.4, variance to mean ratio 29.4, and k star 0.215; summer had 31.2 plus or minus 4.2, prevalence 92.0 with 84.7 to 96.2, mean intensity 38.3 with 30.9 to 47.2, mean abundance 35.3 with 27.9 to 43.4, variance to mean ratio 46.8, and k star 0.684; autumn had 32.5 plus or minus 4.5, prevalence 97.0 with 91.6 to 99.2, mean intensity 62.0 with 48.0 to 82.1, mean abundance 60.1 with 46.6 to 78.6, variance to mean ratio 116.5, and k star 0.575. By age classes, age 1 plus had fork length 25.2 plus or minus 2.2, prevalence 40.9 with 31.1 to 51.1, mean intensity 37.1 with 23.3 to 68.2, mean abundance 15.1 with 8.8 to 29.6, variance to mean ratio 136.2, and k star 0.112; age 2 plus had 31.5 plus or minus 1.9, prevalence 97.1 with 92.9 to 99.0, mean intensity 42.8 with 33.6 to 54.6, mean abundance 41.5 with 32.6 to 54.0, variance to mean ratio 95.2, and k star 0.710; age 3 plus had 35.3 plus or minus 1.5, prevalence 100.0 with 92.4 to 100.0, mean intensity 44.4 with 31.9 to 66.3, mean abundance 44.4 with 31.7 to 64.6, variance to mean ratio 81.4, and k star 0.849; combined age 4 plus, age 5 plus, and age 6 plus had fork length 4.2 plus or minus 2.7, prevalence 100.0 with 83.3 to 100.0, mean intensity 58.5 with 40.8 to 83.6, mean abundance 58.5 with 40.7 to 84.5, variance to mean ratio 44.5, and k star 1.035 with an asterisk. By sex, female had fork length 32.7 plus or minus 4.9, prevalence 90.8 with 85.1 to 94.5, mean intensity 50.4 with 41.9 to 63.6, mean abundance 45.8 with 37.5 to 57.7, variance to mean ratio 89.1, and k star 0.600; male had 31.2 plus or minus 3.4, prevalence 93.2 with 85.9 to 97.0, mean intensity 36.8 with 27.2 to 54.5, mean abundance 34.3 with 24.9 to 49.9, variance to mean ratio 98.2, and k star 0.628; juvenile had 25.2 plus or minus 2.4, prevalence 33.9 with 22.7 to 47.0, mean intensity 22.9 with 10.5 to 47.5, mean abundance 7.8 with 3.3 to 16.9, variance to mean ratio 82.2, and k star 0.097.
Data on host length are given with ± standard deviation (SD).
Exponent of the negative binomial (k*) showed no statistical difference between observed and expected frequencies at p < 0.05.
* indicates no statistically significant difference between observed and expected frequencies at p < 0.05.
The size structure of Lake Sevan whitefish was assessed by measuring fork length (L) and total body weight (W). Age structure was determined by counting annual rings on the front part of scales taken from the centre of the fish body, above the lateral line (Moiseev et al., Reference Moiseev, Azizova and Kuranova1981; Usov, Reference Usov2017). Briefly, 5–10 scales taken from each fish were washed in water, and the mucus covering the scales was brushed off with a soft brush. Fish were grouped into age classes based on scale readings: AGE1+, AGE2+, AGE3+, AGE4+, AGE5+ and AGE6+, where 1+ refers to fish aged between 1 and 2 years, 2+ to fish aged between 2 and 3 years and so forth. The sex of the fish (undetermined, male or female) was determined by examining the gonads with a microscope at low magnification (Bresser Science ETD-301, Germany). To assess gonadal development in fish, a maturity scale ranging from stage I to VI was used (Pravdin, Reference Pravdin1966). The condition factor (Fulton’s condition index) has been calculated according to the formula [total fish weight/(fork length)3 × 100] (Moiseev et al., Reference Moiseev, Azizova and Kuranova1981).
Parasite collection
Encysted metacercariae were isolated from the fish heart, excysted by gently pressing them between microscope slides and counted at a low magnification with a microscope (Bresser Science ETD-301, Germany). For the morphological identification, metacercariae fixed in buffered paraformaldehyde were analysed using the morphological key of Avdeev et al. (Reference Avdeev, Bauer and Bykhovskaya-pavlovskaya1987). A subset of specimens was subsequently fixed in 96% ethanol for molecular identification. Additionally, tissues-encysted specimens were fixed in buffered paraformaldehyde for transmission electron microscopy.
Histological analysis of infected hearts
Whole fish hearts, liver and gill pieces were removed, immediately immersed in 10% neutral buffered formalin and fixed for 48 h. The tissue samples were then rinsed with phosphate-buffered saline (PBS), dehydrated in a graded ethanol series, cleared in xylene, embedded in paraffin wax and sectioned to 3–5 µm thickness using an automated rotary microtome (HistoCore Autocut; Leica Biosystems, Germany). Two slides were prepared per block. One slide was stained with haematoxylin and eosin (H&E) according to the standard protocol. The second slide was used for specific staining of connective and muscle tissues with the Mallory trichrome stain according to a standard procedure described by Švob and Hraste (Reference Švob and Hraste1979). Staining solutions for Mallory trichrome staining were prepared from powdered chemicals (acid fuchsin, oxalic acid, phosphotungstic acid, aniline blue), all purchased from Sigma-Aldrich. In brief, the deparaffinized and rehydrated slides were post-fixed with 3% potassium dichromate in 20% formalin. The slides were then stained with 1% acid fuchsin, differentiated in 1% phosphomolybdic acid and stained with aniline blue/orange G solution. The stained slides were then dehydrated, cleared in xylene and coverslip mounted with Neo-Mount (Merck). The slides were examined under a Leica DM 3000 microscope (Leica Microsystems, Germany). Images were captured with the Leica DMC 4500 digital camera (Leica Microsystems, Germany) and annotated and stitched in PhotoShop CS5.
Microscopy and morphometric measurements
A total of 3 infected fish hearts and associated metacercariae aggregates were fixed in buffered formalin and examined under the Macro Zoom Microscope MVX10 (Evident Corporation, Tokyo, Japan). For morphological analysis, 12 metacercariae collected from 2 infected fish hearts were further examined using differential interference contrast (DIC) microscopy on a widefield fluorescence microscope (Olympus BX63, Olympus Corporation, Tokyo, Japan) and a light microscope (Olympus BX51, Olympus Corporation, Tokyo, Japan). All imaging devices were housed at facilities at the Biology Centre of the Czech Academy of Sciences (i.e. the MVX10 and BX63 at the Laboratory of Microscopy and Histology, and the Laboratory of Functional Helminthology). Morphometric measurements were obtained from 7 excysted and encysted metacercariae using ImageJ software (version 1.54k) (Schneider et al., Reference Schneider, Rasband and Eliceiri2012).
Transmission electron microscopy
A total of 3 Ichthyocotylurus metacercariae specimens with surrounding host tissues were collected and fixed in 3.5% Electron Microscopy-grade EM-grade paraformaldehyde in 0.1 M PBS (pH 7.2) for 24 h at 4 °C, and then in 3% glutaraldehyde in 0.1 M PBS (pH 7.2) for 2 h. Subsequently, tissues were post-fixed in 2% osmium tetroxide for 2 h, dehydrated in an ascending series of acetone and infiltrated with mixtures of 25, 50 and 75% low-viscosity Spurr resin (SPI Chem, West Chester, PA, USA) and anhydrous acetone for 1 h each and incubated overnight in 100% resin. The samples were left to polymerize at 60 °C for 48 h in embedding moulds. Afterwards, 1% toluidine blue-stained semi-thin sections (0.5 μm) were evaluated for orientation under the light microscope. Then, ultrathin sections (60–90 nm) were cut through selected regions using a diamond knife on a Leica Ultracut UCT ultramicrotome. These were placed on copper grids, stained with uranyl acetate and lead citrate (Reynolds, Reference Reynolds1963). Ultrathin sections were observed under a JEOL JEM-1400 microscope (JEOL, Akishima, Tokyo, Japan) operating at an accelerating voltage of 120 kV. The images were taken with a XAROSA 20-megapixel CMOS camera (EMSIS GmbH, Münster, Germany) and assembled and annotated in Inkscape 1.0 software (https://inkscape.org) at the Laboratory of Electron Microscopy, Institute of Parasitology, Biology Centre of the Czech Academy of Sciences (Czech Republic).
Molecular identification
Genomic DNA of Ichthyocotylurus sp. metacercariae was extracted from 12 ethanol-fixed (96%) specimens collected from 6 whitefish (2 per fish). Metacercariae were digested in 300 μL TNES buffer (Tris-NaCl-EDTA-SDS buffer) and Proteinase K (100 µg mL−1) at 55 °C for 2–3 h. Following a phenol-chloroform protocol for DNA extraction, the DNA was resuspended in 25 μL of RNase/DNase-free water and allowed to dissolve overnight in the refrigerator. The purity and quantity of DNA were assessed using a NanoDrop 31 spectrophotometer ND-1000 (Thermo Fisher, USA). Molecular identification of metacercariae was inferred by sequencing the large ribosomal subunit (28S rDNA) and the mitochondrial cytochrome c oxidase subunit 1 gene (cox1).
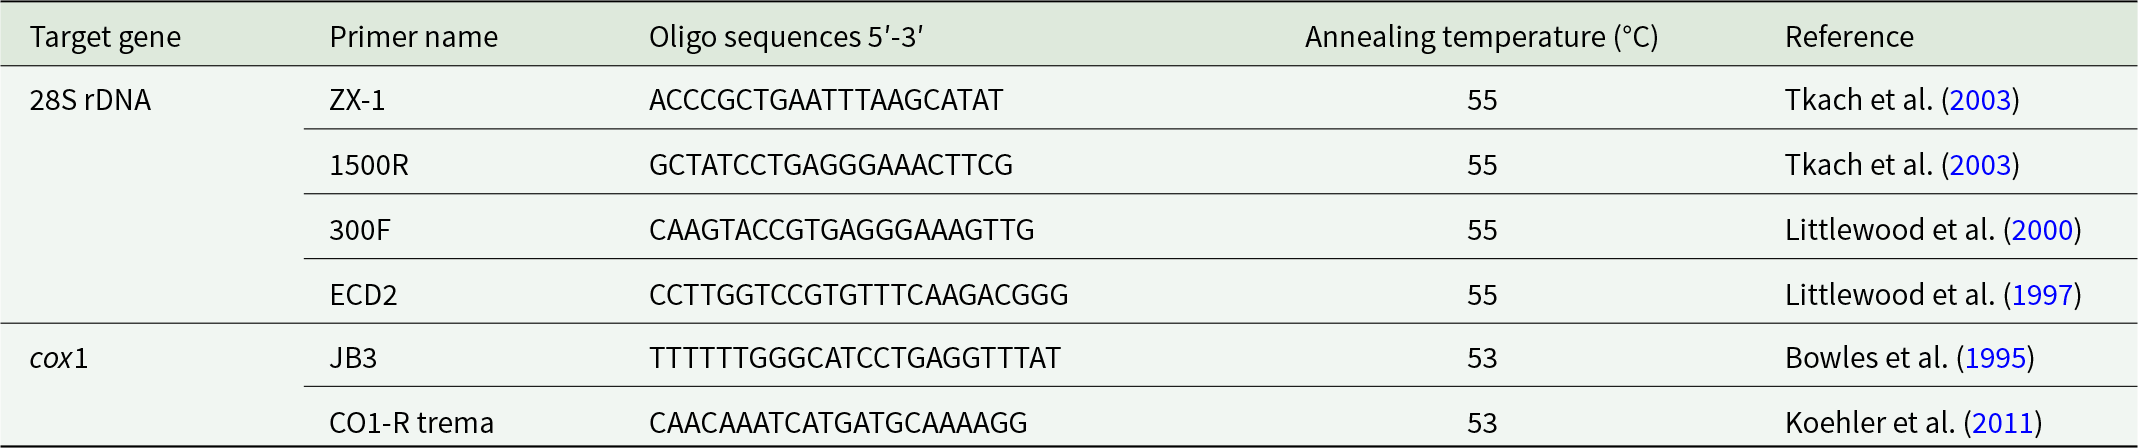
Loci were amplified by PCR using previously reported primers for digenean species (Table 2). The cycling conditions for the 28S rDNA and cox1 genes were set according to Tkach et al. (Reference Tkach, Littlewood, Olson, Kinsella and Swiderski2003) and Zikmundová et al. (Reference Zikmundová, Georgieva, Faltynková, Soldánová and Kostadinova2014), with annealing temperatures of 55 °C and 53 °C, respectively, and were carried out in a Biometra TAdvanced thermocycler (Analytik Jena GmbH, Germany).
Characteristics of primer sets used in this study for Ichthyocotylurus erraticus Rudolphi 1809 targeting 28S rDNA and cox1 mtDNA

Table 1 Long description
Primer details are listed by target gene, primer name, oligo sequences from 5 prime to 3 prime, annealing temperature in degrees Celsius, and reference. For 28S rDNA, primer ZX 1 has sequence ACCCGCTGAATTTAAGCATAT, annealing temperature 55, reference Tkach et al. 2003. For 28S rDNA, primer 1500 R has sequence GCTATCCTGAGGGAAACTTCG, annealing temperature 55, reference Tkach et al. 2003. For 28S rDNA, primer 300 F has sequence CAAGTACCGTGAGGGAAAGTTG, annealing temperature 55, reference Littlewood et al. 2000. For 28S rDNA, primer ECD2 has sequence CCTTGGTCCGTGTTTCAAGACGGG, annealing temperature 55, reference Littlewood et al. 1997. For cox1, primer JB3 has sequence TTTTTTGGGCATCCTGAGGTTTAT, annealing temperature 53, reference Bowles et al. 1995. For cox1, primer CO1 R trema has sequence CAACAAATCATGATGCAAAAGG, annealing temperature 53, reference Koehler et al. 2011.
The PCR reactions were performed using AccuStart II GelTrack® PCR SuperMix (Quantabio, USA) according to the manufacturer’s instructions. Amplification products were visualized in a 1% agarose gel using GelRed (Millipore, USA), and the bands of the appropriate size for each locus were excised and purified using the Gel/PCR DNA Fragments Extraction Kit (Geneaid Biotech, Taiwan), diluted in 25 μL of RNase/DNase-free water. The sequencing was carried out at SEQme commercial (Dobříš, Czech Republic), where the purified samples were sequenced using ABI Big Dye™ v.3.1 chemistry, following the manufacturer’s instructions. The obtained sequences were deposited in GenBank under the accession numbers PV342565–PV342576 (28S rDNA) and PV345981–PV345990 (cox1).
Phylogenetic analyses
The newly generated sequences were checked using the Basic Local Alignment Search Tool (NCBI, Reference Ncbi2025) and aligned with selected GenBank sequences using MUSCLE implemented in Geneious Prime® 2025.0.3. The alignment for 28S rDNA, trimmed according to the length of the shortest reference sequence (565 bp), included 12 sequences generated in this study, 11 reference sequences (Table S5) and the Apatemon fuligulae Yamaguti, 1933 sequence (MW244636) as an outgroup. The complete 28S sequences generated in this study (1303–1341 bp) were deposited in GenBank, but only the 565 bp region shared by all available reference sequences was used for phylogenetic analysis. The reference sequence selection was based on the previously published topology of the tribe Cotylurini (Faltynková et al., Reference Faltynková, Jouet, Nielsen and Skírnisson2024). The alignment for cox1, trimmed as aforementioned (314 bp), included 10 sequences generated in this study, 4 of the longest sequences out of 5 available reference sequences (Table S5) and Cotylurus cornutus Rudolphi 1809 sequence (MW204806) as an outgroup. The latter was selected based on the previously published topology of Ichthyocotylurus Odening 1969 (Bell et al., Reference Bell, Sommerville and Valtonen2001).
Phylogenetic relationships were inferred using maximum likelihood (ML) and Bayesian inference after determining the most suitable evolutionary model using MEGA v.12 (Kumar et al., Reference Kumar, Stecher, Suleski, Sanderford, Sharma and Tamura2024). For both alignments, the Hasegawa-Kishino-Yano HKY model was selected as the best-fitting model based on the Bayesian information criterion. Phylogenetic analysis was conducted in Geneious Prime 2025.0.3, using the MrBayes (Bayesian inference) and PhyML (maximum likelihood) tools. For Bayesian inference, Markov Chain Monte Carlo chains were run for 5 000 000 generations, and log-likelihood scores were recorded to estimate burn-in; the last 75% of trees were used to construct the consensus tree. Nodal support for the ML tree was assessed by performing 1000 bootstrap pseudoreplicates.
Statistical analyses
To evaluate patterns of parasite infection, a 2-tiered statistical approach was used. First, standard parasitological descriptors, i.e. prevalence, mean abundance and mean intensity, were calculated following Bush et al. (Reference Bush, Lafferty, Lotz and Shostak1997), and 95% confidence intervals were estimated using Sterne’s exact method and nonparametric bootstrapping (Reiczigel and Rózsa, Reference Reiczigel and Rózsa2005). Prevalence and intensity comparisons across season, sex and age classes were conducted using Fisher’s exact test and the exact unconditional test for small samples.
To evaluate the effects of host traits and season on the parasite, parasite abundance was modelled to quantify variation in infection pressure while retaining information from both infected and uninfected individuals. A zero-inflated negative binomial generalized linear mixed model (ZINBMM) was fitted using the glmmTMB package (Brooks et al., Reference Brooks, Kristensen, van Benthem, Magnusson, Berg, Nielsen, Skaug, Mächler and Bolker2017). The model incorporated age and season as fixed effects and observation ID as a random effect, allowing us to account for overdispersion, zero-inflation and hierarchical structure in the data. Prior to statistical modelling, extreme values in parasite abundance (A) were identified as potential outliers by using the interquartile range (IQR) method, whereby observations with abundance values below Q1 − 1.5 × IQR or above Q3 + 1.5 × IQR were flagged as outliers (ggplot2 and ggrepel packages). Only a single outlier was excluded to minimize its potential influence on model estimation. Additionally, given the limited sample sizes in the oldest age classes (4+, 5+ and 6+ years), these were combined (i.e. 4–6+) to ensure sufficient statistical power and robustness in subsequent modelling (ZINBMM) (Table S2). This approach ensured sufficient sample size per class while preserving biological interpretability and maintaining statistical rigour in subsequent modelling. Moreover, prior to final model selection, candidate predictors were screened. Variables that did not significantly improve model fit, including sex (male and female) and condition factor, were not retained in the final model (ZINBMM) (Table S3). In each ZINB model, the zero-inflation component used a simplified binary factor (AGE_zero) that distinguished the youngest group (‘1+’) from the others. Each model was used to generate estimated marginal means (emmeans package) (Lenth and Piaskowski, Reference Lenth and Piaskowski2025) and post hoc comparisons (Tukey and Bonferroni adjustments if needed). Model diagnostics were performed (DHARMa package) (Hartig, Reference Hartig2024) to ensure robust inference with respect to infection abundance (total parasite count across all captured fish, including those with 0 count). In addition, a Spearman correlation heatmap was constructed to explore relationships among key continuous traits, including parasite abundance, fish length, weight, condition factor and age class. Pairwise associations among these variables and categorical factors such as season and sex were further examined using a GGpairs matrix (GGally package).
To support the interpretation of the data and model outcomes, model-based predictions were also plotted using ggpredict (ggeffects package), allowing the visualization of the fixed effects of age and season while accounting for the log-link transformation of the negative binomial distribution. Differences were considered significant when p < 0.05. Statistical analyses were conducted using R version 4.5.1 (R Core Team, 2025) and RStudio version 2025.9.2 (R Studio Team, 2025).
Results
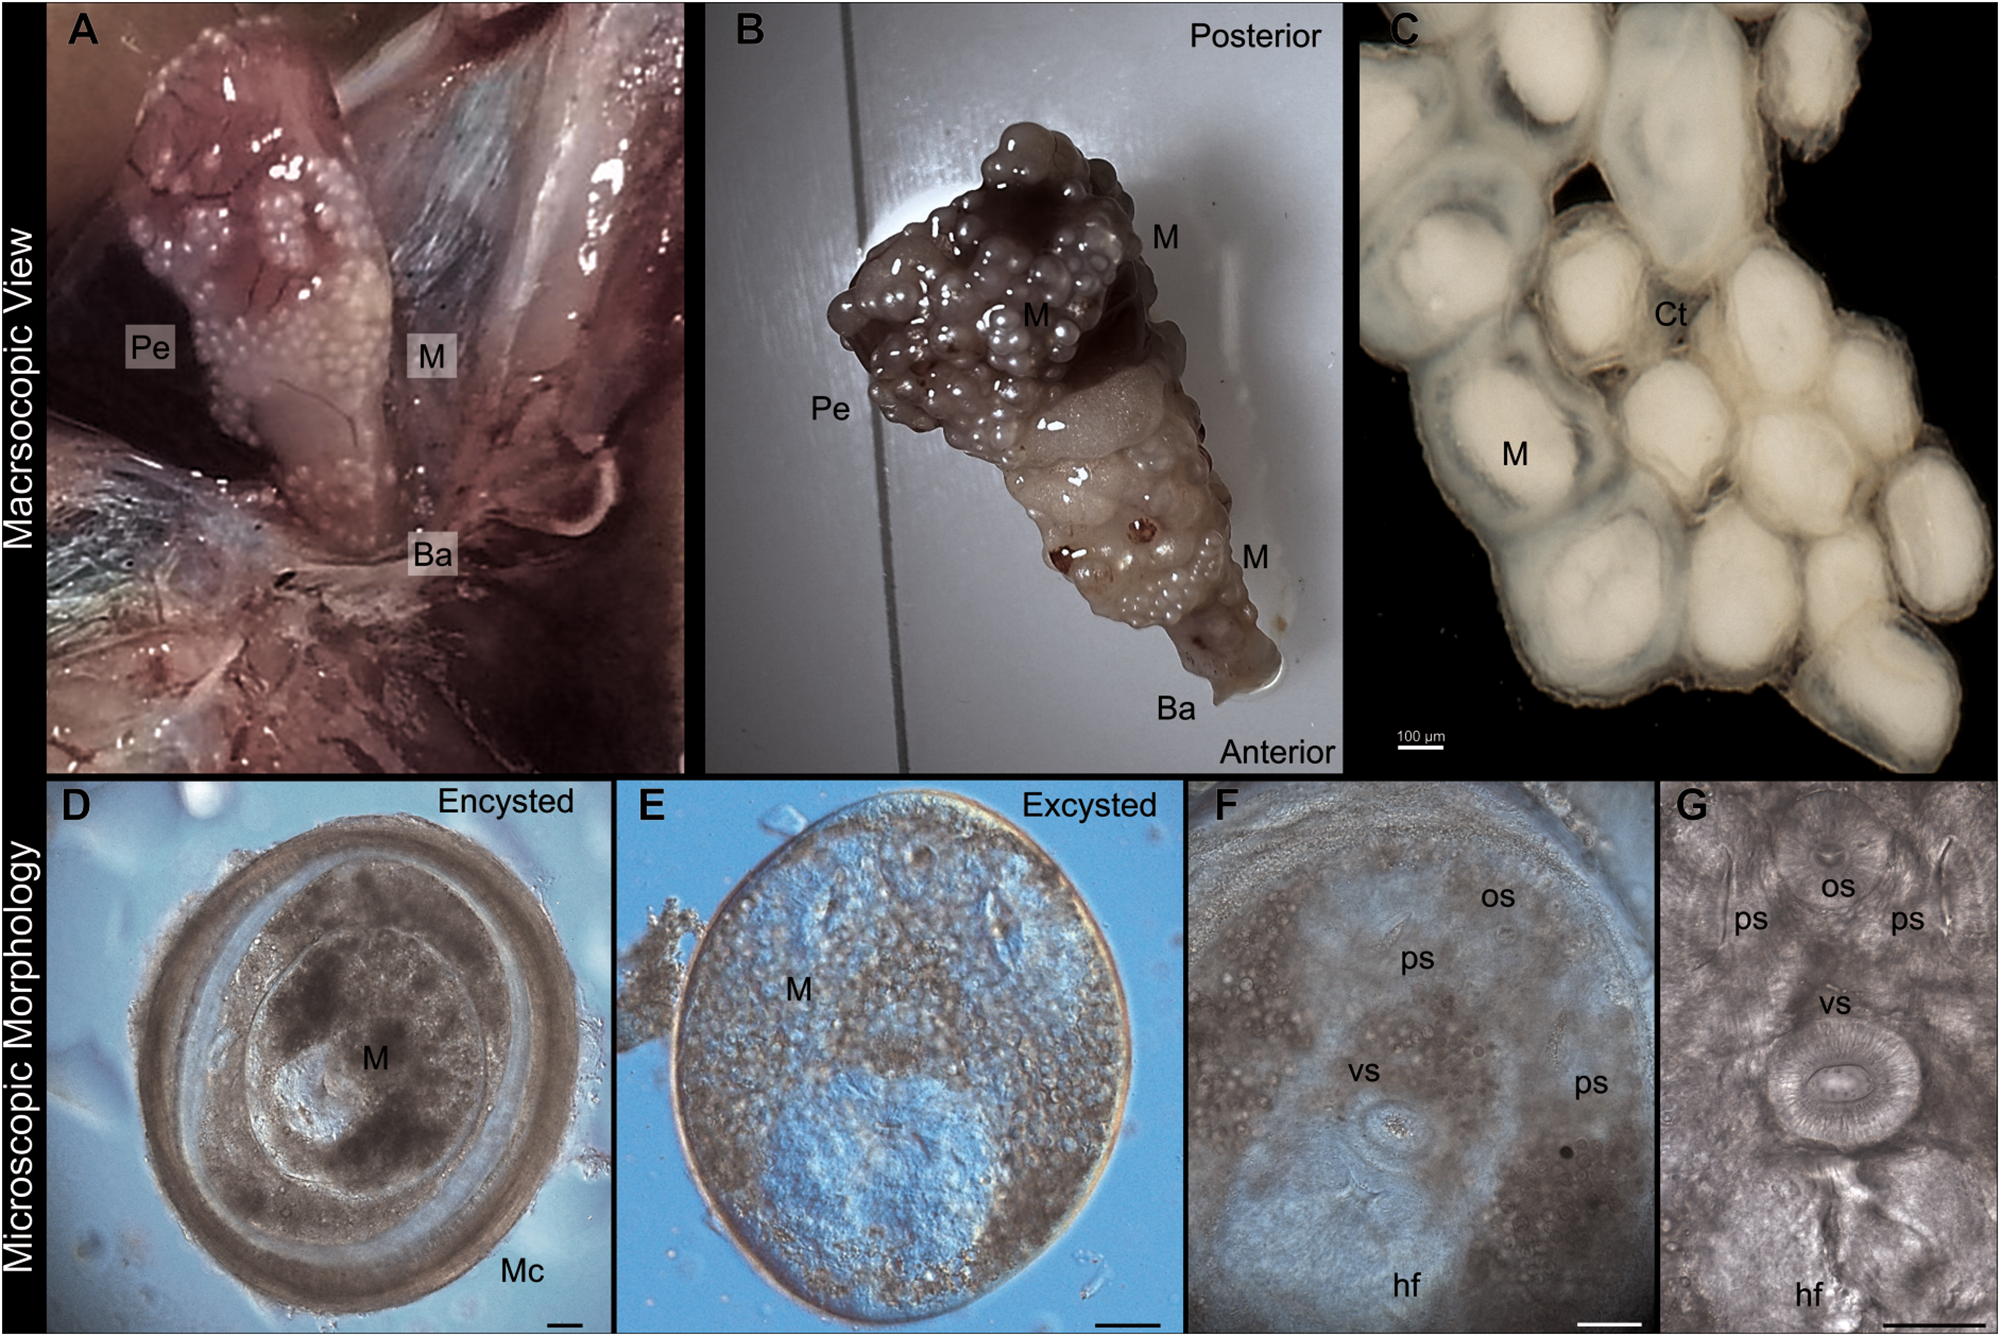
A total of 80.3% of whitefish were infected with metacercariae of I. erraticus isolated from the fish heart (Table 1, Figure 1). Metacercariae were encysted on the pericardium and the bulbus arteriosus either individually or aggregated, forming clusters (Figure 1). The number of metacercariae ranged from 2 to 373, and the mean intensity of infection was 43.5 (Table 1)․
Macroscopic (A–C) and microscopic (D–F) views of Ichthyocotylurus erraticus Rudolphi 1809 metacercariae infecting fish hearts from Lake Sevan (2024). (A) Image of a freshly dissected fish heart showing numerous cysts on the pericardium. (B) Isolated fish heart with aggregated metacercariae attached to the pericardium. (C) Cluster of metacercariae interconnected by putative connective tissue (Ct), possibly involved in maintaining cyst aggregation. (D–G) DIC microscopy images: (D) encysted I. erraticus metacercaria (M) with a visible space between the body and surrounding capsule (Mc). (E) Excysted metacercaria body. (F–G) High-magnification images revealing key morphological features, including the oral sucker (os), ventral sucker (vs), pseudoventral suckers (ps) and the holdfast organ. Images (C–G) are from samples fixed in paraformaldehyde. Scale bars (D–G), 50 µm. Pe, pericardium of fish heart; Ba, bulbus arteriosus; M, metacercaria body; Ct, connective tissue; Mc, metacercarial capsule; os, oral sucker; vs, ventral sucker; ps, pseudosuckers; Hf, Holdfast organ.

Ichthyocotylurus erraticus morphological identification
The metacercariae body showed similar features to a tetracotyle metacercaria (Figure 1). The cup-shaped forebody consisted of 2 pseudosuckers on either side of the oral sucker, and a protrusible, bilobed holdfast organ behind the ventral sucker (Figure 1). The metacercarial average length and width, based on measurement of 7 specimens fixed in buffered formalin, were 396.8 ± 59.8 µm (mean ± SD) and 333.2 ± 56.1 µm, respectively. The average length and width of the complete cyst size are 572.6 ± 138.9 µm and 499.1 ± 98.9 µm, respectively.
Histological analysis of the infected host
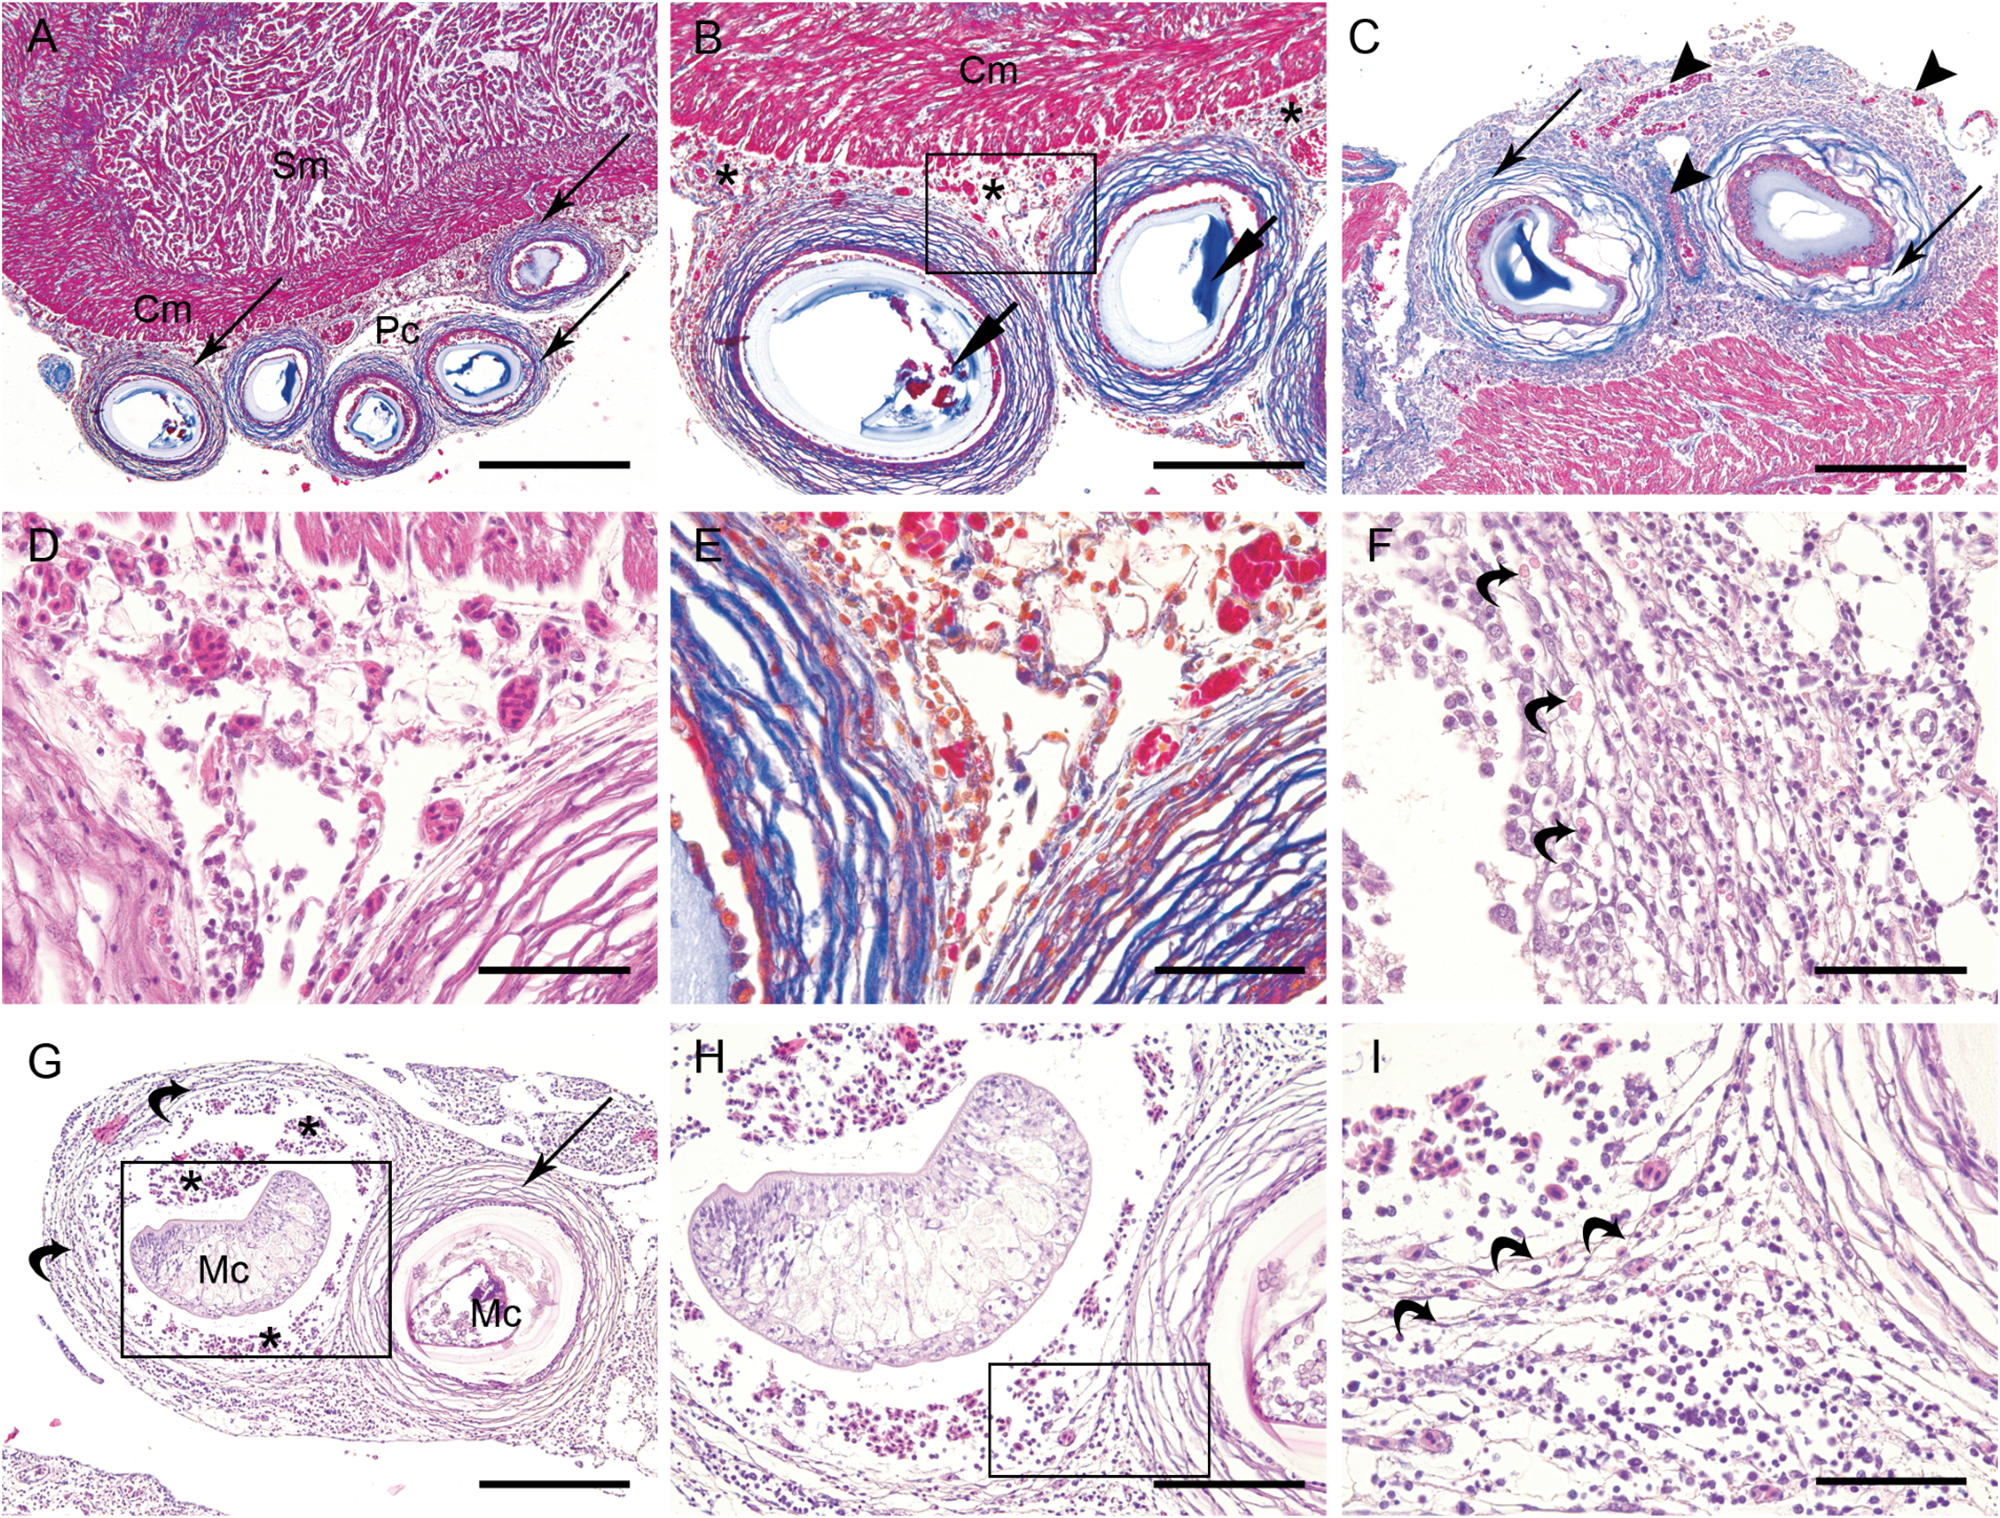
Histological analysis of infected whitefish hearts revealed the presence of several round to oval cysts embedded in epicardial and pericardial connective tissue and containing I. erraticus metacercariae. In both H&E and Mallory trichrome-stained sections, the parasites were surrounded by well-defined fibrous capsules of varying thickness. In Mallory-stained sections, the capsules turned intensely blue, confirming abundant collagen deposition and indicating chronic fibrosis and remodelling of the pericardial tissue (Figure 2). Occasionally, teguments or remnants of internal organs of the metacercariae could be seen within the cysts. A mild to moderate mononuclear infiltrate, consisting of lymphocytes and macrophages, was present, mainly at the outer edges of the capsules, less frequently between the collagen fibres or in the immediate vicinity of the metacercariae. Occasionally, eosinophilic bodies of varying sizes were observed, possibly indicating the degranulation of eosinophilic granule cells or cellular debris. No acute inflammatory reaction or tissue necrosis was observed. Numerous capillaries and small blood vessels around the cysts appeared hyperaemic or congested, possibly indicating local vascular reaction. Despite the presence of several parasite cysts, the myocardial tissue appeared to be intact; only the muscle fibres in the vicinity of the cysts, in the compact layer of myocardium, were compressed and displaced (Figure 2). Overall, the histopathological features of the infection are consistent with a low-grade chronic epi- and pericarditis and a strong fibrotic response to the presence of metacercariae, but no significant damage to the myocardial tissue.
Histopathological findings in the hearts of whitefish Coregonus lavaretus Linnaeus 1758 infected with Ichthyocotylurus erraticus Rudolphi 1809. (A) Overview of the infection in the epi-/pericardium (Pc) with several parasite cysts surrounded by a multilamellar fibrous capsule (thin arrow) in the immediate vicinity of the apparently uninfected compact layer (Cm) of the myocardium. The spongy layer (Sm) of the myocardium is not affected; (B) Higher magnification of 2 encysted metacercariae with clearly visible remnants of tegument and internal organs (short arrows). The pericardium is highly vascularized (asterisk) and the compact layer of myocardium (Cm) shows displaced muscle fibres; (C) Detail of 2 different parasitic cysts (thin arrows) showing a highly vascularized pericardium with several larger blood vessels (arrowheads) and numerous capillaries, suggesting tissue remodelling to maintain parasite nutrition; (D) Detail of the area shown in panel B with numerous hyperaemic and congested small blood vessels and capillaries and a moderate cellular infiltrate composed mainly of mononuclear cells. The fibrous capsules are well developed, and few immune cells are seen between the collagen lamellae; (E) Same area as in panel D, stained to show the thickness of the collagen lamellae forming the fibrous capsule; (F) High-power magnification of the capsule and pericapsular space showing a cellular infiltrate composed predominantly of mononuclear cells. Moderate numbers of eosinophilic bodies of varying sizes are seen, possibly indicating degranulation of eosinophilic granule cells and cellular debris; (G) Young metacercaria (Mc, left) surrounded by several very thin collagen lamellae (curved arrows), indicating recent infection. Moderate to heavy haemorrhages (asterisks) can be seen in the supposed intracapsular space. The metacercaria on the right of the image is surrounded by a fully formed capsule with numerous thick collagen lamellae (thin arrow); (H) Higher magnification of the area marked with a rectangle in panel G, showing the difference in thickness and number of collagen lamellae between the forming and fully formed capsule. Moderate to abundant cellular infiltrate can be seen in the pericapsular space and moderate to extensive haemorrhage in the intracapsular space; (I) High magnification of the newly forming and fully formed capsule showing multiple congested capillaries, abundant mononuclear infiltrate in the pericapsular space and moderate haemorrhage and cellular infiltrate in the intracapsular space. Staining – D, G–I: H&E; A–C, E: Mallory trichrome. Scale bar – A: 500 µm, B, C, G: 200 µm, H: 100 µm, D–F: 50 µm.

Minor histopathological changes were also observed in the livers of infected fish (Figure S2). In both infected and uninfected fish, the liver exhibited a normal histological architecture, characterized by hepatocyte cords separated by small blood vessels and sinusoidal capillaries. However, the hepatocytes of infected fish showed mild anisocytosis with heterogenous cytoplasmic texture, showing more pale cytoplasm or mild vacuolation and occasionally enlarged and eccentric nuclei.
A certain degree of histological changes in the gill tissue was observed in infected fish (Figure S2). The gills of infected fish showed no signs of epithelial hyperplasia or fusion of secondary lamellae. However, a remarkable hyperplasia of mucous cells was present, especially in the apical parts of the primary lamellae and at the junctions between primary and secondary lamellae. Multifocal moderate to extensive detachment of the epithelium was present, possibly due to oedema or at least partially artefactual due to tissue processing. A mild mononuclear infiltrate, mainly lymphocytic, was also present.
Ultrastructure of Ichthyocotylurus erraticus capsule
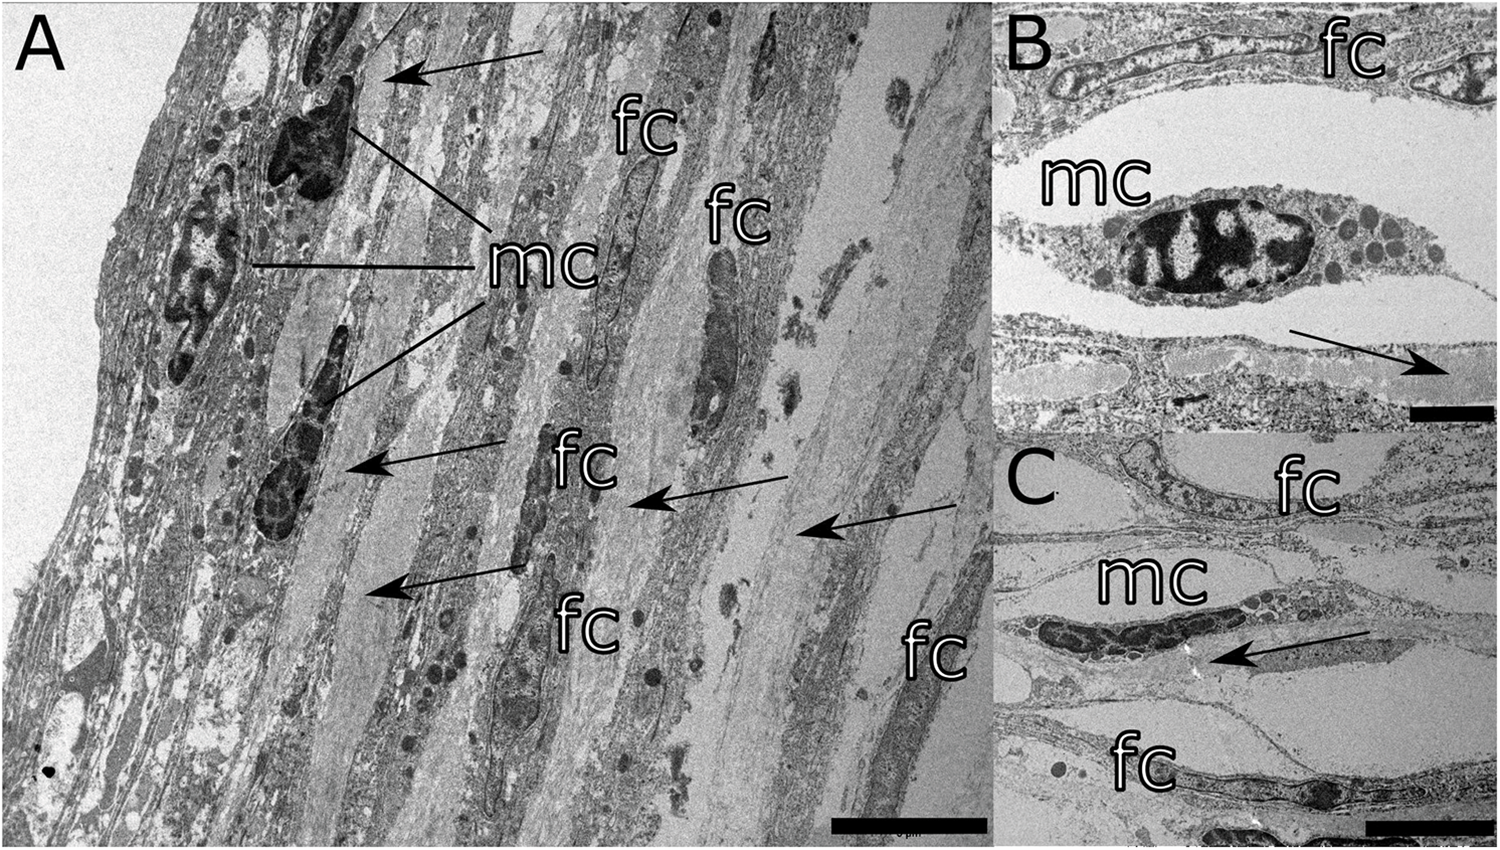
The capsule of encysted I. erraticus metacercariae is formed by relatively thin and friable layers of connective tissue, composed of collagen fibres, mostly present on the capsule periphery, cellular elements adjacent to the metacercarial body and the amorphous extracellular matrix, more abundant on the capsule periphery (Figure 3). Scarce cellular elements, scattered throughout the central part of the capsule, include fibrocytes and mast cells. In contrast, a more abundant and compact layer of fibroblasts and mast cells is visible in close proximity to the metacercaria. No erythrocytes or bleeding has been noticed close to or in the capsule.
Representative pictures of the transmission electron microscopy of the connective tissue capsule enveloping the metacercaria of Ichthyocotylurus erraticus Rudolphi 1809. (A) The capsule consists of multiple layers of collagen fibres (arrows) and interspersed fibrocytes (fc) and mast cells (mc); (B) and (C) Mast cell in the intercellular space surrounded by collagen fibres (arrows) and fibrocytes (fc). Scale bar – A, C: 5 µm, B: 2 µm.

Molecular identification of the parasite
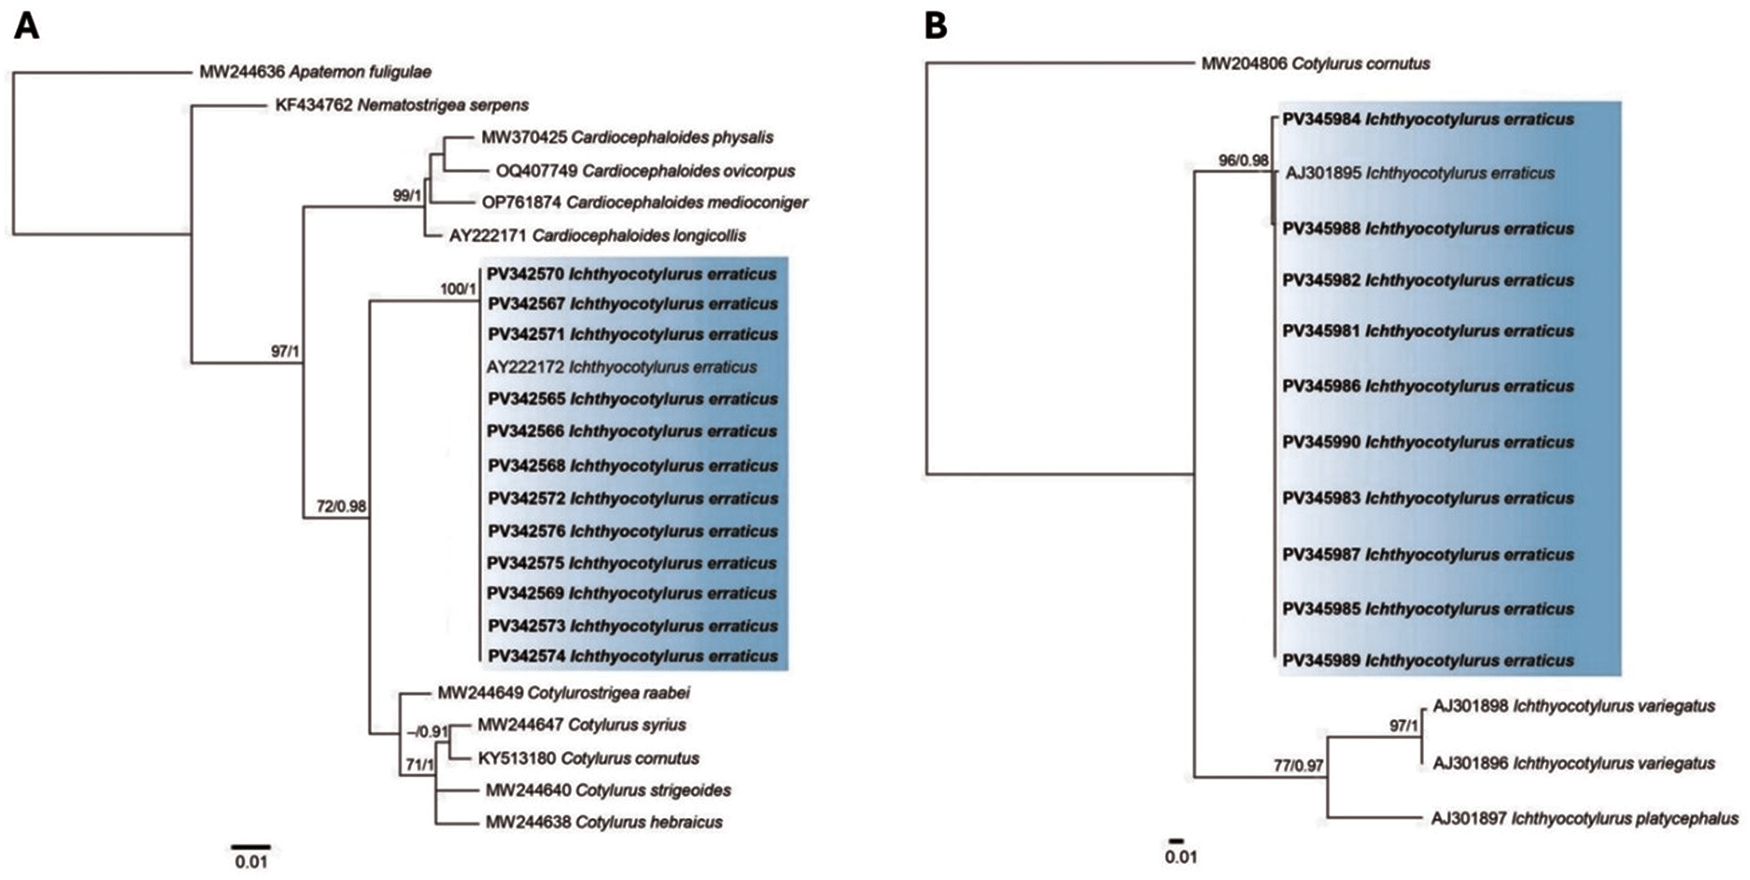
In total, 22 sequences (n = 12, 28S rDNA; n = 10, cox1) were newly generated for 12 isolates (2 cox1 sequences were excluded from analyses due to low quality) (Figure 4). Multiple sequence alignments revealed that all isolates collected from the heart of whitefish inhabiting Lake Sevan belong to I. erraticus, with only 2 haplotypes present among the 10 specimens. No ambiguities were present in any of the isolates.
Phylogenetic tree based on maximum likelihood (ML) analysis of (A) 28s rDNA sequence dataset of the Cotylurini tribe and (B) cox1 mtDNA sequence dataset of Ichthyocotylurus spp. Nodal support values are shown at the node as ML/BI (Bayesian inference). Support values <70 (ML) and 0.90 (BI) are not shown. Sequences obtained in the present study are highlighted in bold.

Figure 4 Long description
Two phylogenetic trees labeled A and B depict relationships among species using sequence datasets. Tree A shows a branching structure with several nodes and branches, each labeled with species names and sequence identifiers. The branches extend from a common ancestor, with some branches highlighted in blue, indicating sequences of Ichthyocotylurus erraticus. Tree B also displays a branching structure with species names and sequence identifiers, with a section highlighted in blue for Ichthyocotylurus erraticus. Both trees include scale bars indicating genetic distance and nodal support values are shown at various nodes. The trees illustrate evolutionary relationships and genetic distances among the species depicted.
Phylogenetic tree reconstruction based on the nuclear DNA locus (28S rDNA) confirmed the evolutionary relationships of I. erraticus within the Cotylurini tribe (Figure 4). The phylogenetic analysis inferred a strongly supported monophyletic clade comprising our I. erraticus sequences (PV342565–PV342576) and a reference sequence (AY222172) (Figure 4). The intraspecific variation showed low or no divergence, ranging between 0% and 0.09% (0–1 nt). The I. erraticus clade is nested within a Cardiocephaloides lineage, which includes Cardiocephaloides physalis (Lutz, 1927) (MW370425), C. ovicorpus Dubois & Angel, 1972 (OQ407749), C. medioconiger (Dubois & Vigueras, 1949) (OP761874) and C. longicollis (AY222171). Ichthyocotylurus erraticus forms a sister clade to the Cotylurostrigea-Cotylurus clade. At the same time, the latter shows polytomy supported at a slightly lower level (Figure 4). The interspecific variation between I. erraticus and other species of the tribe Cotylurini ranged from 1.1% to 10.4% (6–59 nt).
The phylogenetic tree based on the mitochondrial DNA locus (cox1) (Figure 4) inferred clustering of the Lake Sevan specimens (PV345981–PV345990) with the reference sequence of I. erraticus (AJ301895) with high support. The intraspecific genetic variation rates ranged between 0% and 1.9% (0–6 nt). Two species, namely Ichthyocotylurus variegatus (Creplin, 1825) (AJ301896, AJ301898) and I. platycephalus (Creplin, 1825) (AJ301897), formed a well-supported sister clade to I. erraticus. The interspecific divergence rates ranged between 9.6% and 13.1% (30–41 nt).
Effects of host traits and seasonality on Ichthyocotylurus erraticus in Lake Sevan whitefish
Effect of fish classes and seasonality
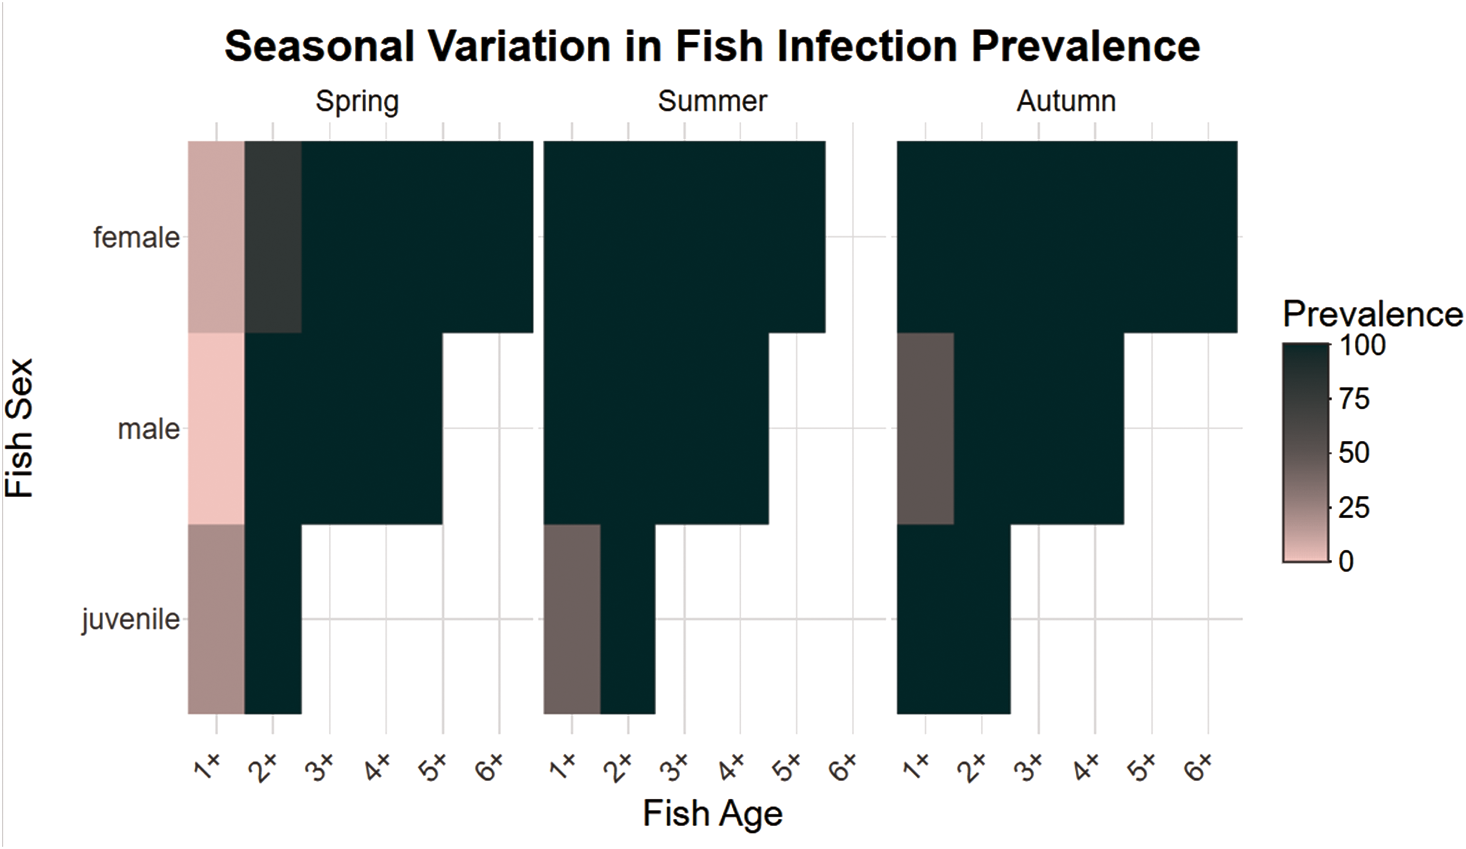
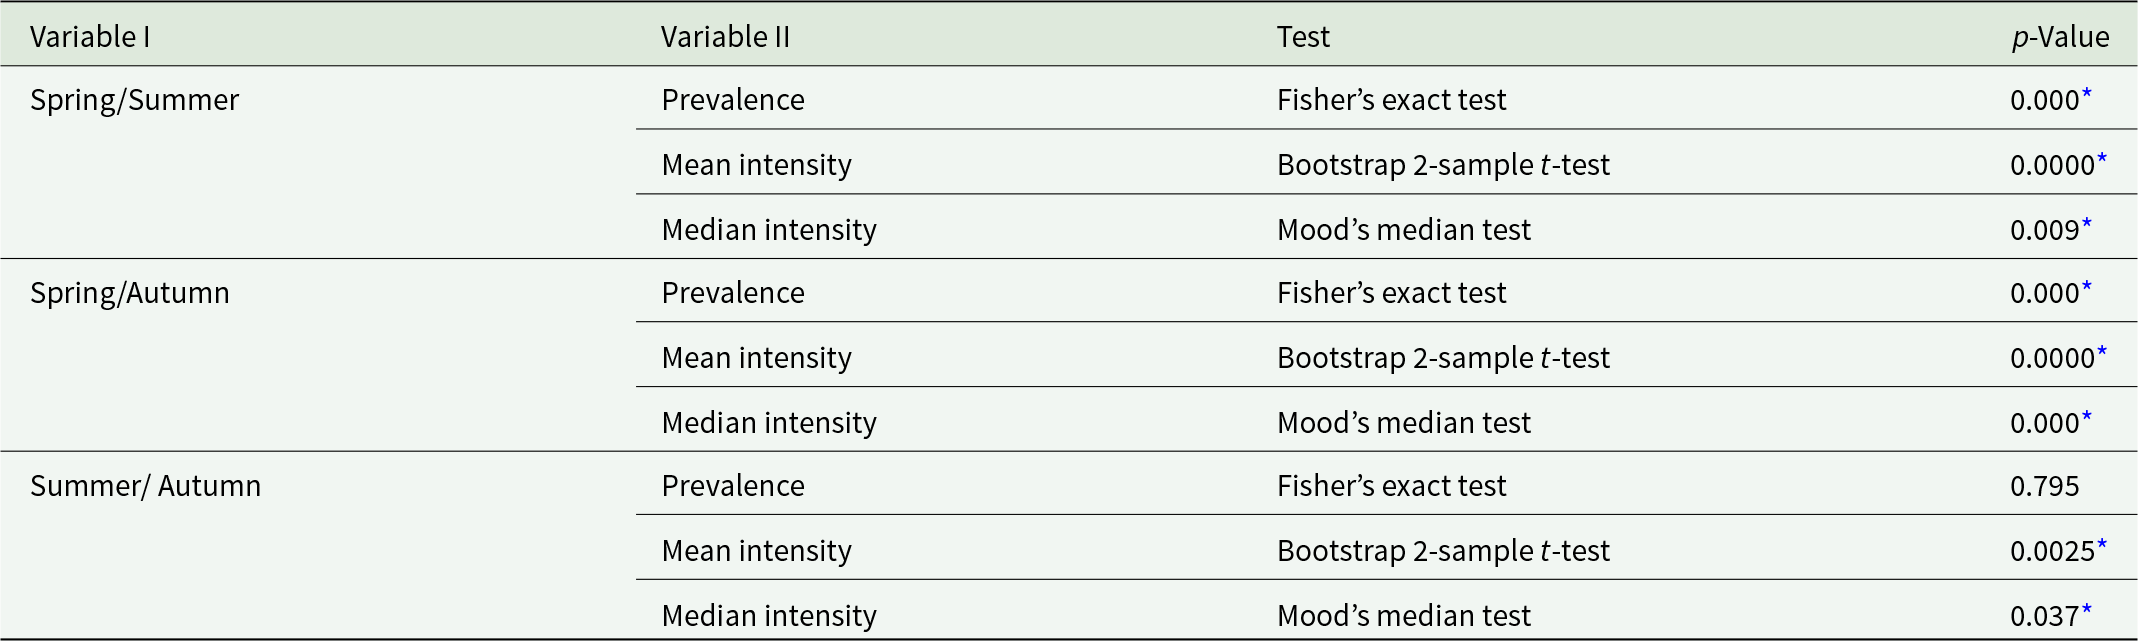
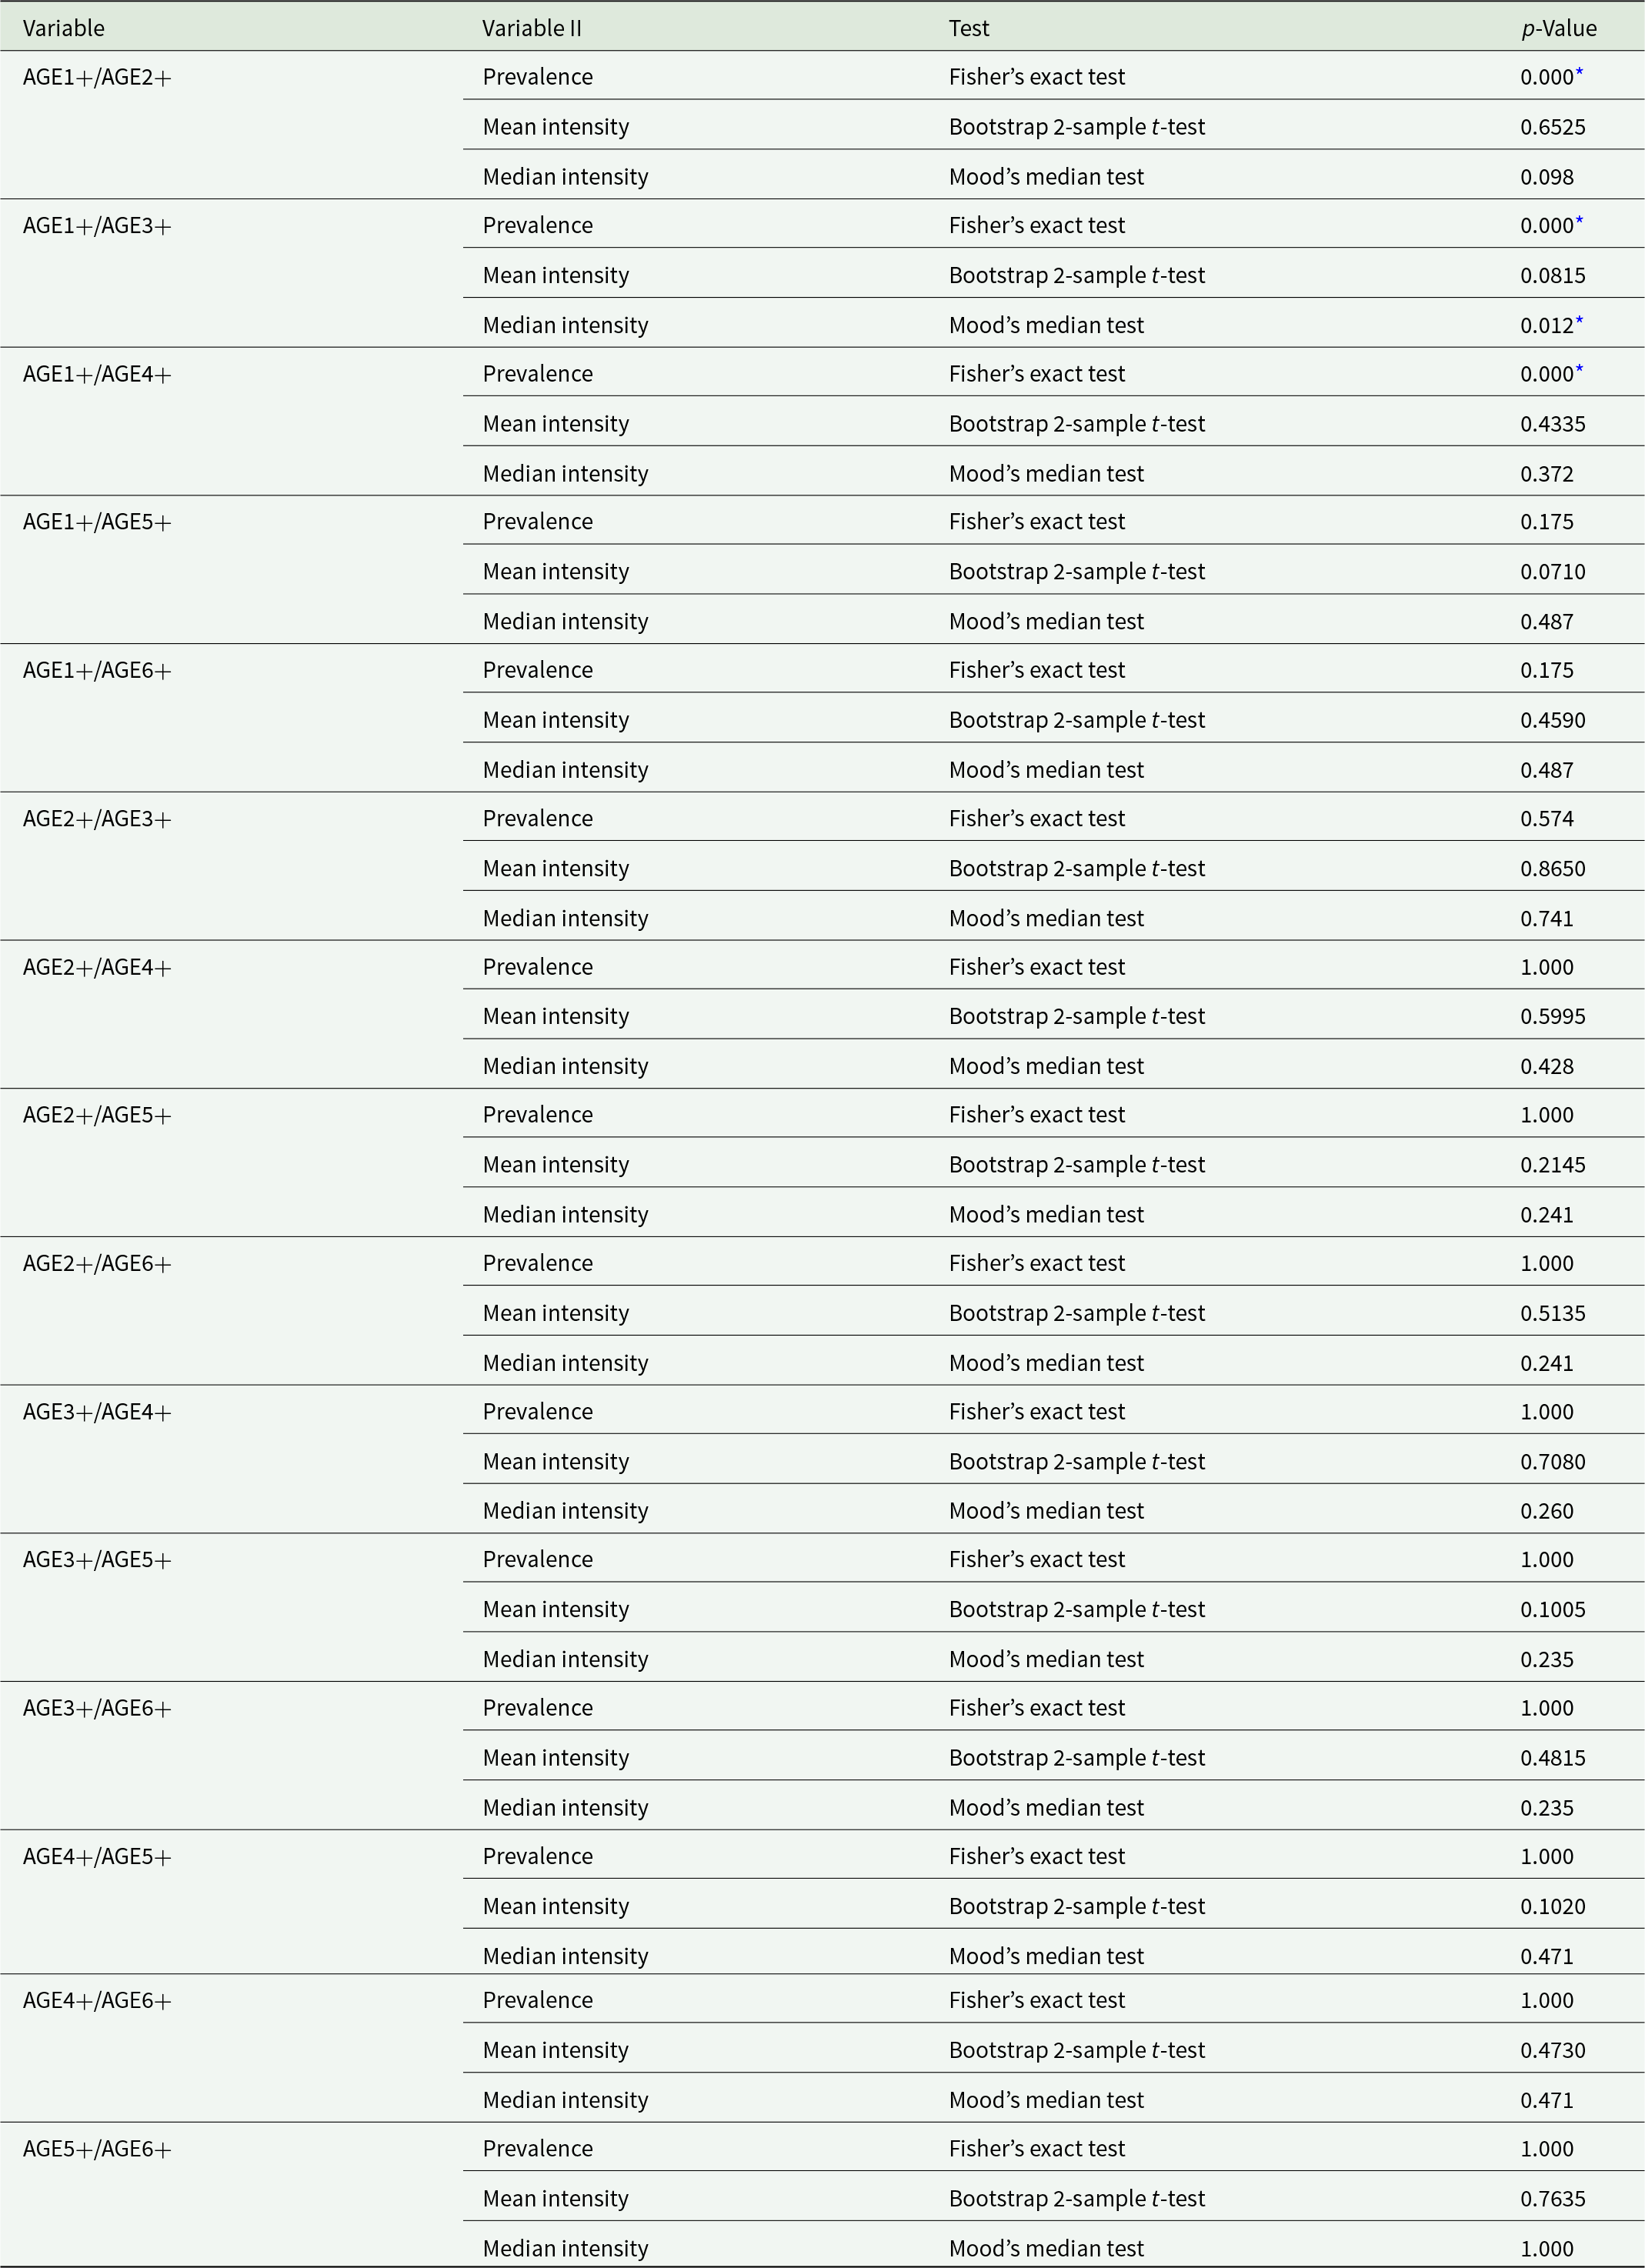
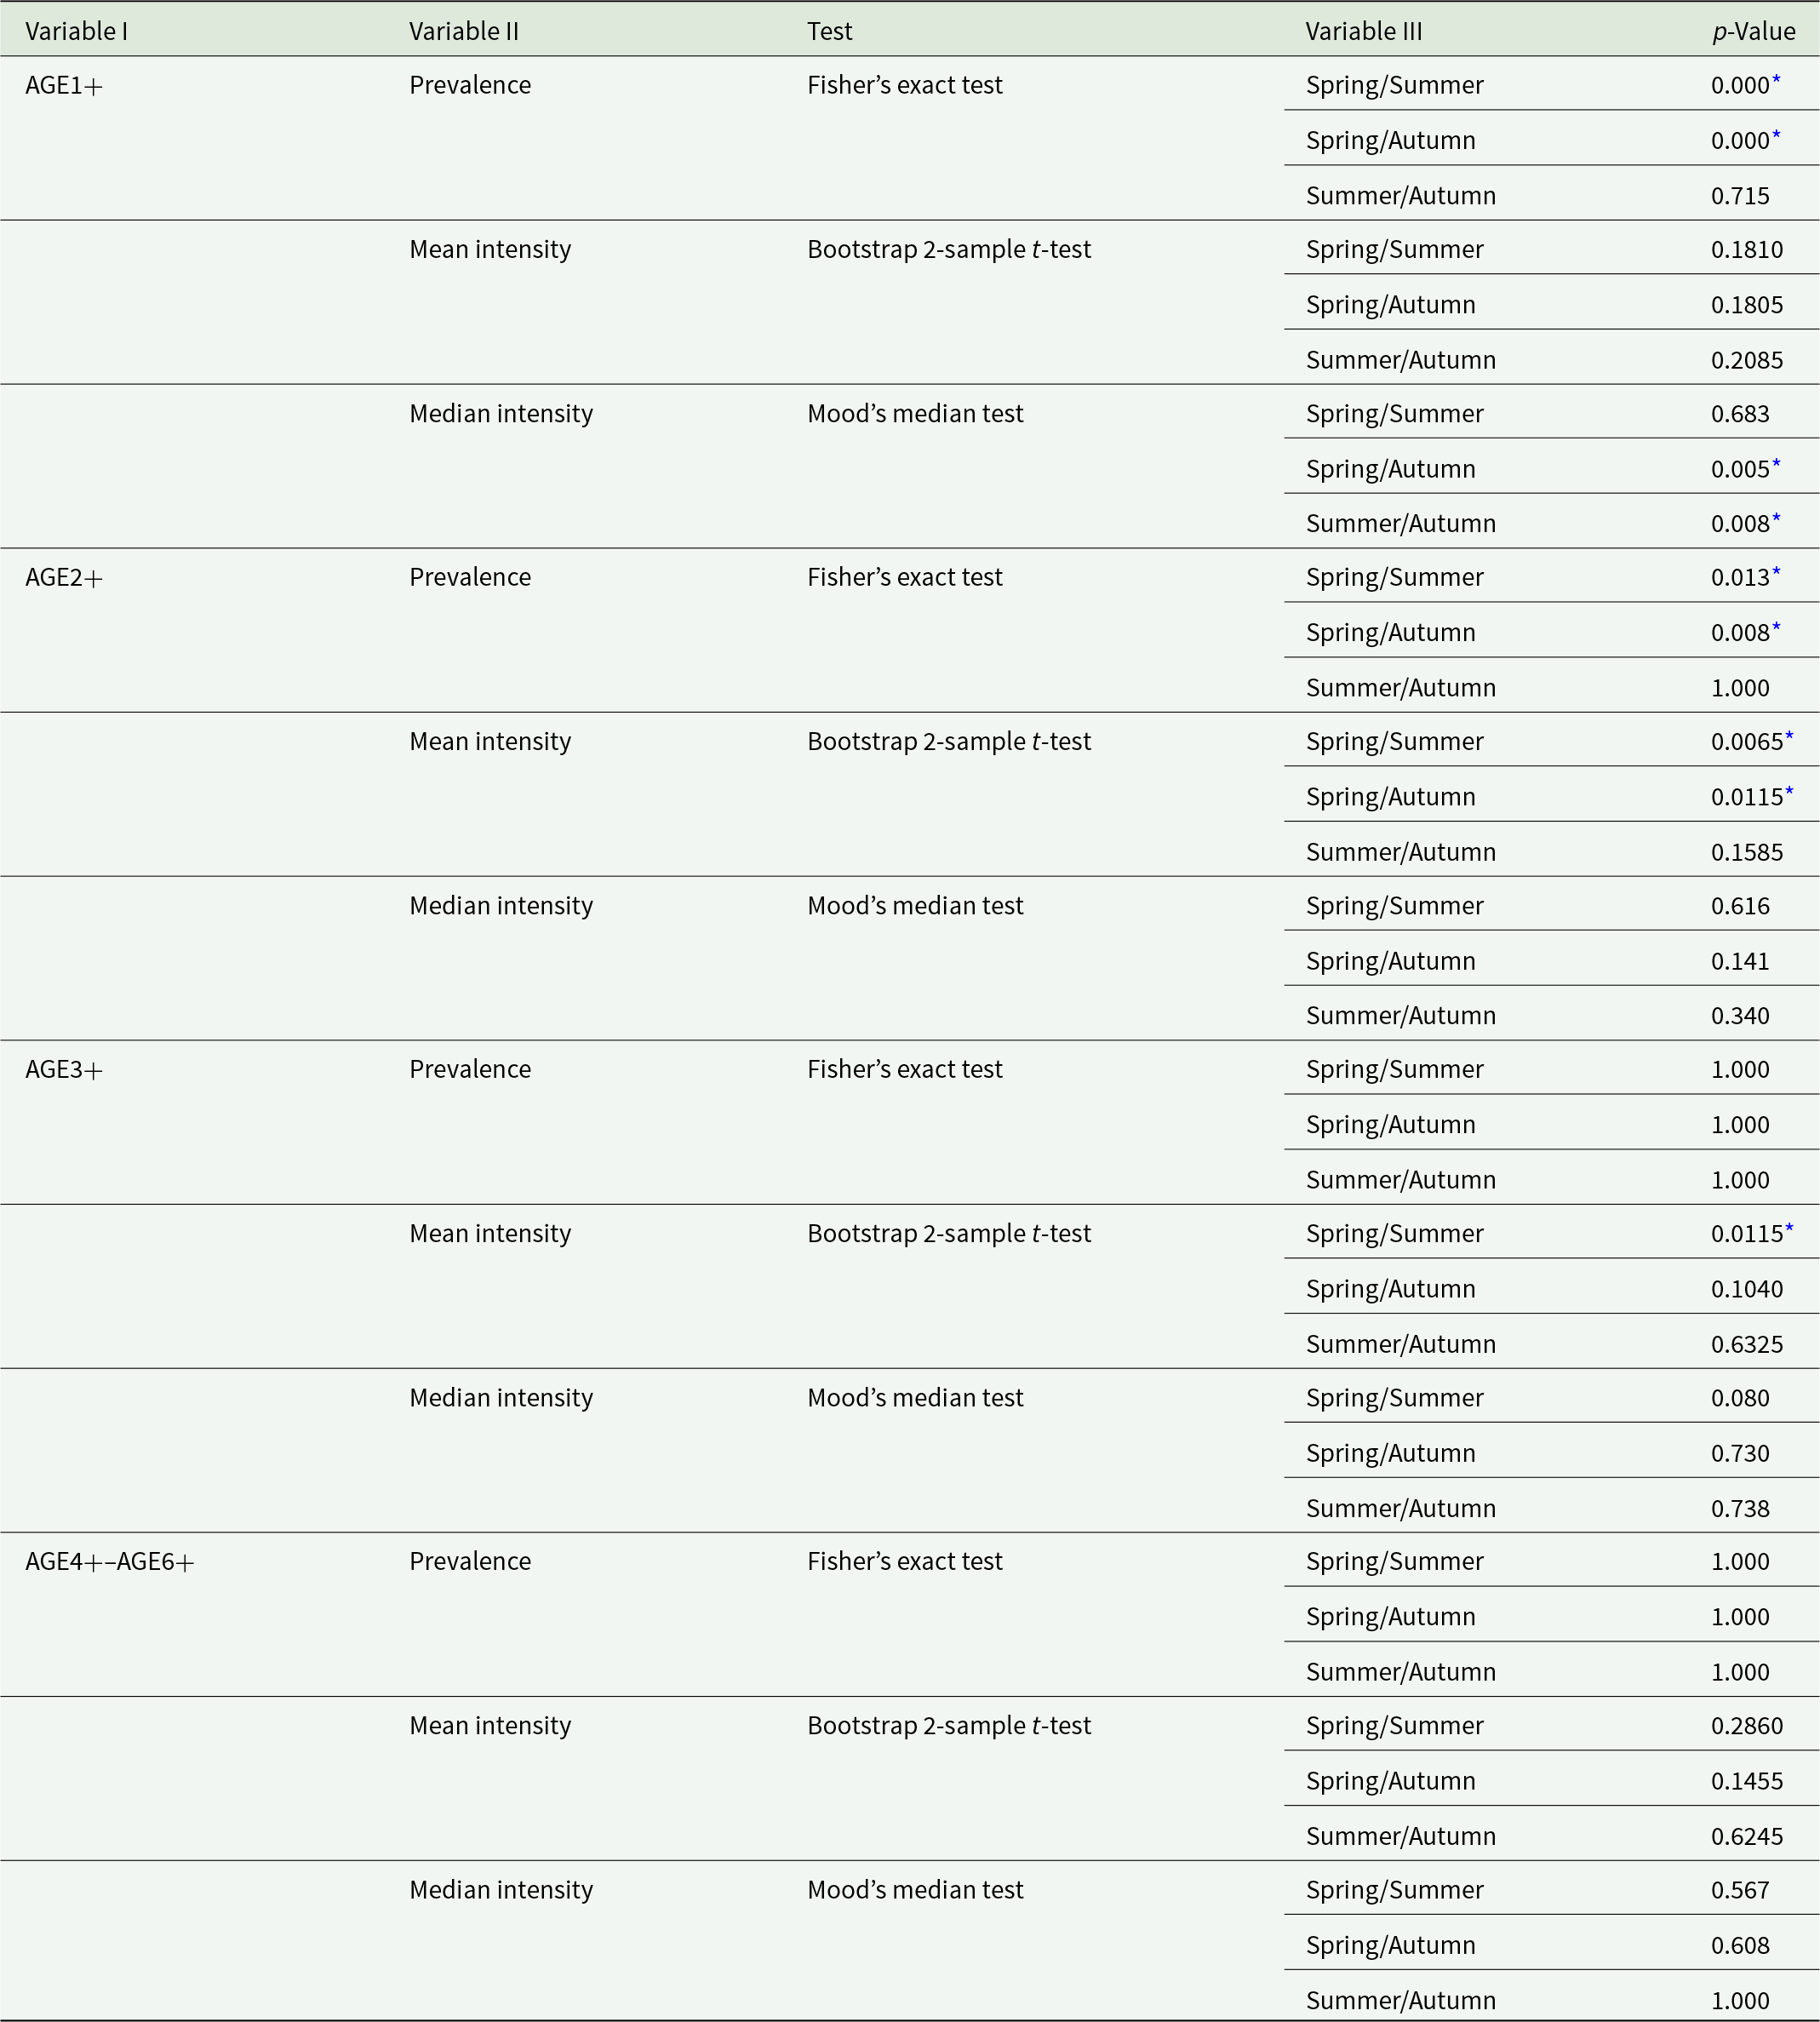
The prevalence (P) of I. erraticus in whitefish showed an increasing trend from spring (52%, 95% CI = 42.0–61.9) over the summer (92%, 95% CI = 84.7–96.2) and into autumn (97%, 95% CI = 91.6–99.2). Summer and autumn prevalence were approximately 1.8- and 1.9-fold higher than in spring (Figure 5, Table 1), showing significant differences between spring and the other 2 seasons (Table 3). All age classes (1+ to 6+) were infected, with prevalence reaching 100% in individuals aged 3+ and above (Figure 5, Table S4). The AGE1+ class showed a significantly lower prevalence than older age classes (AGE2+ to AGE4+) (p < 0.001, Table 4). Seasonal variation in prevalence was evident only among younger fish (AGE1+ and AGE2+ individuals). Prevalence was significantly lower in spring than in summer and autumn, while no significant difference was observed between summer and autumn (p > 0.05; Figure 5, Table 5). No significant seasonal variation was detected in AGE3+ and AGE4+ fish (p > 0.05).
Heatmap of infection prevalence by fish age, sex and season. The figure displays the prevalence of infection among fish, stratified by age classes (x-axis), sex (y-axis) and season (separate panels for spring, summer and autumn). Colour intensity reflects infection prevalence, ranging from low (pink) to high (dark green). Each tile represents the mean infection prevalence for a given subgroup. Notably, prevalence patterns vary across seasons, with higher rates observed in older age classes and during specific seasonal windows.

Comparison of differences in prevalence (Fisher’s exact test) and mean (bootstrap 2-sample t-test)/median (Mood’s median test) intensity of Ichthyocotylurus erraticus Rudolphi 1809 infection in total sample of whitefish Coregonus lavaretus Linnaeus, 1758 in Lake Sevan in spring, summer and autumn in 2024, respectively

Table 3 Long description
Pairwise seasonal comparisons are listed under Variable I, with Variable II giving prevalence, mean intensity, or median intensity, alongside the test name and p value. For Spring and Summer, prevalence uses Fishers exact test with p value 0.000 with an asterisk, mean intensity uses a Bootstrap two-sample t-test with p value 0.0000 with an asterisk, and median intensity uses Moods median test with p value 0.009 with an asterisk. For Spring and Autumn, prevalence uses Fishers exact test with p value 0.000 with an asterisk, mean intensity uses a Bootstrap two-sample t-test with p value 0.0000 with an asterisk, and median intensity uses Moods median test with p value 0.000 with an asterisk. For Summer and Autumn, prevalence uses Fishers exact test with p value 0.795 with no asterisk, mean intensity uses a Bootstrap two-sample t-test with p value 0.0025 with an asterisk, and median intensity uses Moods median test with p value 0.037 with an asterisk.
* Statistically significant difference at p < 0.05.
Comparison of differences in prevalence (Fisher’s exact test) and mean (bootstrap 2-sample t-test)/median (Mood’s median test) intensity of Ichthyocotylurus erraticus Rudolphi 1809 infection in the total sample of different age classes of whitefish Coregonus lavaretus Linnaeus 1758 in Lake Sevan in 2024, respectively

Table 4 Long description
Pairwise comparisons between age classes are listed under Variable, with outcomes under Variable II for prevalence, mean intensity, and median intensity, alongside the test used and the p value. For age1 plus versus age2 plus, prevalence uses Fishers exact test with p value 0.000 with an asterisk; mean intensity uses a bootstrap two sample t test with p value 0.6525; median intensity uses Moods median test with p value 0.098. For age1 plus versus age3 plus, prevalence p value is 0.000 with an asterisk; mean intensity p value is 0.0815; median intensity p value is 0.012 with an asterisk. For age1 plus versus age4 plus, prevalence p value is 0.000 with an asterisk; mean intensity p value is 0.4335; median intensity p value is 0.372. For age1 plus versus age5 plus, prevalence p value is 0.175; mean intensity p value is 0.0710; median intensity p value is 0.487, and for age1 plus versus age6 plus, prevalence p value is 0.175; mean intensity p value is 0.4590; median intensity p value is 0.487. For age2 plus versus age3 plus, prevalence p value is 0.574; mean intensity p value is 0.8650; median intensity p value is 0.741; for age2 plus versus age4 plus, prevalence p value is 1.000; mean intensity p value is 0.5995; median intensity p value is 0.428. For age2 plus versus age5 plus, prevalence p value is 1.000; mean intensity p value is 0.2145; median intensity p value is 0.241, and for age2 plus versus age6 plus, prevalence p value is 1.000; mean intensity p value is 0.5135; median intensity p value is 0.241. For age3 plus versus age4 plus, prevalence p value is 1.000; mean intensity p value is 0.7080; median intensity p value is 0.260; for age3 plus versus age5 plus, prevalence p value is 1.000; mean intensity p value is 0.1005; median intensity p value is 0.235; for age3 plus versus age6 plus, prevalence p value is 1.000; mean intensity p value is 0.4815; median intensity p value is 0.235. For age4 plus versus age5 plus, prevalence p value is 1.000; mean intensity p value is 0.1020; median intensity p value is 0.471; for age4 plus versus age6 plus, prevalence p value is 1.000; mean intensity p value is 0.4730; median intensity p value is 0.471. For age5 plus versus age6 plus, prevalence p value is 1.000; mean intensity p value is 0.7635; median intensity p value is 1.000.
* Statistically significant difference at p < 0.05.
Comparison of differences in prevalence (Fisher’s exact test) and mean (bootstrap 2-sample t-test)/median (Mood’s median test) intensity of Ichthyocotylurus erraticus Rudolphi 1809 infection in the total sample of different age classes of whitefish Coregonus lavaretus Linnaeus 1758 in different seasons in Lake Sevan in 2024, respectively

Table 5 Long description
Columns list Variable I, Variable II, Test, Variable III, and p value for seasonal pairwise comparisons within age classes age1 plus, age2 plus, age3 plus, and age4 plus to age6 plus. For age1 plus prevalence using Fishers exact test, p values are 0.000 for spring versus summer, 0.000 for spring versus autumn, and 0.715 for summer versus autumn; mean intensity using a bootstrap two sample t test has p values 0.1810, 0.1805, and 0.2085; median intensity using Moods median test has p values 0.683, 0.005, and 0.008. For age2 plus prevalence, p values are 0.013, 0.008, and 1.000; mean intensity p values are 0.0065, 0.0115, and 0.1585; median intensity p values are 0.616, 0.141, and 0.340. For age3 plus prevalence, all three p values are 1.000; mean intensity p values are 0.0115, 0.1040, and 0.6325; median intensity p values are 0.080, 0.730, and 0.738. For age4 plus to age6 plus prevalence, all three p values are 1.000; mean intensity p values are 0.2860, 0.1455, and 0.6245; median intensity p values are 0.567, 0.608, and 1.000. Some p values include an asterisk marker.
* Statistically significant difference at p < 0.05.
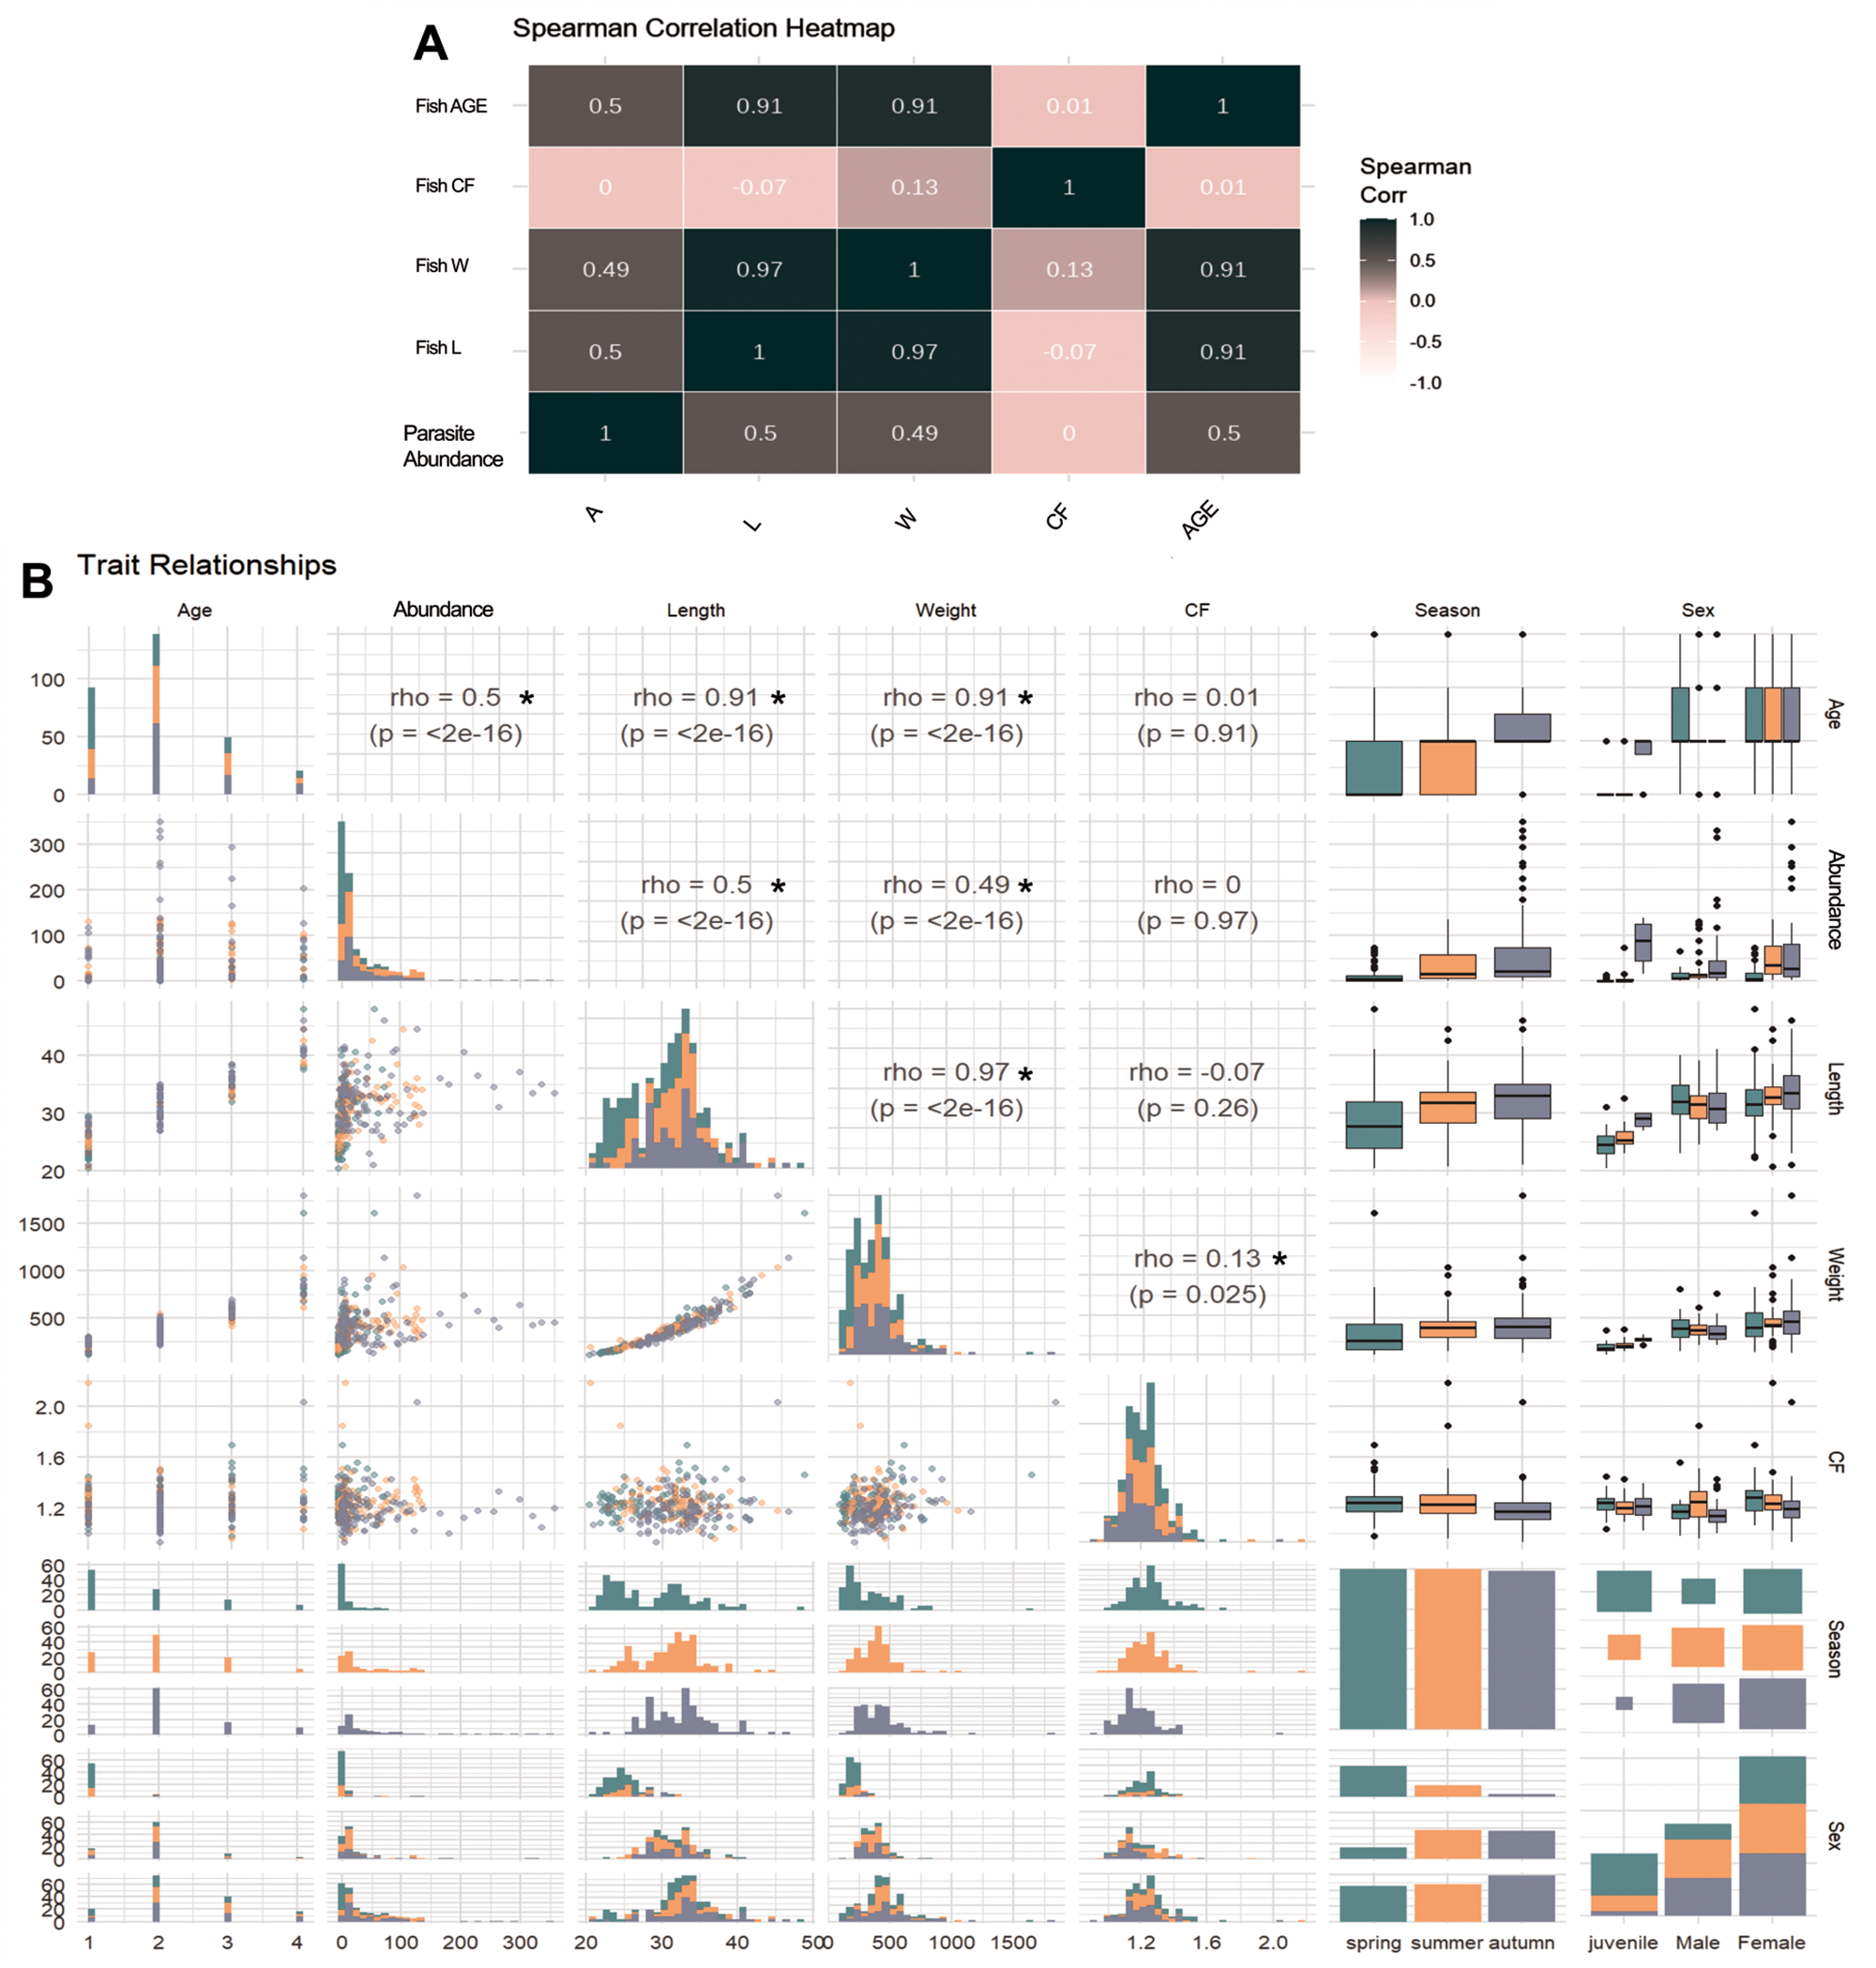
Furthermore, we investigated the effects of different variables on the parasite abundance in fish from Lake Sevan. Overall, a positive correlation was reported between several variables (Figure 6). For example, parasite abundance showed positive and significant correlation with fish age, fish length and weight (rho ∼ 0.5, p <0.0001, Figure 6); however, high collinearity was detected between fish age and fish length and weight (both variables rho = 0.91, Figure 6). In contrast, fish conditional factor shows only a significant correlation with fish weight variable; however, the effect size was very small, indicating that the relationship is biologically negligible (Figure 6).
Visualization of the abundance of parasites infecting heart fish and trait relationships. (A) Panel showing a Spearman correlation heatmap among continuous variables, with strength and direction of correlation indicated by colour intensity. (B) GGpairs plot panel presenting pairwise scatterplots, density distributions and Spearman’s correlation coefficients (rho) with associated p-values among traits, including parasite abundance (A), fish: age (AGE), length (L), weight (W) and condition factor (CF). Categorical comparisons are visualized for season and sex. This multi-panel figure supports exploration of trait interdependencies and group sample sizes across predictor levels. Statistical significance was set at p < 0.05.

Figure 6 Long description
A Spearman correlation heatmap. The title reads, Spearman Correlation Heatmap. The grid compares Parasite Abundance, Fish L, Fish W, Fish CF and Fish AGE. Each cell contains a correlation value. The diagonal cells show 1. The visible off diagonal values include 0.5, 0.49, 0.45, 0.13, 0.01, 0, minus 0.07, 0.91 and 0.97. A vertical legend at the right is labeled, Spearman Corr, with tick labels 1.0, 0.5, 0, minus 0.5 and minus 1.0. The image B showing a trait relationships matrix titled, Trait Relationships. The matrix includes multiple small plots arranged by variable pairs. The continuous variables shown include Abundance, Age, Length, Weight and CF. Diagonal cells show distributions as overlaid histograms for each continuous variable. Off diagonal cells show scatterplots with many points. Several upper triangle cells include text annotations with rho and p. Visible examples include rho equals 0.5 with p less than 2e minus 16, rho equals 0.91 with p less than 2e minus 16, rho equals 0.49 with p less than 2e minus 16, rho equals 0.01 with p equals 0.91, rho equals 0.07 with p equals 0.26 and rho equals 0.13 with p equals 0.025. At the right side of the matrix are grouped boxplots for categorical variables labeled Season and Sex, aligned against the continuous variables. Season shows four category labels, spring, summer, autumn and winter. Sex shows two category labels, Male and Female. No axis labels with units are visible for the small plots.
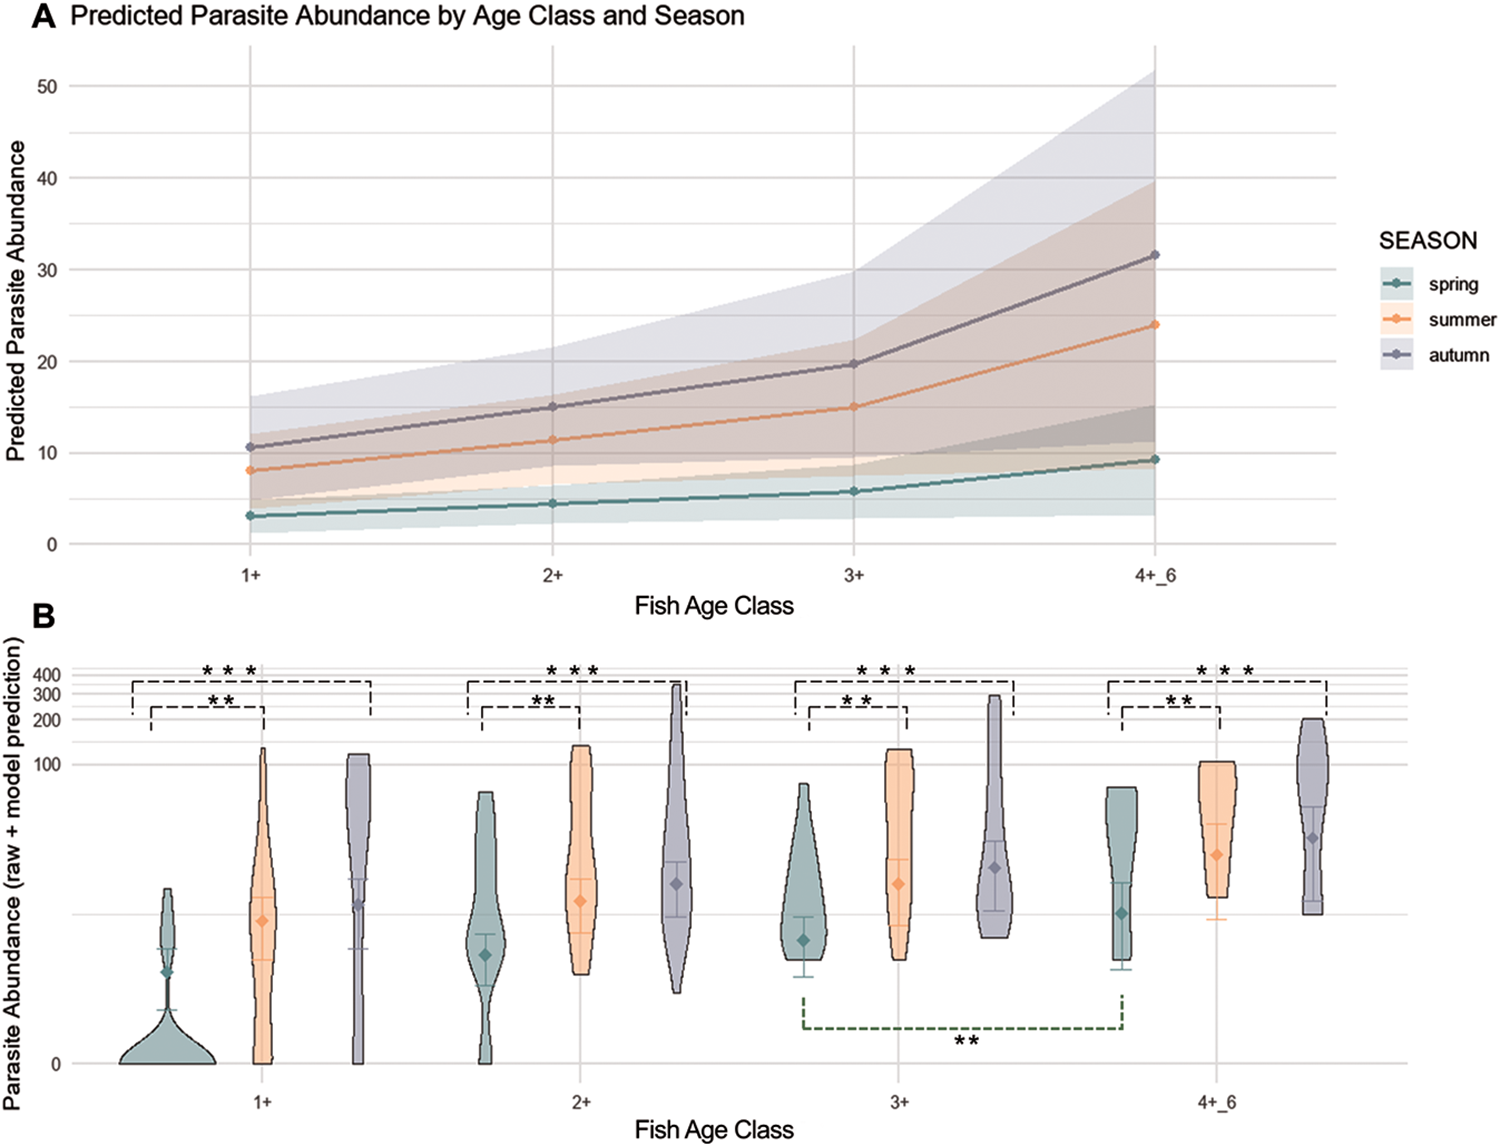
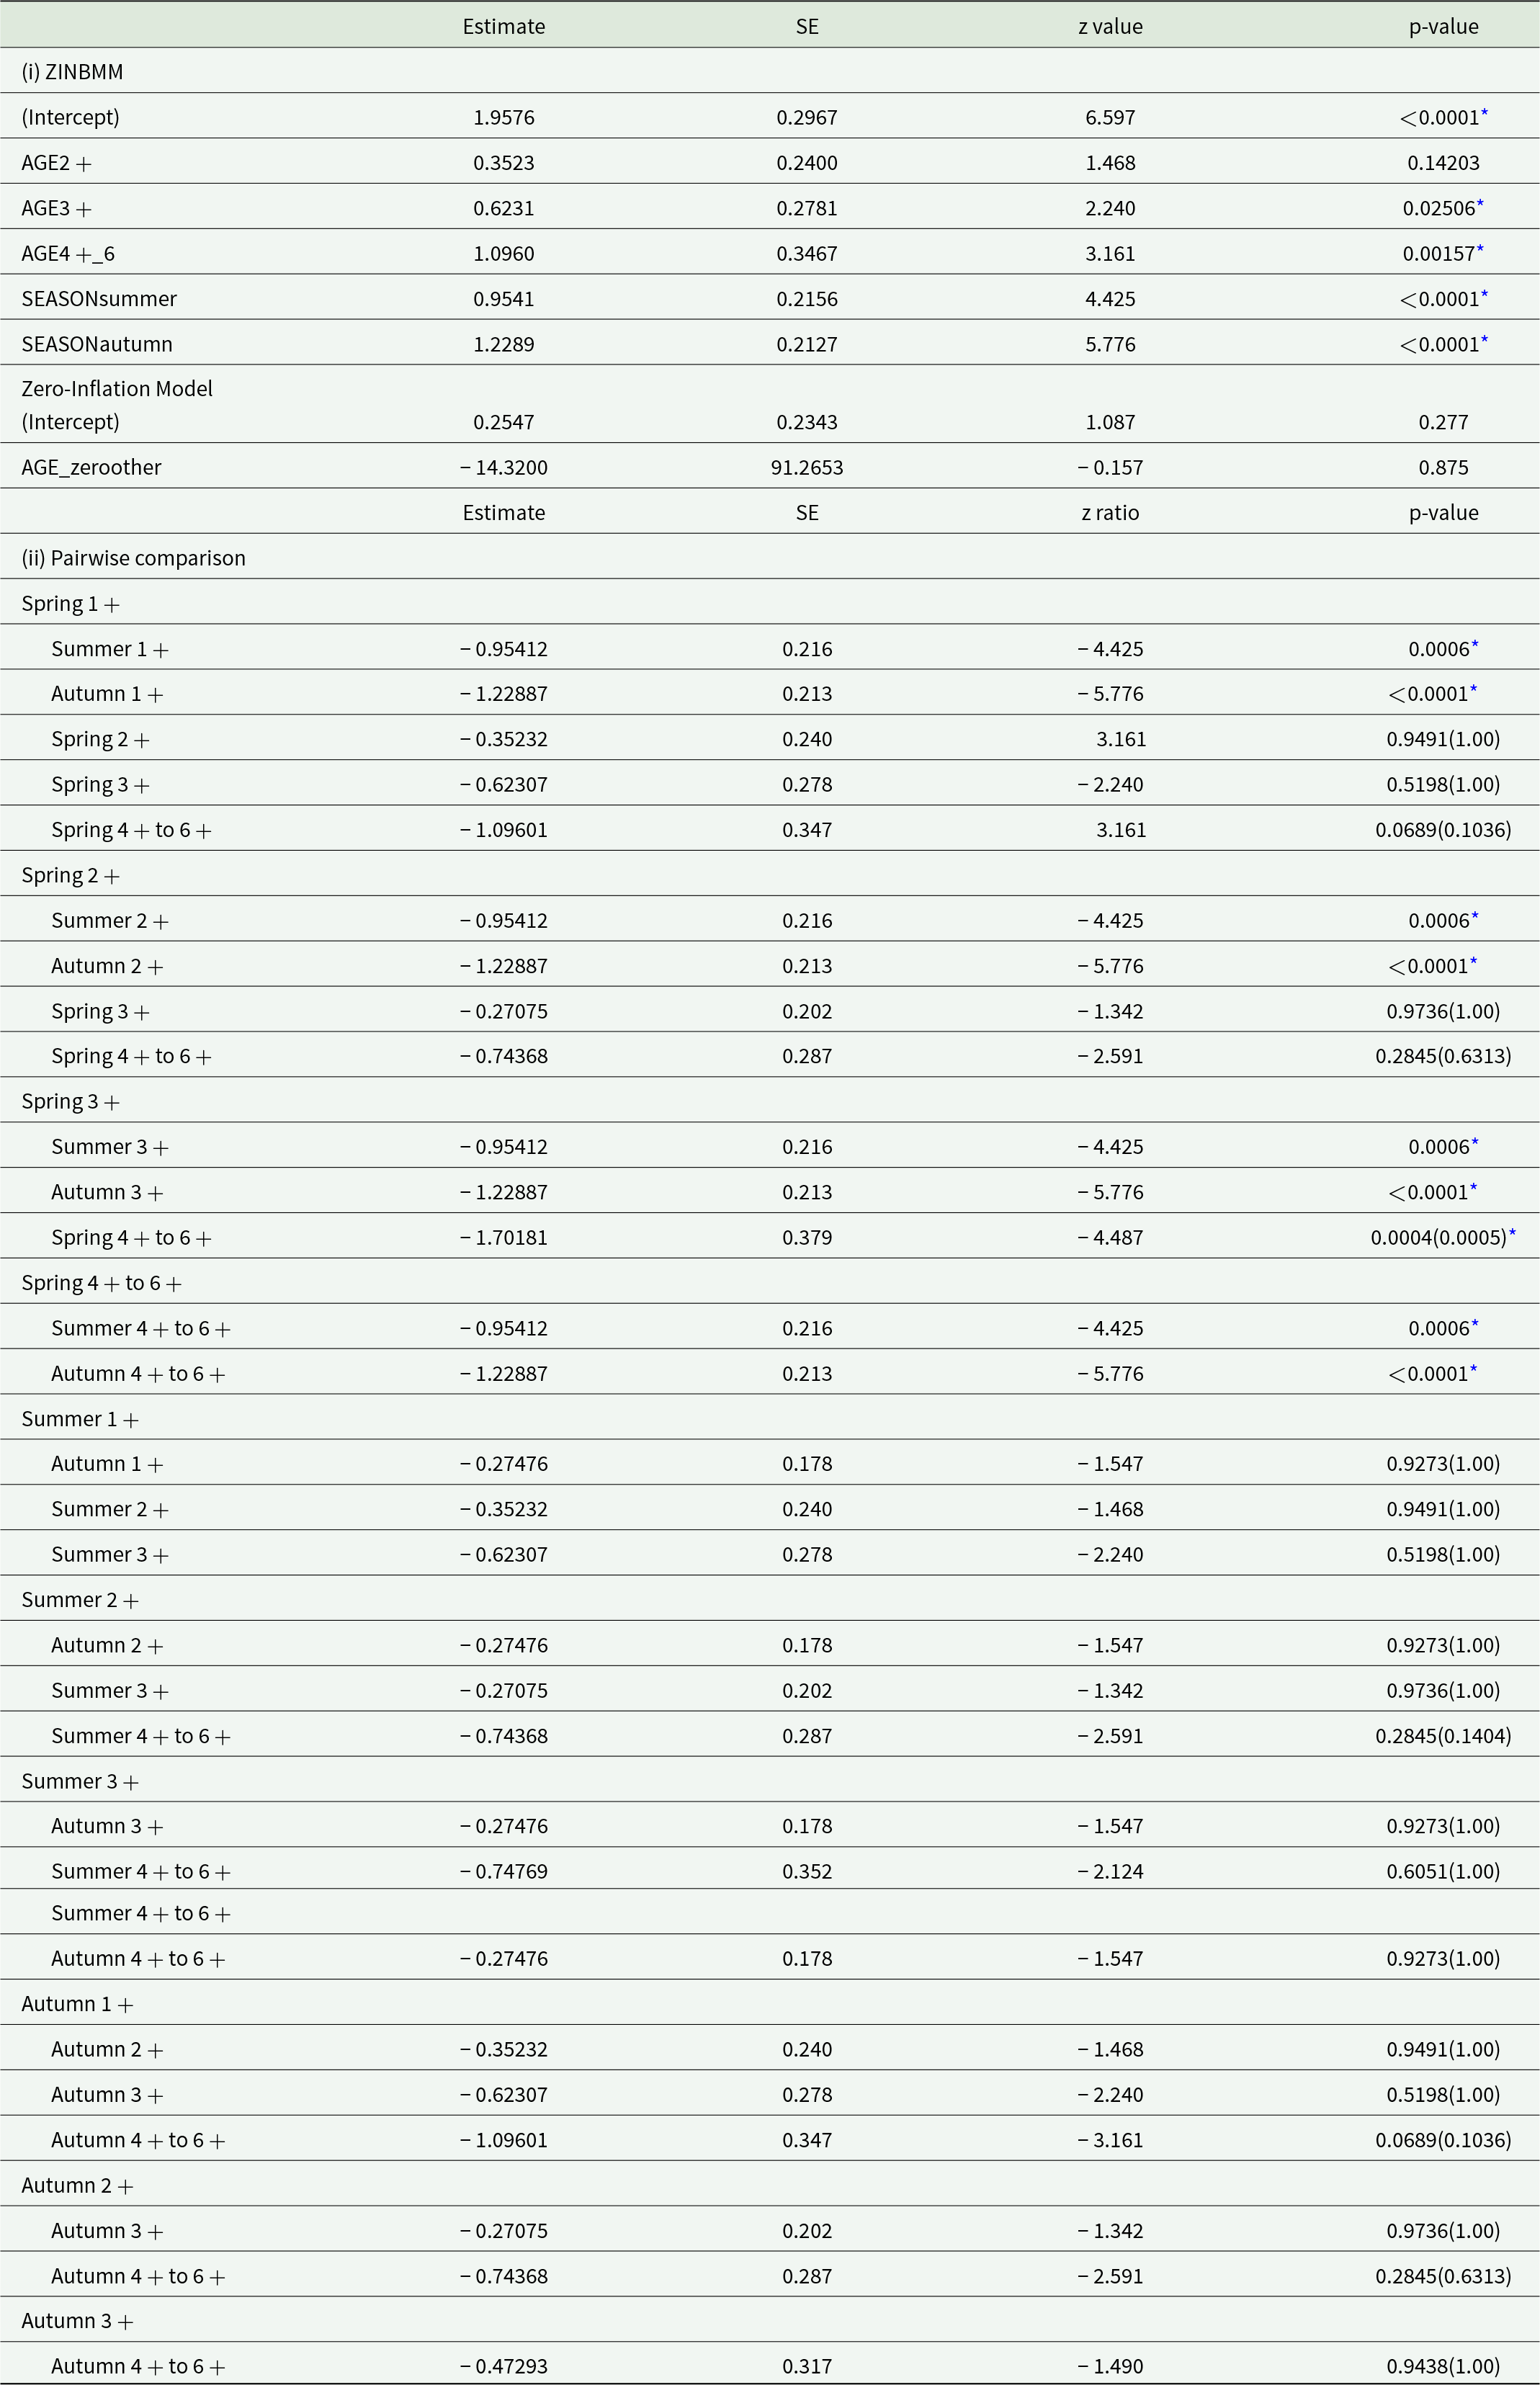
When investigating the effects of host age and seasonality on I. erraticus infection in Lake Sevan, results showed a strong seasonal effect on parasite abundance, with significantly higher counts in summer and autumn relative to spring (2.60 and 3.42 times higher, respectively; both p <0.0001; Table 6). In contrast, the effect of age was weaker. It only showed significant differences when comparing fish above AGE3+ to the youngest fish class (AGE1+), i.e. parasite loads were 1.86 times higher in AGE3+ and 2.99 times higher in AGE4-6+ (p = 0.025, p = 0.0016, respectively, Figure 7, Table 6). Pairwise comparisons confirmed significant seasonal contrasts in parasite abundance across age classes (Table 6, Figure 7). Fish in the AGE1+ class in spring showed significantly fewer parasites compared to both summer and autumn (p = 0.0006, p <0.0001, respectively, Table 6). This seasonal effect remained consistent across older age classes (Figure 7). For example, AGE4+ to 6+ fish had approximately 3.4 times fewer parasites in spring than in autumn (p <0.0001; Figure 7; Table 6). In contrast, only a few within-season age-related differences were detected: spring AGE4-6+ fish had 5.48 times as many parasites as spring AGE3+ specimens (p = 0.0004, Table 6), highlighting a potential cumulative age effect. No significant differences were observed between summer and autumn within any age class (p > 0.05). The zero-inflation component of the model, which estimates the probability of structural zeros, revealed no significant effects of age (p = 0.875; Table 6), indicating minimal influence of age on the likelihood of parasite absence.
Predicted and observed parasite abundance in relation to age class and season. The figure summarizes results from a zero-inflated negative binomial generalized linear mixed model (ZINBMM) fitted using glmmTMB. The top panel shows predicted parasite abundance across age classes (1+, 2+, 3+, 4–6+) for each season (spring, summer, autumn), with 95% confidence intervals derived from the conditional model component (A ∼ Fish AGE + SEASON + (1|obs)). The bottom panel displays violin plots of raw and model-predicted parasite counts, illustrating the distributional spread and central tendencies (diamonds indicate means) by age class and season. The zero-inflation component (ziformula = ∼AGE_zero) accounts for excess zeros based on age-related covariates. The model used the nbinom2 family with optimization via the BFGS method and included a random intercept for observation ID to control for repeated measures or individual-level variation. This figure illustrates both modelled expectations and observed variability in parasite burden patterns.

Figure 7 Long description
A line graph with the title, Predicted Parasite Abundance by Age Class and Season. The horizontal axis label is, Fish Age Class, with tick labels, 1 plus, 2 plus, 3 plus, 4 dash 6 plus. The vertical axis label is, Predicted parasite abundance, with a numeric scale from 0 to 50. A legend label reads, Season, with entries, spring, summer, autumn. Three lines are plotted across the four age classes, each with a shaded band around the line. The spring line rises from about 5 at 1 plus to about 8 at 2 plus, about 12 at 3 plus and about 25 at 4 dash 6 plus. The summer line rises from about 3 at 1 plus to about 4 at 2 plus, about 5 at 3 plus and about 10 at 4 dash 6 plus. The autumn line rises from about 2 at 1 plus to about 3 at 2 plus, about 4 at 3 plus and about 6 at 4 dash 6 plus. The image B showing grouped violin plots with the horizontal axis label, Fish Age Class, with tick labels, 1 plus, 2 plus, 3 plus, 4 dash 6 plus. The vertical axis label is, Parasite abundance, with a numeric scale from 0 to 50. For each age class, three adjacent violins appear, corresponding to the three seasons shown in the legend in image A. Each violin includes a central marker and a vertical line. Above the violins are bracket annotations with asterisks. The violins for 1 plus include one narrow violin concentrated near 0, one violin extending to about 40 and one violin extending to about 50. The violins for 2 plus include one violin centered around about 15 to 25, one violin extending to about 40 and one violin extending to about 50. The violins for 3 plus include one violin centered around about 10 to 20, one violin extending to about 40 and one violin extending to about 50. The violins for 4 dash 6 plus include one violin centered around about 15 to 25, one violin extending to about 40 and one violin extending to about 50.
Evaluation of the effect of age, classes and seasonality on parasite abundance of captured fish in Lake Sevan. Results of (i) zero-inflated negative binomial mixed model (ZINBMM) (abundance of parasite ∼ AGE + SEASON + obs (random)) and (ii) pairwise comparisons evaluating the effect of season and age classes on count-based outcome on the variable response (abundance of parasite observed in fish)

Table 6 Long description
Results are reported for a zero inflated negative binomial mixed model and for pairwise comparisons, with columns for estimate, SE, z value or z ratio, and p value. In the model count component, the intercept estimate is 1.9576 with SE 0.2967, z value 6.597, and p value less than 0.0001 with an asterisk. Age class estimates are 0.3523 for age 2 plus with p value 0.14203, 0.6231 for age 3 plus with p value 0.02506 with an asterisk, and 1.0960 for age 4 plus to 6 plus with p value 0.00157 with an asterisk. Season estimates are 0.9541 for seasonsummer with p value less than 0.0001 with an asterisk, and 1.2289 for seasonautumn with p value less than 0.0001 with an asterisk. In the zero inflation model, the intercept estimate is 0.2547 with p value 0.277, and age zeroother has estimate minus 14.3200 with SE 91.2653, z value minus 0.157, and p value 0.875. Pairwise comparisons list contrasts across season within each age class and across age classes within each season; significant p values with asterisks occur for summer versus spring and autumn versus spring in age 1 plus, age 2 plus, age 3 plus, and age 4 plus to 6 plus, and for spring 4 plus to 6 plus versus spring 3 plus with p value 0.0004 and adjusted p value 0.0005.
The analysis accounts for overdispersed count data with excess zeros using a 2-component model: a conditional (count) component that estimates the effect of SEASON and AGE on non-zero counts, and a zero-inflation component that models the probability of structural zeros. The model further includes a random intercept term for ‘obs’ to account for fish individual variability. The variable AGE includes several classes, with AGE1+ set as the reference group (intercept). The intercept in the ZINBMM represents the log count of parasite abundance in the AGE+ 1 class, to which the other age classes are compared. The estimate of each AGE class is added to the intercept. The zero-inflation component estimates the likelihood that an observation is a structural zero. Coefficients for the zero model are also provided, with AGE effects modelled through the variable AGE_zeroother, indicating group-specific probabilities of producing zeros. Pairwise comparisons between age (adjustment with Tukey and Bonferroni in between parentheses when different) are reported based on estimated marginal means on the log scale. Random effect for obs (n = 299). Dispersion parameter = 2.00. Statistically significant results (at α = 0.050) are indicated by an asterisk (*), with the corresponding p-value reported.
* Statistically significant difference at p < 0.05.
These results indicate that both host age and seasonal variation significantly influence parasite abundance in Lake Sevan fish, with season being the dominant driver, amplified by cumulative age-related exposure. The highest burdens were observed in older individuals during summer and autumn. In contrast, spring consistently showed the lowest infection levels across age classes (Figure 7). ZINBMM analysis confirmed that these patterns were not driven by zero inflation or individual heterogeneity. The model yielded a dispersion parameter of 2.00, indicating an appropriate fit for the data (Table 6).
Effect of fish sex and gonadal development
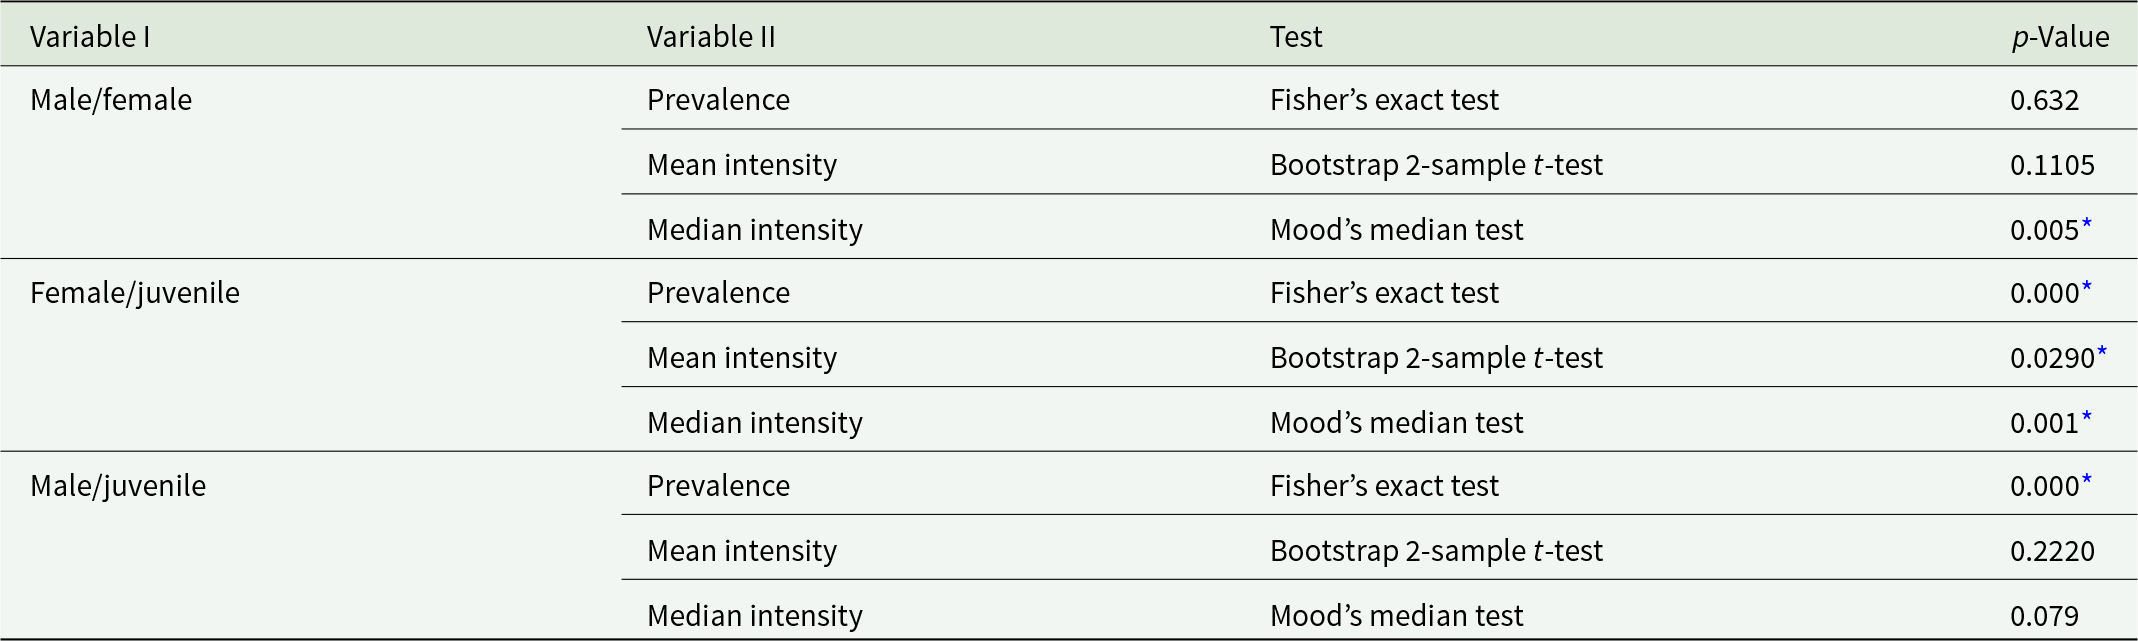
Significant differences in median intensity, but not in prevalence or mean intensity and abundance, were found between infected adult females and males. Measures of aggregation (variance-to-mean ratio and k) were also very similar, indicating comparable levels of parasite overdispersion in males and females. However, only the prevalence significantly differed between infected adult females and males and undetermined specimens (stage I of gonadal development) (Table 7).
Comparison of differences in prevalence (Fisher’s exact test) and mean (bootstrap 2-sample t-test)/median (Mood’s median test) intensity of Ichthyocotylurus erraticus Rudolphi 1809 infection in the total sample of different sex groups of whitefish Coregonus lavaretus Linnaeus 1758 in Lake Sevan in spring, summer and autumn in 2024, respectively

Table 7 Long description
P values compare sex group pairs across three outcomes, prevalence, mean intensity, and median intensity, with the test type listed for each outcome. For male and female, prevalence uses Fishers exact test with p value 0.632, mean intensity uses a Bootstrap two sample t test with p value 0.1105, and median intensity uses Moods median test with p value 0.005 marked with an asterisk. For female and juvenile, prevalence uses Fishers exact test with p value 0.000 marked with an asterisk, mean intensity uses a Bootstrap two sample t test with p value 0.0290 marked with an asterisk, and median intensity uses Moods median test with p value 0.001 marked with an asterisk. For male and juvenile, prevalence uses Fishers exact test with p value 0.000 marked with an asterisk, mean intensity uses a Bootstrap two sample t test with p value 0.2220, and median intensity uses Moods median test with p value 0.079.
* Statistically significant difference at p < 0.05.
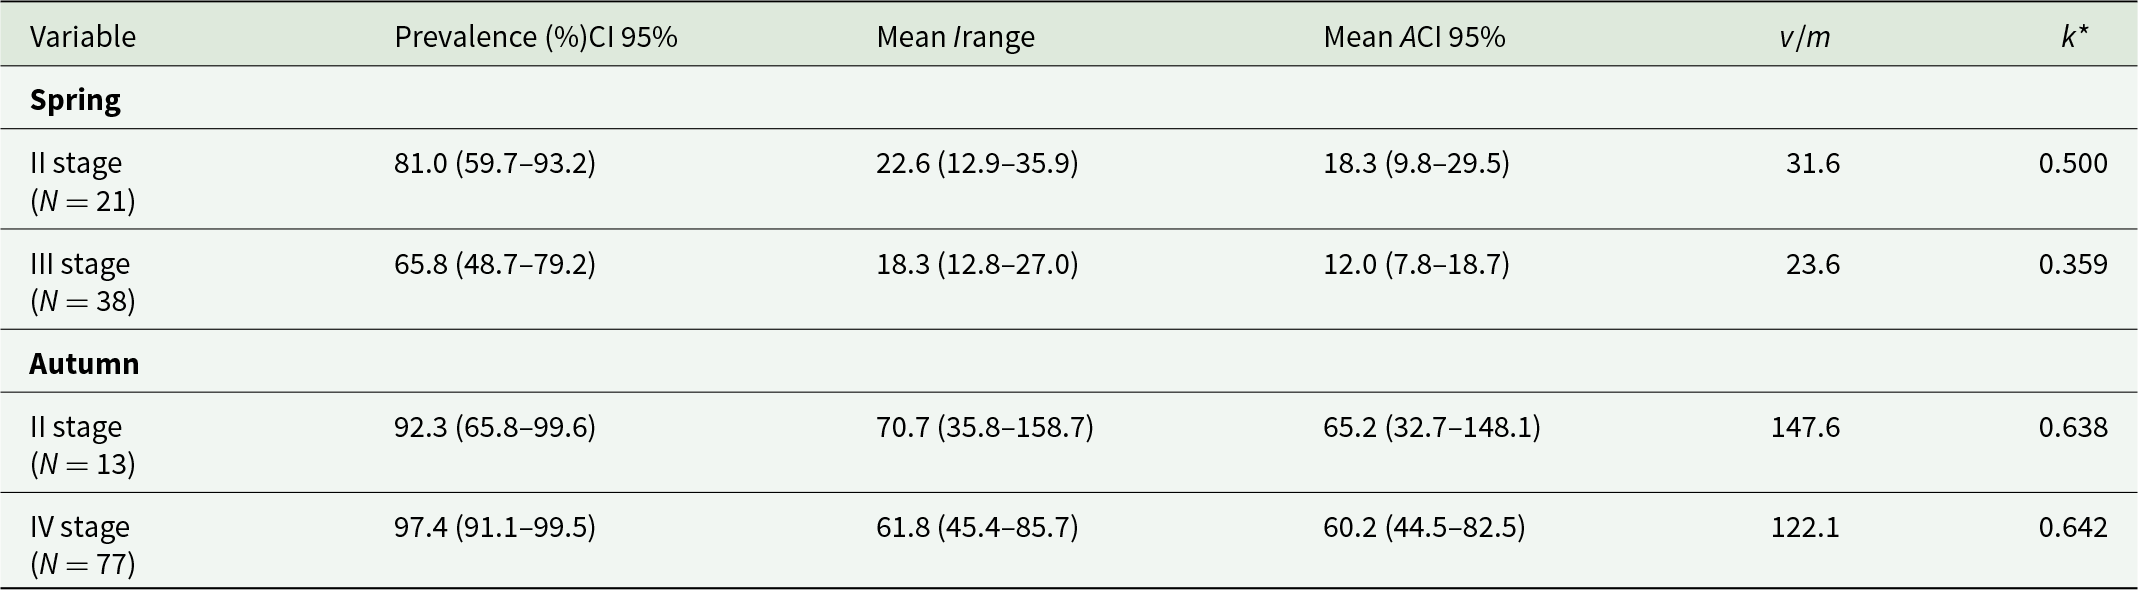
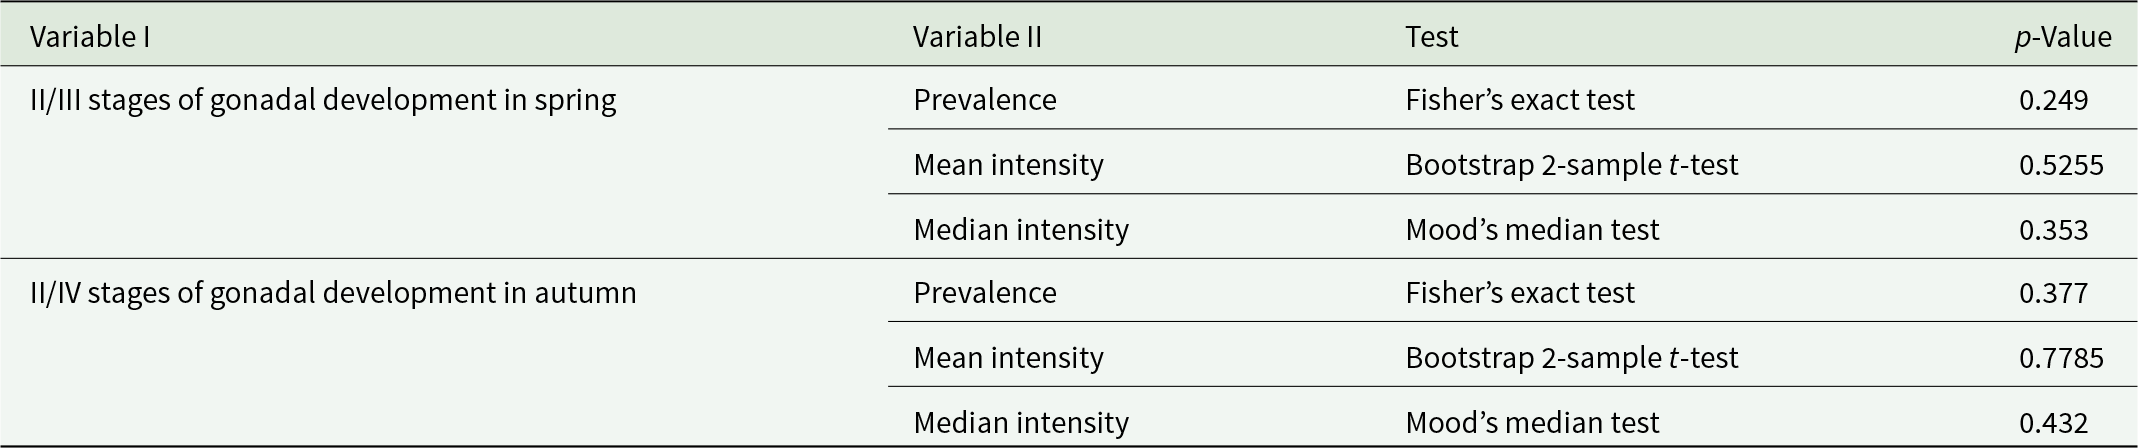
The prevalence, mean intensity and median intensity were not statistically different between stages II and III of gonadal development in spring and between stages II and IV in autumn (Tables 8 and 9).
Total mean prevalence (%) with Stern’s exact 95% confidence limits (CI), mean intensity (I) and mean abundances with bootstrap 95% CI (A) Ichthyocotylurus erraticus Rudolphi 1809 infection in the total sample of II, III and IV stages of gonadal development of whitefish Coregonus lavaretus Linnaeus 1758 in Lake Sevan in spring and autumn in 2024

Table 8 Long description
Measures prevalence percent with 95 percent confidence limits, mean intensity with range, mean abundance with 95 percent confidence limits, plus v over m and k star, by season and gonadal stage. Spring includes II stage with N 21 and III stage with N 38. Spring II stage reports prevalence 81.0 with CI 59.7 to 93.2, mean I 22.6 with range 12.9 to 35.9, mean A 18.3 with CI 9.8 to 29.5, v over m 31.6, and k star 0.500. Spring III stage reports prevalence 65.8 with CI 48.7 to 79.2, mean I 18.3 with range 12.8 to 27.0, mean A 12.0 with CI 7.8 to 18.7, v over m 23.6, and k star 0.359. Autumn includes II stage with N 13 and IV stage with N 77. Autumn II stage reports prevalence 92.3 with CI 65.8 to 99.6, mean I 70.7 with range 35.8 to 158.7, mean A 65.2 with CI 32.7 to 148.1, v over m 147.6, and k star 0.638; autumn IV stage reports prevalence 97.4 with CI 91.1 to 99.5, mean I 61.8 with range 45.4 to 85.7, mean A 60.2 with CI 44.5 to 82.5, v over m 122.1, and k star 0.642.
Comparison of differences in prevalence (Fisher’s exact test) and mean (bootstrap 2-sample t-test)/median (Mood’s median test) intensity of Ichthyocotylurus erraticus Rudolphi 1809 infection in the total sample of II/III and II/IV stages of gonadal development of whitefish Coregonus lavaretus Linnaeus 1758 in Lake Sevan in spring and autumn in 2024, respectively

Table 9 Long description
Variables are grouped by, II/III stages of gonadal development in spring and, II/IV stages of gonadal development in autumn, with columns for Variable II, Test, and p value. For II/III stages of gonadal development in spring, Prevalence uses Fishers exact test with p value 0.249. In the same spring group, Mean intensity uses a Bootstrap two-sample t-test with p value 0.5255, and Median intensity uses Moods median test with p value 0.353. For II/IV stages of gonadal development in autumn, Prevalence uses Fishers exact test with p value 0.377. In the same autumn group, Mean intensity uses a Bootstrap two-sample t-test with p value 0.7785, and Median intensity uses Moods median test with p value 0.432.
Discussion
Ichthyocotylurus erraticus geographic distribution
This study represents the easternmost record of I. erraticus, confirmed to date by molecular tools, and extends the known geographic range of this species into Armenia. In Lake Sevan, the parasite is not limited to only the introduced whitefish, which is currently the most commercially important fish species in Armenia, but has also been reported in endemic taxa, Sevan trout and Sevan scraper (Voropaeva et al., Reference Voropaeva, Tolstenkov and Oganesyan2010), suggesting that it has been well established within the ecosystem. In Lake Sevan, the definitive host of I. erraticus is considered to be the common mallard Anas platyrhynchos Linnaeus 1758, whose population is abundant in the region and present year-round (Balian et al., Reference Balian, Ghasabian, Adamian and Klem2002; Movsessian et al., Reference Movsessian, Chubarian and Nikoghosian2004; Balyan et al., Reference Balyan, Ghasabyan, Nikogosyan and Petrosyan2017), suggesting its contribution to the completion of the parasite’s life cycle all year round. The first intermediate host of I. erraticus in Lake Sevan has not yet been identified. In other geographic regions, freshwater snails have been reported as the first intermediate hosts of this parasite (Harrod and Griffiths, Reference Harrod and Griffiths2005a; Pieters et al., Reference Pieters, Hoyer, Verstappen, Wolters, Ijzer, de Jong, Cremers and Kik2014); however, the specific snail species involved in the local life cycle remains unknown.
Infection intensities observed in Lake Sevan (2–373 metacercariae per fish) were intermediate compared with those reported for other European coregonid populations. In C. lavaretus from Loch Lomond (Scotland), metacercariae of I. erraticus were mainly located on the bulbus arteriosus, with intensities ranging from 2 to 200 parasites per fish (Dezfuli et al., Reference Dezfuli, Giari, Simoni, Shinn, Manera and Bosi2005). In contrast, whitefish C. autumnalis Pallas, 1776 in Lake Neagh (Ireland) were heavily infected, with 100% prevalence and median infection intensities exceeding 600 per fish, located in the pericardial cavity (Harrod and Griffiths, Reference Harrod and Griffiths2005a).
Metacercarial morphology
The metacercariae from I. erraticus in Lake Sevan correspond morphologically and morphometrically to a specific tetracotyle type characteristic of this species, as described by Niewiadomska (Reference Niewiadomska, Gibson, Jones and Bray2002) in Gibson’s key and Avdeev et al. (Reference Avdeev, Bauer and Bykhovskaya-pavlovskaya1987). The size of both the body and the cyst falls within the range reported for this species: I. erraticus cysts typically measure 510–770 × 420–510 µm (length × width), while excysted metacercariae measure 320–430 × 300–400 µm. In comparison, cysts of I. pileatus Rudolphi 1802 are smaller (290–480 × 270–440 µm), and I. platycephalus and I. variegatus have larger cysts (570–700 × 490–630 µm and 570–720 × 490–630 µm, respectively), presenting an indicative trait for in-field species differentiation.
Molecular identification
Although I. erraticus has historically been recorded in Lake Sevan (Mailyan, Reference Mailyan1956; Pavlova, Reference Pavlova1957; Vartanyan, Reference Vartanyan1993; Tolstenkov, Reference Tolstenkov2007; Voropaeva and Tolstenkov, Reference Voropaeva and Tolstenkov2008; Voropaeva et al., Reference Voropaeva, Tolstenkov and Oganesyan2010), these records were based exclusively on morphological characteristics, with no molecular data available for this region until now. The present study addresses this gap by providing the first molecular data for I. erraticus from Armenia, supported by morphological analysis, enriching the relatively scarce molecular knowledge of the genus Ichthyocotylurus. In addition to the morphological findings, molecular analysis based on both nuclear (28S rDNA) and mitochondrial (cox1) markers revealed strong genetic homogeneity within the Armenian I. erraticus population, indicating that the specimens from this location belong to a single lineage. The data indicate minimal genetic divergence among populations of the species across its known range in Northern Europe (including Scotland, Northern Ireland and Finland). This suggests a lack of barriers to gene flow, likely facilitated by migratory birds, with the consequent close genetic relatedness of the population in Lake Sevan to other European populations (Bell et al., Reference Bell, Sommerville and Valtonen2001; Faltynková et al., Reference Faltynková, Jouet, Nielsen and Skírnisson2024). However, the genetic information available in public databases is sparse, and further sampling is necessary to understand the mechanisms underlying this homogeneity.
Within the genus Ichthyocotylurus, 4 species are recognized: I. pileatus, I. erraticus, I. platycephalus and I. variegatus (Bell et al., Reference Bell, Sommerville and Valtonen2001). The 2 haplotypes of I. erraticus identified in Armenia form a single, well-supported clade with reference sequences. At the same time, other taxa within the Cotylurini tribe are distinctly separated, as previously reported by Faltynková et al. (Reference Faltynková, Jouet, Nielsen and Skírnisson2024). While Bell et al. (Reference Bell, Sommerville and Valtonen2001) characterized 4 Ichthyocotylurus species using both nuclear (ribosomal internal transcribed spacer regions ITS1 and ITS2) and mitochondrial markers (cox1), the latter was generated by universal digenean primers designed for Fasciola hepatica (Bowles et al., Reference Bowles, Blair and Mcmanus1995) and yielded a 366-bp-long fragment. Although only the 314 bp region was used for phylogenetic analysis due to limitations in available reference data, we amplified a longer cox1 fragment (781 bp), which was submitted to GenBank to provide more robust genetic information for future phylogenetic analyses of Ichthyocotylurus species.
Histopathological and ultrastructural findings
The histopathological analysis of liver, gill and heart of Sevan whitefish revealed only mild to moderate tissue alterations. The metacercariae were mainly encysted in the epicardium and pericardium, surrounded by well-organized fibrous capsules rich in collagen. The observed fibrosis and mild mononuclear infiltrates are typical of long-term host adaptation to trematode infections and are consistent with descriptions of Ichthyocotylurus metacercariae in other fish species (Orecka-Grabda, Reference Orecka-Grabda1991; Dezfuli et al., Reference Dezfuli, Giari, Simoni, Shinn, Manera and Bosi2005). Ultrastructural observations further confirmed the fibrotic encapsulation of metacercariae, with fibroblast and mast cell activity, but without signs of vascular damage or haemorrhage. These findings suggest that, although infections are heavy, they do not cause immediate physiological impairment or mortality in adult fish. Nevertheless, cumulative fibrotic changes could affect cardiac performance in extreme cases or in combination with other stressors.
The presence of mild anisocytosis and eccentric nuclei in livers of infected fish indicates a low-grade reactive or metabolic change that likely reflects the systemic effects of the infection on hepatic metabolism and possibly circulatory status. However, further analyses, such as gene expression studies, would be required to confirm these changes at the molecular level. Together with only mild epithelial alterations observed in the gills, these findings suggest that the infection remains largely localized to the cardiac tissues of Sevan whitefish (Orecka-Grabda, Reference Orecka-Grabda1991; Dolezel and Crompton, Reference Dolezel and Crompton2000; Dezfuli et al., Reference Dezfuli, Giari, Simoni, Shinn, Manera and Bosi2005). None of the previous studies focused on gill pathology, while only Orecka-Grabda (Reference Orecka-Grabda1991) evaluated the liver histopathology, among other organs, and reported more pronounced pathological changes than those observed in the present study, including necrotic foci in the hepatic parenchyma, pyknotic nuclei, karyorrhexis, haemorrhages and mild inflammatory infiltrates.
As the primary organ responsible for metabolism, energy storage, detoxification and immune regulation, the liver is highly responsive to physiological stress and is widely regarded as a sensitive indicator of fish health. Hepatic lesions suggest sublethal pathological effects of I. erraticus infection even in the absence of direct site parasitism (Hinton and Laurén, Reference Hinton and Laurén1990; Bernet et al., Reference Bernet, Schmidt, Meier, Burkhardt-holm and Wahli1999; Roberts, Reference Roberts2012). Observed alterations (anisocytosis, heterogeneous cytoplasmic texture and eccentric nuclei) may reflect systemic host responses to infection, suggesting that cardiac parasitism could be associated with broader physiological consequences. Gills, owing to their essential roles in respiration, ion regulation, acid-base balance and waste excretion, respond rapidly to disturbances in homeostasis through lesions such as epithelial lifting, hyperplasia, lamellar fusion, oedema and mucous cell proliferation (Mallatt, Reference Mallatt1985; Bernet et al., Reference Bernet, Schmidt, Meier, Burkhardt-holm and Wahli1999; Ferguson, Reference Ferguson2006). Although I. erraticus metacercariae were restricted to the heart, cardiac impairment may have indirectly affected branchial perfusion and oxygen transport, making gills a useful indicator for identifying secondary physiological consequences of infection.
Effects of host-related factors on Ichthyocotylurus erraticus
I. erraticus has been recorded in Sevan whitefish since 1956 (Mailyan, Reference Mailyan1956) and has been reported to reach high infection levels, with prevalence approaching 100% in some studies (Pavlova, Reference Pavlova1957; Vartanyan, Reference Vartanyan1993). Subsequent studies confirmed the continued occurrence of this parasite in Sevan whitefish (Tolstenkov, Reference Tolstenkov2007; Voropaeva and Tolstenkov, Reference Voropaeva and Tolstenkov2008; Voropaeva et al., Reference Voropaeva, Tolstenkov and Oganesyan2010), and similarly high infection levels were observed in our study. Seasonality had a greater effect on parasite abundance in younger fish, likely reflecting differences in exposure during peak cercarial release from snail first intermediate hosts. In contrast, older individuals (>3 years) showed consistently higher parasite loads, concomitant with cumulative infection over successive seasons (Harrod and Griffiths, Reference Harrod and Griffiths2005a). The lower infection prevalence observed in spring does not necessarily indicate a seasonal breakdown of infection or an annual infection cycle. Instead, this pattern is more likely explained by changes in the host population structure. During spring, the population is replenished by a new generation of juvenile fish that have had limited opportunity for exposure to the parasite and are therefore less likely to be infected, resulting in a lower overall infection prevalence. In addition, fisheries regulations in Lake Sevan permit the harvest of whitefish weighing ≥400 g (Government of the Republic of Armenia. Decision No. 1656-N of 28 September 2023), leading to the preferential removal of larger, older individuals that have had a longer period of parasite exposure. Consequently, the observed seasonal variation in infection prevalence is likely influenced by host recruitment and size-selective harvesting rather than by the disappearance of the parasite from the population.
Length and weight showed high collinearity with age and, therefore, were not included as predictors in the model. Nevertheless, both parameters followed the expected biological pattern, with larger and consequently older fish harbouring higher parasite abundance, reflecting cumulative exposure over time (Poulin, Reference Poulin2000). In contrast, condition factor showed no significant correlation with parasite abundance, suggesting that the observed infection levels were not associated with measurable reductions in host condition. Alternatively, condition factor may not be a sufficiently sensitive indicator to detect subtle effects of parasite infection, as recently suggested by Hasegawa and Poulin (Reference Hasegawa and Poulin2025).
Previous work on pollan (Coregonus autumnalis) suggested that females may exhibit higher infection intensity of I. erraticus than males (Harrod and Griffiths, Reference Harrod and Griffiths2005a). In contrast, the present study found no significant differences in I. erraticus infection intensity between male and female Sevan whitefish. Females showed a significantly higher median intensity than males, indicating a higher typical parasite burden in females, although no significant sex-related differences were detected in prevalence or mean infection intensity. The absence of significant differences in mean and median infection intensity among gonadal development stages indicates that reproductive maturity has little influence on parasite burden. In contrast, the significant differences in prevalence between juveniles and adult fish suggest that host age, potentially through cumulative exposure to infective stages, plays a greater role in determining the likelihood of infection than gonadal development. The pattern observed in the present study, where older age classes exhibited higher parasite intensities than juveniles, suggests that host age may be a stronger predictor of parasite burden than reproductive stage. Similar relationships between host characteristics and parasite intensity have been reported in other fish–parasite systems (Harrod and Griffiths, Reference Harrod and Griffiths2005a; Kahler et al., Reference Kahler, Borba, Burton and Hamazaki2011).
Conclusion
This study reveals a high prevalence of I. erraticus infection in Lake Sevan whitefish, confirming its taxonomic identity using molecular tools, and demonstrates that, despite high infection intensity, the parasite has limited detectable pathological effects on host tissues and overall host condition. Although no significant relationship was detected between parasite burden and condition factor, this index may not adequately capture localized pathological changes associated with parasite cyst formation. Age and season were the primary determinants of infection abundance, while sex and gonadal development stages played minor roles.
Supplementary material
The supplementary material for this article can be found at https://doi.org/10.1017/S0031182026102893.
Data availability statement
All primary data are available either from the manuscript or from the Supplementary Tables S1–S5 and Supplementary Figures S1–S2.
Acknowledgements
We acknowledge the use of the Czech-BioImaging research infrastructure at Biology Centre CAS; the Laboratory of Microscopy and Histology (LM2023050 funded by the Ministry of Education, Youth and Sports of the Czech Republic (MEYS CR) and instrumental equipment co-financed by the European Union) and the Laboratory of Electron Microscopy (LM2023050 and OP VVV CZ.02.1.01/0.0/0.0/18_046/0016045 funded by MEYS CR), part of the Advanced Light and Electron Microscopy Node Prague of Euro-BioImaging ERIC, for their support with obtaining scientific data presented in this paper.
Author contributions
Nelli Barseghyan: conceptualization, funding acquisition, investigation, methodology, writing – original draft. Gabrielle Shira van Beest: investigation, methodology, formal analysis, writing – original draft, writing – review & editing. Anush Arakelyan: investigation, methodology, writing – original draft, writing – review & editing. Roza Barseghyan: resources, investigation, methodology, formal analysis, writing – review & editing. Tigran Vardanyan: resources, investigation, methodology, formal analysis, writing – review & editing. Petra Kundid: investigation, methodology, writing – review & editing. Jerko Hrabar: investigation, methodology, writing – review & editing. Alex Khederian: investigation, methodology. Anna Mari Ghazaryan: investigation, methodology. Ivana Bočina: investigation, methodology, writing – review & editing. Jelena Blašković: investigation, methodology. Ivona Mladineo: conceptualization, funding acquisition, validation, methodology, writing – original draft, writing – review & editing.
Financial support
The research was supported by the Higher Education and Science Committee of MESCS RA (Research project № 25RL-1F016). The study has been funded by the European Union’s Horizon Europe research and innovation programme, under Grant Agreement No. 101084204, Cure4Aqua. Views and opinions expressed are those of the authors only and do not necessarily reflect those of the European Union. Neither the European Union nor the granting authority can be held responsible for them.
Competing interests
The authors declare that they have no known competing financial interests or personal relationships that could have appeared to influence the work reported in this paper.
Ethical standards
From March to November 2024, in accordance with the Order of the Ministry of Environment of the Republic of Armenia (No. 376-N, dated 24 October 2023), whitefish were caught for scientific purposes in Lake Sevan, and the collected samples were further transported to the Ichthyology Laboratory of the Scientific Center of Zoology and Hydroecology, NAS RA.


 Open access

