I. INTRODUCTION
Electric double-layer capacitors (EDLCs) have recently attracted extensive attention as an alternative energy storage system owing to their remarkable power density, long cycle life (over 100,000 cycles), and broad temperature range.Reference Chen and Dai1 In EDLCs, the energy is stored in an electric double layer through physisorption of electrolyte ions on the electrode surface. Thus, porous carbon is considered as an ideal electrode material for EDLCs because of its high specific surface area (SSA), tunable porous structures, chemical and thermal stability, good conductivity, and low cost.Reference Zhang, Yang, Li, Gao and Li2
Up to now, a number of efforts have been devoted to develop carbon materials for EDLCs with tunable pore size distribution, such as template carbonization method,Reference Xiao, Zhu, Yi and Chen3,Reference Ruiz-Rosas, Valero-Romero, Salinas-Torres, Rodríguez-Miraso, Cordero, Morallón and Cazorla-Amorós4 organic gel method,Reference Wu and Xu5,Reference Ju, Song and Fan6 chemical activation method,Reference Lee, Kim, Bang, Yi, Seo and Song7,Reference Wang, Wang, Lu, Ling, Yu, Zhai, Tong and Li8 and polymer blending carbonization method.Reference Kima, Yanga and Ferraris9,Reference Kalra10 The latter is a convenient method to obtain carbon materials with tunable pore structure because the pore structure can be controlled by the phase separation structure of the polymer blends. Also, it avoids time-consuming post-treatment processesReference Xiao, Zhu, Yi and Chen3,Reference Lee, Kim, Bang, Yi, Seo and Song7 and deleterious metal ions.Reference Heather, Kate and Alicia11
The idea of polymer blending carbonization is based on the differences in the thermal stabilities of two selected polymers. One tends to carbonize at high temperature (carbon precursor) while the other decomposes into gaseous products (thermal decomposable molecules) and leaves pores in the carbon matrix.Reference Kima, Yanga and Ferraris9,Reference Suarez-Garcia, Vilaplana-Ortego, Kunowsky, Kimura, Oya and Linares-Solano12–Reference Niu, Zhang, Xie, Wang and Lin14 However, during the curing process of carbon precursor polymer, the occurrence of reaction induced phase separation probably gives rise to the macrophase separation in polymer blends system.Reference Xia, Li, Ding, Li and Gan15 The decomposition of thermal decomposable molecules, hence, leaves large pores in the carbon matrix, leading to low surface area, wide pore size distribution, and closed pore of as-prepared porous carbon, which adversely affects the electrochemical performance in EDLCs.Reference Li and Wei16
As a result, we propose the chemical blending carbonization method to overcome these shortcomings.Reference Xia, Liu, He, Shi, Chen and Yang17 The phase structure coarsening would be delayed during curing process due to the chemical bonding between the carbon precursor and thermal decomposable molecules in chemical blending system. Since the phase-separated structure was fixed at an early stage, the periodic distance of the structure was controlled in nanoscale.Reference Xia, Li, Ding, Li and Gan15 In this work, aliphatic dicarboxylic acid with different chain lengths was chosen to graft to or block in phenolic resin (PF) (carbon precursor polymer) networks by chemical reaction. The potential of these grafted or blocked segments for pore generation in carbon matrix was identified after pyrolysis process. In addition, the effect of the chain length on the pore structure and electrochemical properties of the porous carbon for applications in EDLCs was experimentally validated.
II. EXPERIMENTAL
A. Preparation of porous carbon
Aliphatic dicarboxylic acids are succinic acid (A2), adipic acid (A4), suberic acid (A6), and sebacic acid (A8). The suffix figure (n) indicates the number of methylene unit for each diacid.
Solid PF (resol) and each diacid were mixed in methanol by mole relative (0.002 mol) to 1 g PF and stirred at room temperature until the solution was clarified. A 0.002 mol to 1 g ratio used here was proved to be the reasonable ratio according to our previous study.Reference Xia, Liu, He, Shi, Chen and Yang17 After slow evaporation of the solvent inside an oven, the mixture cured for 2 hours at 160 °C. The resulting blend sample was then pulverized mechanically into particles in 0.5 mm and pyrolyzed in a tube furnace at 900 °C for 1 h under a N2 atmosphere. The as-prepared cured blends and carbon materials were referred to PF/An and CPF/An (n = 2, 4, 6, and 8), respectively. The pure PF and carbonized sample were denoted as PF and CPF, respectively.
B. Sample characterization
The Fourier transform infrared spectroscopy (FTIR) spectra were collected by using a WQF-410 FTIR spectrometer (Beijing Rayleigh Analytical Instrument Corporation, Beijing, China) in the frequency range of 4000–500 cm−1. The thermogravimetric (TG) measurements were performed on a STA409 PC Luxx TG analyzer in nitrogen stream. The XRD (x-ray diffraction) was carried out on a Rigaku B/max-2400 x-ray diffractometer (Rigaku Corporation, Rigaku, Japan). Raman spectra were tested on a LABRAM-010 spectrometer (JY Company, Paris, France). Transmission electron microscopy (TEM) (JEOL Ltd., Tokyo, Japan) images were obtained using JEOL JEM-3010 instrument operated at 200 keV. Scanning electron microscopy (SEM) (JEOL Ltd., Tokyo, Japan) images were obtained using JEOL JSM-6700F scanning electron microscope.
Nitrogen adsorption isotherms were measured at −196 °C with a Micromeritics ASAP 3020 automatic adsorption apparatus (Micrometrics, Norcross, GA) using nitrogen of 99.99% purity. The SSA of porous carbons was measured using the Brunauer–Emmett–Teller (BET) nitrogen adsorption method within the relative pressure range of 0.05–0.20. The total pore volume, V tot, was calculated based on the single point method, the total micropore volume, V micro, by means of the Dubinin–Radushkevich equation and the mesopore volume, V meso, was calculated as the difference between the total pore volume, V tot, and the total micropore volume, V micro. The corresponding pore size distribution was calculated based on desorption curves using density functional theory (DFT) method.
C. Electrochemical characteristics of porous carbon electrode
Porous carbon (active material), carbon black (conductivity enhancing material), and polytetrafluoroethylene (PTFE) (60 wt% solution, binder) were mixed in a mass ratio of 90:5:5 and dispersed in deionized water (the mass ratio of carbon to water was set as 1:2). After homogenization in a mortar, the slurry was rolled into a thin film of uniform thickness (0.5 ± 0.1 mm). From this film, 12 mm circular electrodes of approximately 15 mg were punched out and pressed onto nickel foam (as a current collector). The carbon coated nickel foam was then immerged in a 30% (wt%) KOH solution under vacuum for about 3 h before testing.
The constant current charge/discharge tests were conducted in the voltage range of 0.01–1 V with a Battery Tester (Land, Wuhan, China) at different specific current from 0.1 A/g to 5.5 A/g. The gravimetric specific capacitance (C g) from the charge/discharge curve was calculated by the following equation:
 $${C_{\rm{g}}} = {{4 \times I \times {\rm{\Delta }}t} \over {m \times {\rm{\Delta }}V}}\quad ,$$
where I is the current (A), Δt is the discharging time (s), m is the mass of both electrodes (g), and ΔV is the voltage window (V).
Electrochemical measurements cyclic voltammetry (CV), electrochemical impedance spectroscopy (EIS) were performed at an electrochemical workstation CHI660A (Chenhua Instrument Corporation, Shanghai, China) at room temperature, using two-electrode electrochemical capacitor cells. Cyclic voltammograms were recorded from 0 to 1 V at various sweep rates and the Nyquist plots were recorded potentiostatically (0 V) by applying an alternating voltage of 5 mV amplitude in the 100 kHz to 1 mHz frequency range. The specific capacitances (C*) from the Nyquist plots were calculated according to the following formulaReference Bueno, Mizzon and Davis18–Reference Xing, Huang, Zhuo, Yuan, Wang, Hulicova-Jurcakova, Yan and Lu20:
 $$C^* = {{ - 1} \over {2\pi f \times {Z_{{\rm{im}}}}}}\quad ,$$
where f is the frequency (Hz) and Z im is the imaginary part of impedance (ohm).
III. RESULTS AND DISCUSSION
A. Chemical structure of blend systems
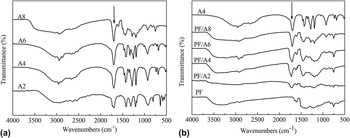
The chemical structure and reaction of PF with diacids were analyzed by FTIR spectroscopy. As shown in Fig. 1(a), a peak around 1700 cm−1 is assigned to the –C=O stretching vibrations of all selected diacids. Small peaks around 2800–3060 cm−1 are characteristic of –CH2– stretching vibrations of diacids. For PF [Fig. 1(b)], broad band around 3200–3600 cm−1 is associated with –OH stretching vibrations. The absorption band at 1596 cm−1 is assigned to aromatic ring stretching vibrations. The IR bands at 1100 and 1212 cm−1 correspond to C–O–C stretching vibrations of methylene ether bridges of phenol molecules. The IR spectra of PF/An blends are similar to that of PF. However, the carbonyl signals of PF/An blends shift to higher frequencies compared to adipic acid [Fig. 1(b)], evidently revealing that carboxylic acid was transformed into ester linkage by reacting with methylol group of PF.Reference Choi, Byun and Chung21 Diacids were inserted into the PF network by the simultaneous process of curing process and chemical reaction between the PF and diacids, which is different from the physical blending system.
IR spectrums of diacids (a) and blends of PF and diacids (b).

B. Pyrolysis process of blend systems
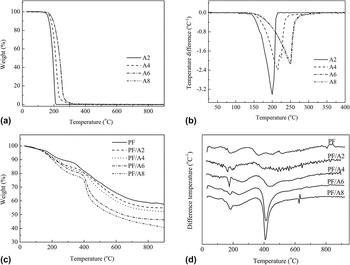
To understand the structure development of PF and diacid blends during pyrolysis, thermal analyses of neat diacids, PF, and their blends were performed by thermogravimetric analysis (TGA). Figure 2 plots the TGA curves at a heat rate of 10 °C/min under nitrogen. As shown in Fig. 2(a), the pyrolysis process of diacids mainly occurs in 100–300 °C temperature range and their mass losses are almost 100 wt%. The decomposition peak temperature of diacids increases with the chain length due to their increased thermal stability [Fig. 2(b)].
TGA and derivative thermogravimetric analysis (DTG) curves of pure diacids (a and b) and blends of PF and diacids (c and d).

The pyrolysis procedure of PF can be roughly divided into three stages. Firstly, a small mass loss before 350 °C is mainly due to the evaporation of the adsorbed water and dehydration during the polycondensation of PF. Then, considerable amount of small molecules such as CO, CH4, and H2 is released at the temperature range of 350–600 °C because of the pyrolysis, cyclization, aromatization, and polycondensation of the resin.Reference Ko, Kuo and Chang22 Finally, deep carbonization and structure reorganization of the carbonaceous material proceed above 600 °C and only a small amount of H2 is released at the final stage.
The TGA curves of blends exhibit two significant weight losses in temperature ranges of 180–250 °C and 400–500 °C. The visible mass loss in PF/An blends around at 200 °C [Fig. 2(c)] is due to the pyrolysis of unreacted diacid molecules. This part of diacids decomposes too early to leave pores in blending system since PF would shrink remarkably at the early stage of carbonization process.Reference Ko, Kuo and Chang22 The notable mass loss of blends that occurred at 400–500 °C can be partly ascribed to the pyrolysis of chemically inserted diacids in PF network. The decomposition peak temperature of inserted diacids, however, does not continuously increase with the chain length [Fig. 2(d)]. Compared with unreacted diacids, these blocked or grafted diacids in the blending system did not pyrolyze until a relatively strong skeleton of PF was established in carbonization process (>400 °C). Abundant pores would be left in the as-obtained carbon matrix after the pyrolysis of blocked or grafted diacids.
C. Characterization of carbonized blend systems
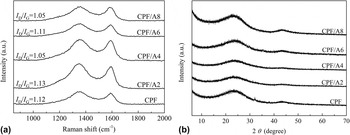
The microstructure of carbonized blend systems was observed using Raman spectroscopy and XRD. All carbonized blend systems exhibit two broad characteristic peaks at about 1350 (D-band) and 1590 cm−1 (G-band) in Fig. 3(a). The G-band is associated with sp2 vibrations of perfect graphite crystal, while the D band corresponds to the vibrations of disordered carbon. The intensity ratio of the bands D and G (I D/I G) was used to describe the extent of graphitization and the alignment of the graphitic planes within carbon materials.Reference Lee, Lytle, Ergang, Oh and Stein23 The I D/I G value of carbonized blend system seems not to be sensitive to the diacids' chain length of blend systems and shows a relatively high value in the range of 1.05–1.13, indicating the existence of a high portion of amorphous, disordered carbon. As shown in Fig. 3(b), the XRD patterns of carbonized blend systems present two broad diffraction peaks at diffraction angles of 2θ = 24.2° and 2θ = 43.0°, indicating a typical pattern of amorphous carbon structure,Reference Huang, Zhang, Huang, Wang and Wei24,Reference Wang, Liang and Qiao25 which is in agreement with the results determined from the Raman spectra.
Raman spectra (a) and XRD patterns (b) for carbonized CPF/An blends and CPF.

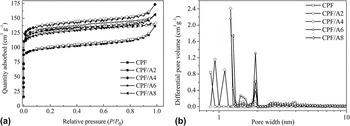
To investigate the effect of diacids' chain length on the pore structure, the surface area and porosity of carbon samples derived from PF and diacids blends were measured. Figure 4 shows the N2 adsorption/desorption isotherms and pore size distribution curves. As shown in Fig. 4(a), an adsorption platform appears at a relative pressure of P/P 0 ≥ 0.1 for all samples and the adsorption capacity gradually approaches saturation. The isotherms correspond to Type I nitrogen adsorption–desorption isotherm according to the IUPAC classification,Reference Xia, Shi, Liu, Yang and He26 which means there are mainly micropores. The DFT curves in Fig. 4(b) reveal the microporosity of all samples, which are in good agreement with the discussion above. The pore width of carbon samples gradually increases with diacid chain length. Additionally, it can be seen from Fig. 4(b) that the pore size distributions of the CPF/A4–CPF/A8 samples exhibit maxima at pore sizes of 1.2 and 2.0 nm.
Nitrogen adsorption/desorption isotherms for carbonized CPF/An blends and CPF (a) and pore size distribution calculated from DFT methods (b).

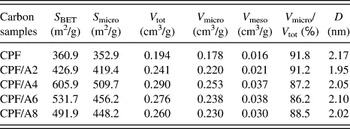
The surface area and pore volumes of CPF/An blends are summarized in Table I. The neat PF derived carbon exhibits the BET surface area of 360 m2/g. The chemical blending of diacids in PF to prepare porous carbon results in an increase in the surface area. But the surface area values do not show monotonic changes with the diacids' chain length. As the chain length of diacids increases, the surface area increases at first and then decreases when n = 4. The SSA of CPF/A4 is 605.9 m2/g, which is higher than the result recently reported of physical blending system.Reference Wu and Xu5 It is also found that the mesopore volume increases with the chain length of diacids and reaches the largest value when n = 6.
The SSA and pore structures of CPF/An blends and CPF.

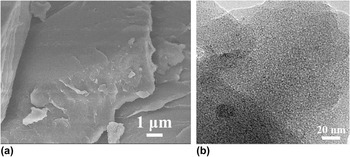
Theoretically, the smaller the periodic distance of blending structure, the higher the SSA of as-prepared carbon is. The SEM image of PF/A4 and TEM image of CPF/A4 are illustrated in Fig. 5. A homogenous morphology of PF/A4 was observed in Fig. 5(a), which means the phase separation of PF/A4 was controlled in nanoscale due to the favorable interaction and miscibility between PF and A4.Reference Choi, Byun and Chung21 As shown in Fig. 5(b), abundant nanopores are left in carbonized PF matrix after the pyrolysis of grafted A4. The phase separation structure of PF and diacids is crucially dependent on the miscibility and the reactivity between them. Longer chain length in diacids results in a reduced surface area, which may be caused by their decreased miscibility and reactivity with PF, as shown in Fig. 1(b).
SEM photograph of PF/A4 (a) and TEM photograph of CPF/A4 (b).

D. Electrochemical properties of the carbonized blend systems
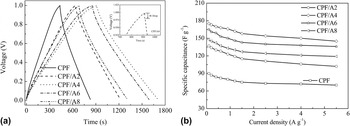
To determine the optimum diacid chain length, the electrochemical performance of CPF/An carbon samples as electrodes for EDLCs was investigated. Figure 6(a) shows the charge/discharge curves of CPF/An carbon electrodes at a constant current density of 100 mA/g. The curves of CPF/An electrodes exhibit a virtually linear shape and triangular distribution. Moreover, the IR drop, ascribed to the internal resistance of the electrode is small (0.024–0.034 V) due to the well formed electrode/electrolyte interface, suggesting a low equivalent series resistance (ESR) in the test cells.Reference Zhu, Murali, Stoller, Ganesh, Cai, Ferreira, Pirkle, Wallace, Cychosz, Thommes, Su, Stach and Ruoff27 It should be noted that CPF/A4 shows the longest charge/discharge time, indicating that CPF/A4 has higher specific capacitance. The specific capacitances at different discharge densities are displayed in Fig. 6(b). The capacitances of porous carbon electrodes continuously decrease with an increase in the current density due to the slow transfer rate of electrolyte ions in large amounts of micropores within porous carbon. Meanwhile, the specific capacitance increases in the order of CPF/A4 > CPF/A6 > CPF/A8 > CPF/A2 > CPF at a current density of 0.1 A/g, which is well consistent with the trend of surface area. The CPF/A4 electrode presents the highest specific capacitance at all current densities, attributed to the largest SSA (605.9 m2/g) and optimal porosity in this electrode. A capacitance of 175 F/g is achieved in the CPF/A4 electrode at a current density of 0.1 A/g and the capacitance retaining reaches more than 82.8% even at a high current density of 5.5 A/g, suggesting a good rate performance.
Galvanostatic charge/discharge curves of CPF/An electrodes at a constant current density of 0.1 A/g (a) and the specific capacitance as a function of current density (b).

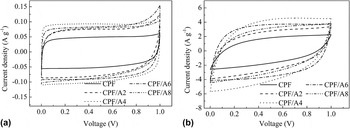
Figure 7 presents the cyclic voltammograms of CPF/An electrodes at scan rates of 1 and 50 mV/s. At low scan rate (1 mV/s), all the samples show quite rectangular curve shape without obvious oxygen and hydrogen evolution peaks, suggesting good charge propagation within the potential range used. But their voltammogram shapes become slightly distorted to different extents at 50 mV/s due to diffusion-limited capacitance of electrolyte trapped in the micropores of carbons.Reference Jisha, Hwang and Shin28 The CV curve of CPF/A4 shows a much larger rectangular shape with slight distortion than that of the other samples even at a high scanning rate of 50 mV/s representing a good power capability, which is in good agreement with the results of galvanostatic charge/discharge measurements.
Cyclic voltammograms of CPF/An electrodes at 1 mV/s (a) and 50 mV/s (b).

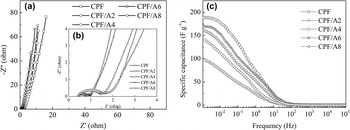
EIS was used to further characterize the electrochemical behaviors of carbon sample electrodes. Figure 8(a) shows typical Nyquist plots of the carbon sample electrodes in a frequency range of 100 kHz to 1 mHz at open circuit potential with an ac perturbation of 5 mV. All spectra exhibit the typical impedance behavior of porous carbons in EDLDs.Reference Qu29 In high frequency region, the diameter of the semicircle, defined as polarization resistance (or charge transfer resistance, R e), reflects the sum of the intrinsic resistance of the electrode and the interface resistance between the electrode and the electrolyte.Reference Bard, Abruna, Chidsey, Faulkner, Feldberg and Itaya30–Reference Chen, Rakhi, Hu, Xie, Cui and Alshareef32 In the enlarging patterns of Fig. 8(b), the electrode from carbonized blend systems shows a lower R e than that of CPF, revealing that blending precursor polymers may induce a more conductive carbon matrix. The value of R e decreases in the following order for the electrodes: CPF (1.13 Ω), CPF/A2 (1.12 Ω), CPF/A8 (1.03 Ω), CPF/A6 (0.58 Ω), and CPF/A4 (0.37 Ω), which is consistent with that derived from the voltage drop of charge/discharge curves. The enhanced mesopore volume (Table I) of CPF/An samples favors more rapid ion diffusion and accumulation onto porous electrode, leading to a lower polarization resistance and better capacitive performance. In the low-frequency region, the nearly vertical line indicates a pure capacitive behavior. However, due to the frequency dispersion effect in the actual porous carbon the imaginary part is oblique rather than perpendicular to the real part.Reference Song, Sung and Jung33 The imaginary part shows a more straight line (near-vertical) in electrodes of CPF/A4 and CPF/A6, indicating a closer behavior of the electrodes to an ideal capacitor.
Nyquist plots (a), enlarged pattern (b) and specific capacitances versus frequency plots (c) for the carbon electrodes of CPF/An blends and CPF.

To further investigate how much of solvated ions access the pores at a specific frequency, a capacitance versus frequency plot for CPF/An blends is shown in Fig. 8(c). At high frequencies, there is no significant difference between samples as electrolyte ions have no time to access the whole porosity. As the frequency decreases (from 10 to 1 mHz), electrolyte ions have time to penetrate into the depth of the pores, then additional surface area is accessed. The values of specific capacitance, calculated from the Nyquist plots at ac frequency f = 1 mHz, are somewhat higher than the values obtained from the constant current charge/discharge test at a current density of 0.1 A/g. This result could be due to a very slow establishment of the adsorption equilibrium within ultramicropores or micropores.Reference Tooming, Thomberg, Kurig, Janes and Lust34 Compared with CPF, the capacitances of CPF/An can still reach high values at high frequencies, especially the CPF/A4 which provides 150 F/g at 0.1 Hz. The superior capacitive performances of CPF/An at high frequencies can be ascribed to their higher mesoporosity that favors fast diffusion of electrolyte at high frequencies.
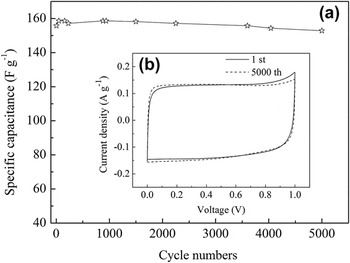
To examine the electrochemical stability of the carbon sample, the durability test was performed at a constant current density of 1.0 A/g over 5000 cycles. Figure 9 shows the specific capacitance of CPF/A4 electrode with respect to the cycle number. During the first 200 cycles, the specific capacitance increases slightly and remains almost constant then after. The capacitance only decreases by 1.9% of the initial capacitance after 5000 cycles, and no obvious changes can be found on the CV curve of the 5000th cycle compared with that of the 1st cycle [Fig. 9(b), inserted image], demonstrating the high reversibility and excellent electrochemical stability of the porous carbon electrode. Thus, from the overall features of pore structure and electrochemical properties, the optimum chain length is determined as n = 4, which is attributed to the favorable reactivity and miscibility between A4 and PF.
Durability test of the CPF/An blends and CPF derived porous carbon electrodes measured at a current density of 1.0 A/g (a) and CV measured at 2 mV/s acquired for CPF/A4 after running for 5000 cycles (b).

IV. CONCLUSIONS
Porous carbons with optimal pore size distribution were prepared by chemical blending carbonization without any additional activation process, in which PF was chosen as thermally stable polymer and aliphatic dicarboxylic acids as thermo-decomposition molecules. The PF showed good compatibility with diacids by chemical reaction between methylol groups of resin and carboxyl groups of diacid, while macrophase separation of blend systems was prevented. Inserted diacids did not pyrolyze (>400 °C) until a relatively stable skeleton network of PF came into being. The created pores can be preserved because severe collapse and shrinkage of PF were avoided. The SSA and capacitance increased with diacid chain length, but decreased over 4 of the methylene number in diacid chain. The maximum value was obtained at CPF/A4, which is 605 m2/g and 175 F/g, respectively. Good rate characteristic was also achieved due to its reasonable pore size distribution. To sum up, the proposed chemical blending carbonization method is simple and environmentally friendly, promising a good prospect in EDLCs.
ACKNOWLEDGMENTS
Financial supports by the National Natural Science Foundation of China (No. 51402101, No. 51472083), Hunan Provincial Natural Science Foundation of China (14JJ3059), National Innovation Experiment Program for University Students of Hunan University, and Growth Scheme for Young Teachers of Hunan University (No. 531107040185) are gratefully acknowledged.