Until recently, the production and dissemination of fine-grained administrative data has been the exclusive provenance of developed democracies. Over the past decade, however, a growing number of poorer and less democratic states have begun releasing more data to the public. Indeed, when it comes to availability and periodicity of key socioeconomic indicators, the World Bank ranks the current performance of electoral and closed autocracies nearly on par with that of democracies.Footnote 1
The availability of fine-grained data from previously closed contexts appears at first to be a boon to scholars of authoritarian politics. With access to new data, scholars are now working to address what had seemed previously intractable questions. As a result, a growing number of quantitative studies in comparative politics draw conclusions from non-democratic contexts.Footnote 2 Moreover, the availability of such data makes it possible to rectify previous biases in cross-country studies, which have been hampered by a lack of data from higher income authoritarian states.Footnote 3 However, as we detail in this piece, scholars should treat these newly available data with caution.
First, concerns about data quality are pervasive in the developing world (Jerven Reference Jerven2013; Devarajan Reference Devarajan2013). Official statistics are often inaccurate or incomplete due to a range of bureaucratic or administrative factors. For instance, Sandefur and Glassman (Reference Sandefur and Glassman2015) provide compelling evidence that official statistics systematically exaggerate development progress across multiple African countries, reflecting two interlinked principal-agent problems: First, governments misreport to foreign donors, particularly in the context of results-based aid. Second, governments are themselves frequently misled by frontline service providers tasked with simultaneously providing public services and reporting truthful data on the same.
Scholars have also begun to highlight the influence of domestic politics on data manipulation. Autocrats are under pressure to release data but they have control over what data is released and its veracity, control which they can exploit for their own ends. For instance, population data is often politicized as it frequently determines the distribution of federal resources. This threatens the reliability of these data because governments have an incentive to manipulate it (Akinyoade, Appiah and Asa Reference Akinyoade, Appiah and Asa2017; Elemo Reference Elemo, Levan and Ukata2018). Macroeconomic indicators are also frequently politicized—particularly in nondemocratic contexts (Martinez Reference Martinez2019; Rawski Reference Rawski2001; Tsai Reference Tsai2008; Wallace Reference Wallace2016).
We build on this literature by highlighting an additional set of motivations that autocrats have to engage in targeted manipulation of subnational data in order to undermine the reputation of would-be challengers. Such data manipulation fits into the broader set of strategies that authoritarian leaders use to legitimate and prolong their rule. An empirical example from Tanzania, comparing data on local government tax takings released to the public with verified internal figures, provides evidence of this phenomenon and its associated risks. We conclude with a framework that researchers can use to anticipate and detect manipulation in their data.
Why Do Authoritarian Regimes Release Data?
The increased availability of fine-grained data from authoritarian regimes reflects two parallel trends that reinforce each other. First, the Millennium Development Goals and their successors, the Sustainable Development Goals, have oriented the international development community towards clearly defined targets, motivating a raft of statistical exercises to improve the tracking of economic and social indicators (Kelley and Simmons Reference Kelley and Simmons2019; Jerven and Johnston Reference Jerven and Johnston2015; Sandefur and Glassman Reference Sandefur and Glassman2015). These include a push for national governments to disseminate information under open data protocols. At the same time, the promotion of open government data has pervaded the policy agendas of governments around the world (Davies and Bawa Reference Davies and Bawa2012). For example, the voluntary Open Government Partnership, launched in 2011, counts seventy-eight countries and twenty subnational governments among its members, who together have generated over 3,100 commitments to make their governments more open and accountable.Footnote 4 Star performers include not only the usual suspects in Western Europe and North America, but also lower income, less democratic countries such as Kenya, Honduras, and Moldova.
That said, democracies tend to be more transparent than authoritarian regimes (Hollyer, Rosendorff, and Vreeland Reference Hollyer, Rosendorff and Vreeland2011). Autocrats have an incentive to resist transparency because it can be dangerous for their survival. Making information freely available allows citizens to not only update their beliefs about government performance, but also their beliefs about what other citizens believe (Hollyer, Rosendorff, and Vreeland Reference Hollyer2015). Journalists, politicians, and civil society can leverage open data to criticize the regime and encourage mobilization against it, which can foment dissatisfaction with the regime (Reuter and Gandhi Reference Reuter and Gandhi2011).
However, autocrats do release data. An emerging literature suggests that authoritarian regimes may have incentives to allow or even promote certain forms of transparency to help them win elections (Maerz Reference Maerz2016). Little (Reference Little2017) shows that the release of manipulated information on good performance makes it more likely that voters will coordinate to support the regime even if they do not sincerely believe the information. Transparency can also increase elite cohesion as a strategic response to greater threats from the masses (Hollyer, Rosendorff, and Vreeland Reference Hollyer2018). Berliner (Reference Berliner2014) argues that the passage of freedom of information laws allows incumbents (in democracies and autocracies) to ensure that they will not be shut out of access to government information and tools of monitoring if they lose power in the future. Subnational analysis from Mexico confirms that incumbents are particularly likely to pass such reforms when their grasp on power is less secure (Berliner and Erlich Reference Berliner and Erlich2015).
The key challenge for scholars of authoritarian politics wishing to take advantage of data released under such initiatives is the heightened potential for manipulation. Whereas democratic leaders may also be tempted to manipulate official figures in their favor, countervailing institutions like a free press, independent judiciary, and impartial bureaucracy make this relatively difficult. It is arguably easier for autocrats to manipulate data before it is released, altering it in politically expedient ways. Furthermore, as we will show, incentives to manipulate data may vary across subnational units—creating particular threats to inference for analysis at this level.
Evidence of Risks from Tanzania
Tanzania exemplifies the range of ways that autocrats can strategically censor and manipulate economic indicators for their own benefit. The country’s ruling party, Chama Cha Mapinduzi (CCM), has been in power since independence in 1961 and there is little separation between the party and the state (Morse Reference Morse2014, Reference Morse2018).Footnote 5 The country has taken an increasingly authoritarian turn since the election of its current president John Magufuli in 2015 (McLellan Reference McLellan2018). Magufuli has pursued an unprecedented number of interventionist economic policies alongside an outright attack on political freedoms and opposition parties. To protect his economic record, Magufuli and his government have engaged in a number of tactics to obscure potentially damaging information, including blocking the publication of key domestic and international reports (Cotterill Reference Cotterill2019; Collord Reference Collord2019; African Arguments 2019).
However, as in many other low- and middle-income electoral autocracies, international organizations and donor governments exert significant leverage. As a result, the country has adopted a range of measures to increase data transparency in recent years. These include the publication of a raft of administrative data as part of the country’s open government partnership with the World Bank (World Bank 2015).Footnote 6
The release of such data can pose problems for the ruling party, particularly if it changes voters’ beliefs about the regime and opposition parties’ competency. Hegemonic parties like CCM maintain support by convincing voters they are the only party which can successfully rule (Magaloni Reference Magaloni2006; Guriev and Treisman Reference Guriev and Treisman2015). This image may be threatened by the release of data showing that opposition parties outperform them. In what follows, we provide evidence suggesting that the CCM regime manipulates public data to discredit opposition parties. Since 2005, opposition share of the vote has been growing. In 2015, opposition parties won 40% of the presidential vote and 45% of the legislative vote. Chadema, the main opposition party, relies on good performance in local government to win over voters. Hence, the Tanzanian regime is increasingly concerned with managing local as well as national competition to stay in power (McLellan Reference McLellan2020).
As evidence of how such dynamics affect the release of official statistics, we compare internal local tax collection data from Tanzania for the 2016/2017 fiscal yearFootnote 7 with that released online through the Local Government Revenue Collection Dashboard, an open data portal established in 2017 and hosted on the website of the President’s Office for Local Government and Regional Administration (TAMISEMI). These data are published by presidential appointees in TAMISEMI who are directly accountable to the president, making manipulation feasible.
Tanzanian local governments raise taxes to supplement central transfers and fund key services (roads, education, health, water) to foster development and garner political support. As in other decentralized countries, local tax revenue serves as an important indicator of local government performance, which can be important to win over voters (Lucardi Reference Lucardi2016). The government began releasing data on local government tax takings as part of the aforementioned transparency initiatives, and this data has emerged as a yardstick by which Tanzanian politicians and the press appraise local government performance (Malanga Reference Malanga2019).
While opposition parties use tax takings to show they are delivering on their local mandate, the central government uses these figures to herald the success of key incumbent areas (Chidawali Reference Chidawali2018). Newspapers regularly report on revenue collection, influencing how voters and elites view the relative credibility of the regime and opposition parties.Footnote 8 The political salience of these figures and the regime’s influence over the bureaucrats who produce the data make it particularly vulnerable to manipulation.
Suspicious Digits
As a first step for ascertaining evidence of manipulation, we leverage established methods for detecting fraud in official statistics. In general, these methods make certain assumptions about the data-generating process and then analyze whether official government statistics deviate from what would be expected in the absence of manipulation. These include various forms of digit analysis (Beber and Scacco Reference Beber and Scacco2012; Mebane Reference Mebane2010; Deckert, Myagkov, and Ordeshook Reference Deckert, Myagkov and Ordeshook2011).
One common benchmark, Benford’s Law, proposes that the leading digits in non-manipulated sets of numbers should conform to a distribution where the number 1 is the most likely to occur and the number 9 is the least likely to occur. We therefore run first digit analysis on both tax datasets, finding that the internal data is more consistent with theoretical expectations about digit distribution than the public data.Footnote 9 Such results suggest cause for concern, but they are far from conclusive.
We next proceed to analyze the last digits of the tax data. Here, we would expect a uniform probability of the numbers 0–9 in sets of numbers that have not been manipulated. We analyze the last digits of the data and find that the distribution of last digits in the internal data conforms far better to the expected distribution of digits than the public data.Footnote 10 The results of this analysis are more compelling but still inconclusive.Footnote 11
In sum, digit analysis of the public data suggests manipulation but is far from a smoking gun. None of the distributions discussed are statistically significantly different from the distribution that would be expected in the absence of manipulation. The results may be inconclusive because these methods analyze the entire distribution of the data. That means they are less sensitive to more targeted manipulation. As we will show, it is precisely such targeted manipulation that appears to be occurring in this case.
Evidence of Targeted Manipulation
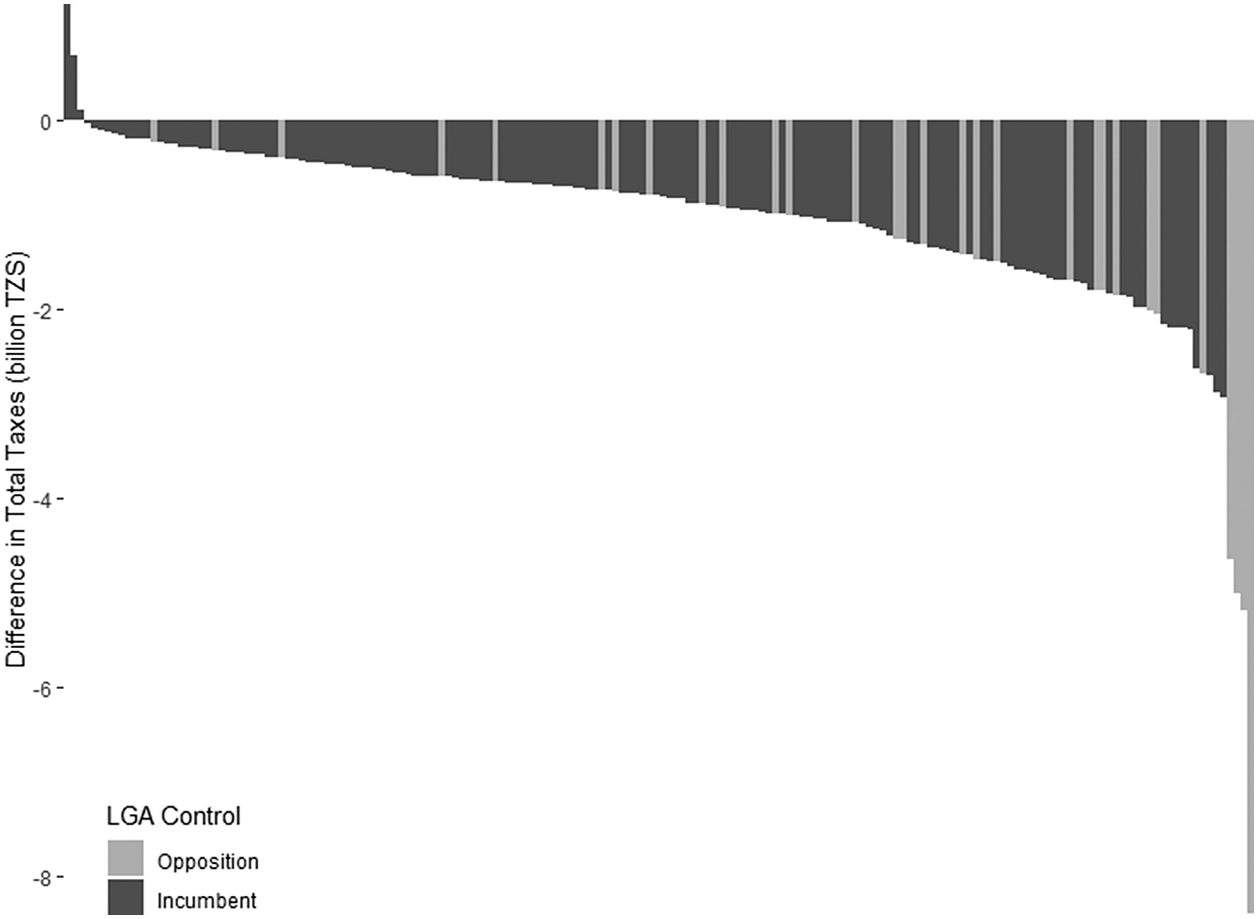
The fact that subnational performance is important to electoral competition in Tanzania may incentivize the regime to manipulate particular observations. Specifically, there are incentives to overstate the performance of local governments controlled by the ruling party and understate that of opposition-controlled localities. When we compare the internal and public figures, those released by the central government appear to underestimate local tax raising in the vast majority of Tanzania’s local government authorities (LGAs). Figure 1 plots the differences between total revenue reported in internal and public data by LGA.Footnote 12 If these differences were fairly consistent, the most plausible explanation would be simple accounting problems.Footnote 13 However, there is substantial variation in the magnitude of the differences between the internal data and that released to the public. These differences range from an underestimate of 40 billion shillings ($16.5 million) in Kinondoni Municipal Council in Dar es Salaam to an overestimate of 1.25 billion shillings ($550,000) in Kibaha District Council. Per capita differences are similarly skewed. Moreover, these differences appear to vary systematically.
Difference between total revenue reported in internal and public data by LGA

Further investigation suggests that the pattern that emerges can be most plausibly explained as a strategic response by the central government to the dynamics of political competition. This is in keeping with previous efforts to skew macroeconomic indicators in a way that is favorable to the regime. For instance, in 2017 a leading opposition MP was arrested and charged with sedition after his party published an analysis of official economic data from the Bank of Tanzania, suggesting that the official GDP growth statistics had been manipulated (Taylor Reference Taylor2017).
Opposition local governments’ tax takings are underestimated to a far greater (and statistically significant) extent than those of incumbent local governments. In particular, the public data vastly underestimates the tax takings of prominent opposition strongholds like Moshi, Mbeya, Arusha, and central Dar es Salaam. Importantly, where the public data overestimates tax takings, it is in prominent regime strongholds like the administrative capital Dodoma.Footnote 14
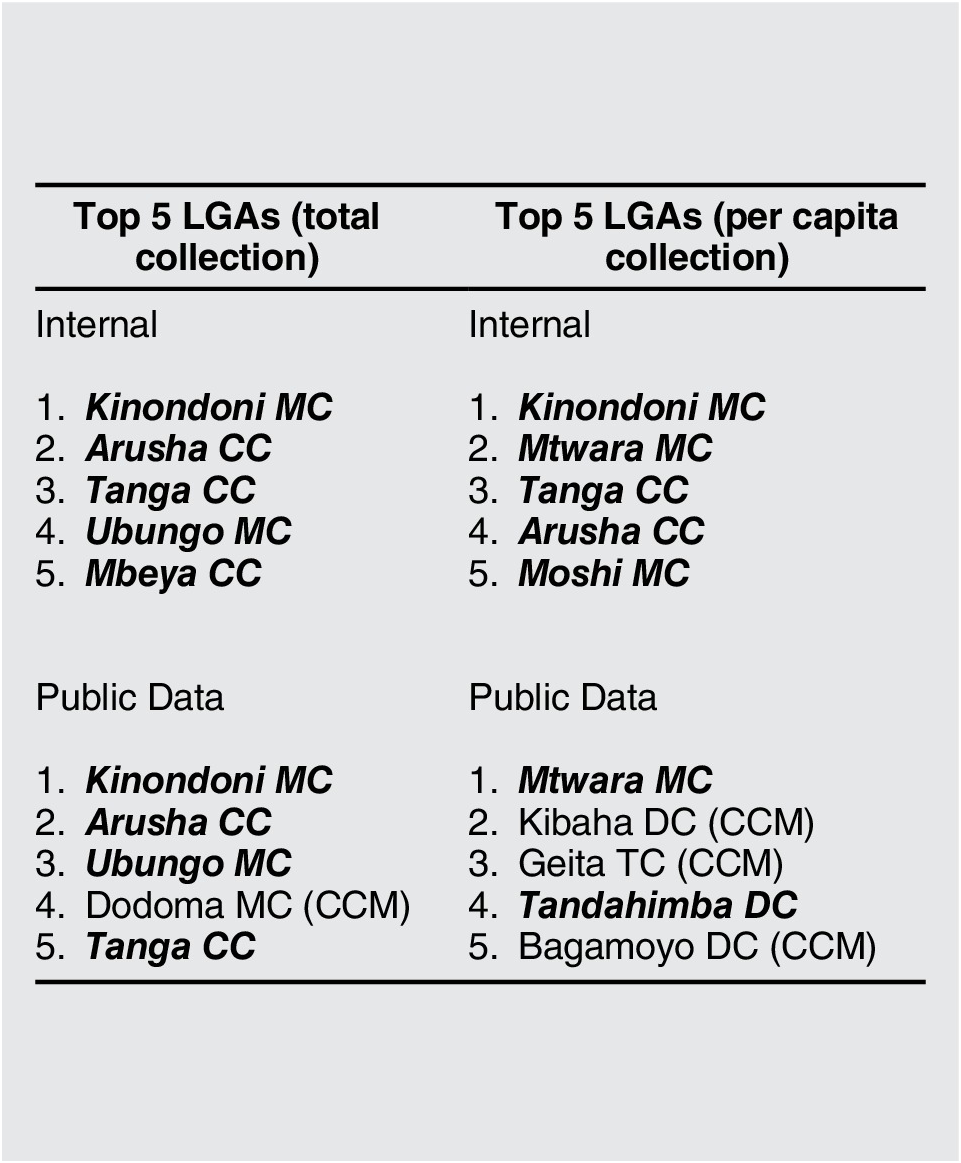
These differences in the data affect LGA rankings and thus the credit that opposition and ruling parties can claim for good performance. Table 1 shows the top five LGAs in total and per capita collection for the public and internal data. The top five LGAs according to the internal data are all opposition councils (shown in bold italics).Footnote 15 This is unsurprising in the Tanzanian context where there is evidence that opposition councils are strategically disfavored with central government transfers (Weinstein Reference Weinstein2011), making them more reliant on their own revenue sources.
Top performing local governments in 2016–2017

Note: Opposition councils are shown with bold italics; CCM councils are labeled as such. These patterns suggest opposition performance has been strategically underestimated.Footnote 17
Opposition councils also dominate the top five in the public data but there are some notable shifts. First, Dodoma moves into the top five for total revenue collection from eleventh place in the internal data. This is noteworthy given that the transformation of Dodoma into a major hub is a government priority.Footnote 16 Second, Chadema councils fall out of the top five in per capita collection completely when the public data is used. In contrast, LGAs from other opposition parties remain among the top performers.
To provide further evidence, we regress CCM control on the difference between a local government’s per capita local tax collection in the public data and the internal data.Footnote 18 We find that CCM control of a local government significantly reduces the difference between publicly released and internal figures.Footnote 19 The performance of opposition local governments is more likely to be underestimated. Our analysis suggests the effect is larger in opposition strongholds where the opposition share of councilors is higher, but this result is not robust to the more conservative log transformation used.
For additional robustness, we look at whether opposition control predicts significant under-reporting of performance, which we define as those cases where the difference between public and internal is greater than a standard deviation of all the differences. Footnote 20 These are cases that we can more confidently say are intentional misreports. For total taxes, all significantly under-reporting LGAs are opposition LGAs. There are both opposition and CCM LGAs in the cases of significant under-reports of per capita tax revenues. Thus, we regress CCM control and share of opposition councilors on the likelihood of a significant underestimate. We find that CCM control significantly decreases the chances that an LGA significantly under-reports performance.Footnote 21 The chances of under-reporting increase with the share of opposition councilors. Taken together, these results suggest that the regime strategically underestimates opposition performance. The publicly released figures allow the ruling party to claim that they are performing well and undermine opposition parties’ abilities to do the same.
Threats to Inference from Manipulated Data
The manipulation our analysis suggests has significant implications for the inferences one can draw from the tax data as a whole. In the rest of this section, we present evidence of threats to inference for studies using local tax revenue as a dependent or independent variable. We compare the results of the models using the internal and the public data, demonstrating how partisan manipulation of data can bias a range of potential studies.
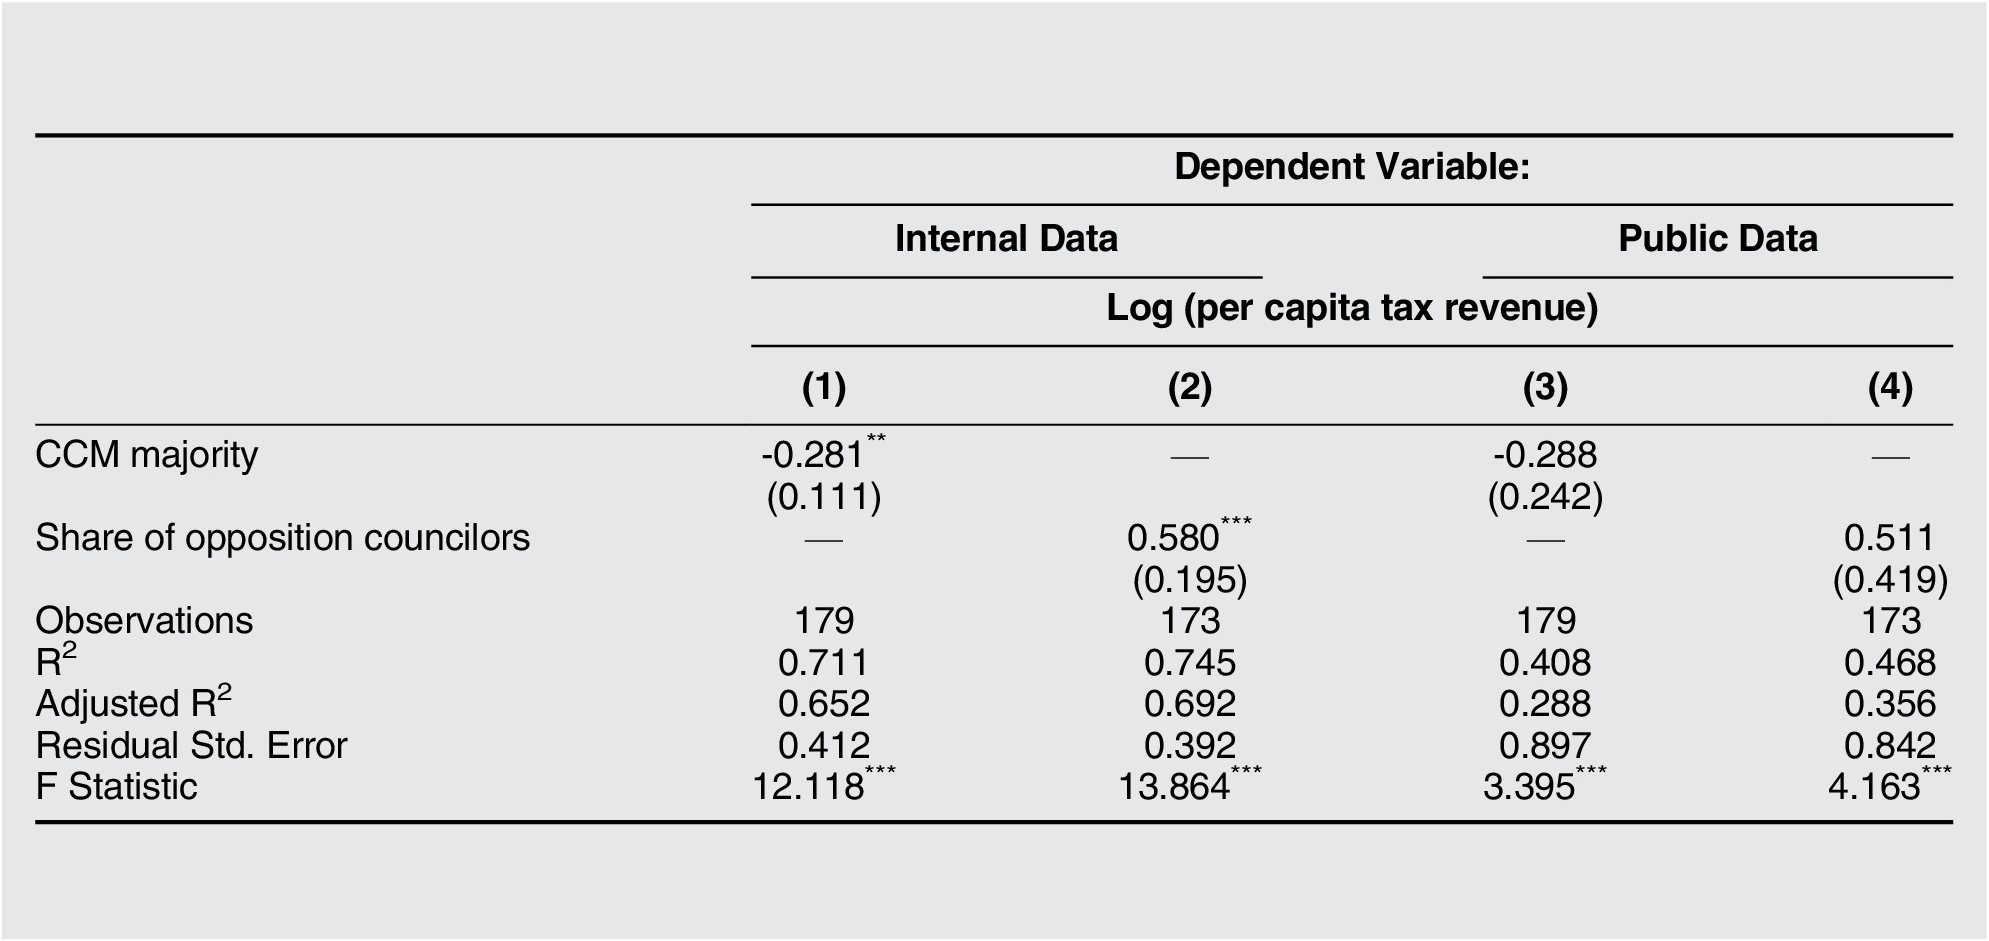
First, manipulation of the sort we detect may bias the results of any study that seeks to understand the effects of partisan control on local government performance. Table 2 plots the results of regression analysis investigating the effect of LGA partisanship on local revenue collection using both the internally validated and publicly available data. The analysis based on internally validated figures shows that opposition LGAs collect significantly higher total and per capita taxes. Likewise, an increase in opposition share increases per capita and total tax collection. Footnote 22 , Footnote 23 However, the significance of these relationships disappears when the public data is used. A researcher using the internal data would conclude that opposition councils indeed collect more taxes while a researcher using the public data would not find any significant effect of opposition control.
Effect of LGA partisanship on revenue raising

*p<0.1; **p<0.05; ***p<0.01
Note: Models include controls for population, administrative status, and region.
Manipulation of this sort can also change the results of studies which ostensibly have nothing to do with party politics. Consider a researcher who is interested in how increased bureaucratic capacity affects tax collection. As part of their study, the researcher may test the effect of administrative status (rural, town, city, etc.) on tax collection.Footnote 24 Because a disproportionate number of opposition councils are urban, the results of this study may be biased because opposition performance and hence urban performance is underestimated. Indeed, the two datasets generate significantly different results.Footnote 25 Because the manipulation may not be consistent across units or over time, it is difficult to control for it directly or through fixed effects.
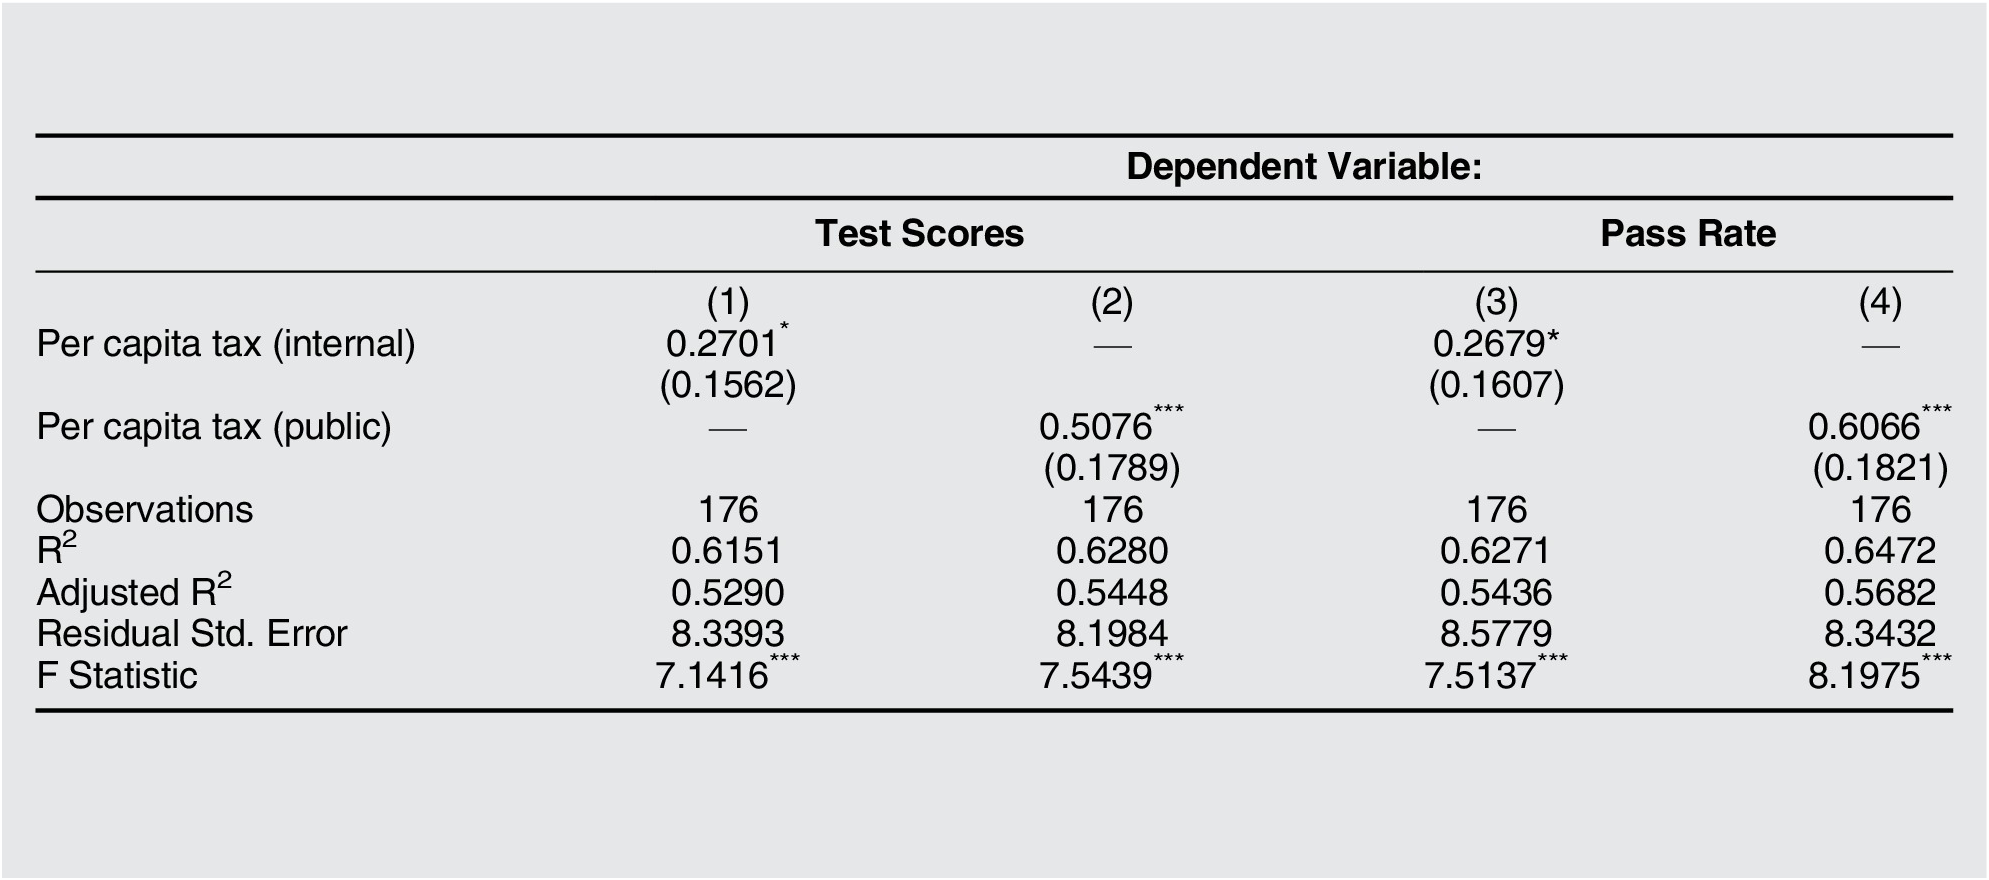
The manipulation we detect could also bias studies where local tax is used as the independent variable to proxy for state capacity. A scholar interested in how subnational variation in state capacity affects service delivery may look at the relationship between local tax takings and school performance. We show the results of this analysis in table 3. When we use the public data, we find a large and highly significant positive relationship between local tax capacity and two measures of school performance. When we use the internal data, the magnitude of the coefficients is halved and the relationship is no longer significant at the 0.05 level.
Effect of local tax capacity on service delivery

*p<0.1; **p<0.05; ***p<0.01
Note: Models include controls for population, administrative status, region, average level of education, and CCM control of the LGA. Per capita tax is in 1000s of TSH for easier interpretation. For every additional 1000 shillings collected, primary school test scores and pass rates in these tests increase by the coefficients shown.
Across all three analyses, we find that strategically manipulated data biases the results. Perhaps the most pernicious are flawed inferences about the relationship between regime support and a variety of “good” outcomes for the regime. Not only does this risk parroting pro-government propaganda in data form, it can also lead to flawed inferences about why people support the regime and how the regime rewards supporters. Furthermore, public data may underestimate what the incumbent wants to hide, like opposition performance or discrimination in access to public resources. This makes it harder for anti-regime actors to claim credit or point to government abuses of state power. As a result, scholars may fail to appreciate the role of these actors in non-democratic systems.
We realize that most scholars do not have access to both public and internal figures to identify the kind of manipulation we find. In what follows, we therefore outline a framework for anticipating and identifying data manipulation in order to reduce the risk of flawed inferences such as those discussed here.
Anticipating and Identifying Data Manipulation
This reflection is not intended to discourage scholars from taking advantage of newly available data from non-democratic regimes. However, we urge caution and reflection on the politics of data production and dissemination and suggest some additional steps to convince readers of the reliability of such data. Even researchers interested in questions that seem far removed from the landscape of political competition and control should take heed since that very landscape may determine the quality of available data.
Anticipating the Risks
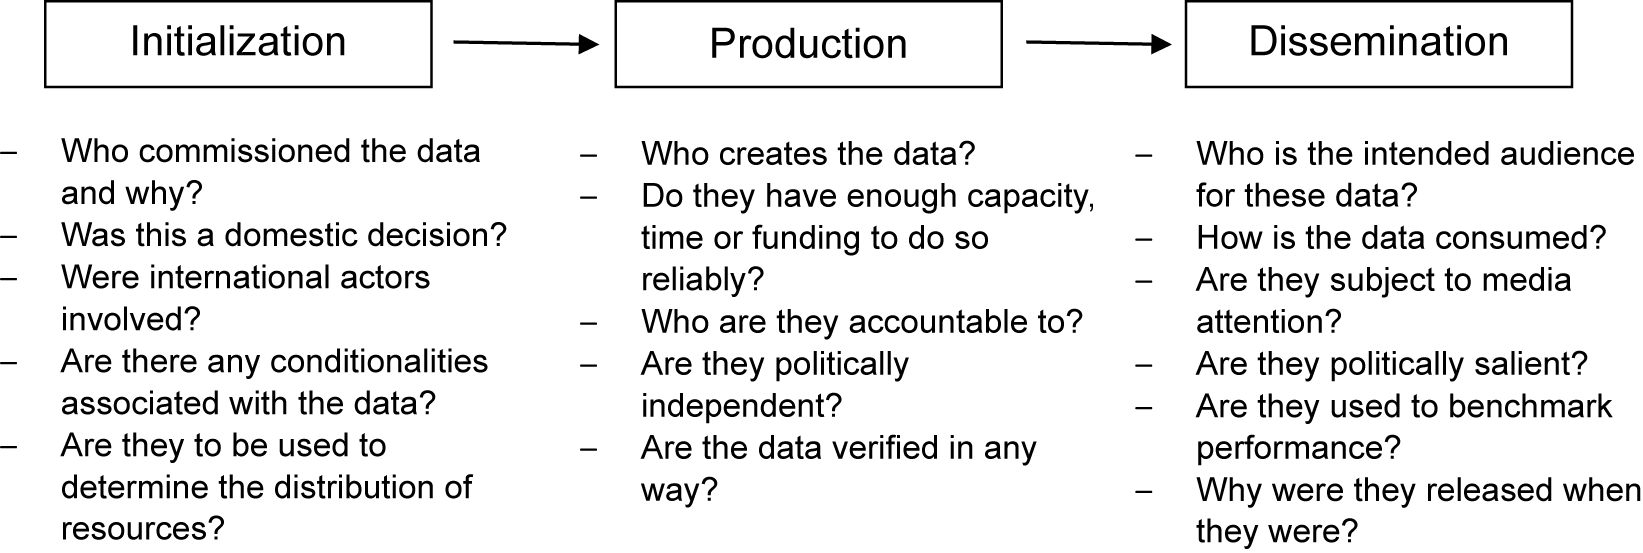
As a general rule, researchers should understand when data is at most risk of being manipulated and the types of flawed inference that falsified data may create. Wallace (Reference Wallace2016) argues that data is most likely to be manipulated if it is politically sensitive and is released at politically sensitive times. We concur and argue that scholars should be mindful of the whole process involved in commissioning, producing, and releasing data to the public. Data may be more or less reliable depending on political incentives at each stage from initialization to dissemination. In figure 2, we propose a set of questions scholars should ask themselves when trying to understand the risks of manipulation.
Political considerations at each stage of data production

First, researchers should consider who commissions the data and their motivation for doing so. This affects the audience(s) for whom the data is likely to be important, which in turn affects who stands to benefit or lose from the information that is released. For example, census data is collected to inform allocation of budgets and definition of electoral districts. Local performance data may be collected to benchmark central transfers. Elections in autocracies are partly held to gather information about the distribution of support that may then determine the distribution of resources. Data may also be collected to convey information to international actors. For instance, GDP figures matter for international reputation and investment. Data on primary school enrolment, HIV/AIDS, malnutrition, and other socioeconomic outcomes are relevant to tracking progress toward the Sustainable Development Goals, determining foreign aid envelopes, and informing external perceptions of domestic performance in low-income countries, which can in turn affect foreign direct investment. Data which are likely to influence the allocation of resources to a country or within it are particularly at risk of being manipulated.
Second, the production stage—who generates the data, their capacity, and their incentives—is likely to influence data quality and the ease with which it can be manipulated. Highly ambitious data collection projects that have little oversight and low budgets are more likely to be unreliable. Data produced by bureaucrats subject to political pressure are more likely to be manipulated as is the case in the example explored in the previous section. On the other hand, data that is endorsed by civil society organizations or international organizations with in-country presence are less likely to be manipulated because of additional oversight.
Third, dissemination – the audience for the data and its salience—is the last and perhaps most important stage of the process. Data that is primarily for internal use and released on open data platforms as a matter of course is significantly less likely to be manipulated than data that may be covered in the national press. Political salience is also an important consideration. Data may gain salience for a variety of reasons. Earlier, we showed how data can become salient when it measures subnational performance. In our example, the data is reported regularly in the press and is a politically salient benchmark for parties’ performance. Note that performance may be measured using data that is idiosyncratic to a given country. In our Tanzanian example, local tax is an important metric of performance. In Rwanda, maternal mortality is regularly reported to measure local performance (Worley Reference Worley2015). In Mexico, murder rates are fundamentally important for the credibility of state governments. Indeed, they are thought to be manipulated in some cases (Telesur Reference Telesur2017).
Know Your Data, Know Your Case
As we have shown, data is not produced in a vacuum. Without a good grasp on the politics of data in their country of study, it is difficult for researchers to understand which data is most likely to be manipulated. Without case knowledge, it is also difficult for researchers to preempt the kinds of manipulation that incumbents might have incentives to make and, hence, what threats to inference they face when analyzing data. We therefore encourage researchers to gain familiarity with the context in which their data is produced—talking to and co-authoring with local scholars and case experts, as well as trying to validate subnational data with local bureaucrats, politicians, and members of civil society. Where possible, they should also make use of comparable questions in validated, independent data like the Barometer surveys or Demographic and Health Surveys. All these strategies allow scholars to generate a baseline against which they can appraise the public data they are using. These kinds of simple “sniff tests” protect researchers from publishing work based on manipulated data.
Similarly, scholars should also get to know their data before diving into analysis. We recommend that researchers use their priors about the data generating process relevant to their area of interest in order to look for deviations from it that may suggest manipulation. Exploratory analysis—initial investigations to discover patterns, spot irregularities, and check assumptions with the help of summary statistics and graphical representations—is especially important when dealing with potentially risky data. If scholars have concerns about the quality of their data, they can use digit analysis and other fraud detection techniques. Other examples of such tests include the Whipple and Myers Indices, which provide summary measures of “heaping” on numbers ending in 0 or 5 (Borkotoky and Unisa Reference Borkotoky and Unisa2014). These measures are most commonly applied to detect incorrect information on age in population data. Scholars have also developed a variety of regression-based approaches that involve the estimation of statistical models and examine irregularities, anomalies, or outliers (Alvarez and Katz Reference Alvarez, Katz, Alvarez, Hall and Hyde2008; Myagkov, Ordeshook, and Shakin Reference Myagkov, Ordeshook and Shakin2009; Wand et al. Reference Wand, Shotts, Sekhon, Mebane, C. Herron and Brady2001). We contend that these techniques, developed to detect falsification of population and election data, should be applied more broadly to administrative data released by authoritarian governments.
Ultimately, engaging with the “politics of data” can lend greater credence to the inferences drawn from newly available data. As in discussions of research design, where scholars make the case that their samples are representative or demonstrate balance across samples when leveraging natural experiments, scholars should also work to convince readers why and to what extent they are convinced of the quality of their data. Furthermore, they should acknowledge any possible bias and its suspected direction. By being upfront about such issues, scholars can demonstrate an awareness of risks and signal an effort to minimize them. This makes it easier for readers to transparently engage with their work.
Finally, we call on scholars and civil society to track data censorship and manipulation. Organizations like V-Dem and Freedom House should consider incorporating data censorship and manipulation into their existing work tracking other forms of suppression. Measures of data censorship are critical for scholars to understand the likelihood that the data they are using is compromised and therefore the level of caution they should exercise when using it. Furthermore, as data journalism becomes increasingly prominent, these kinds of measures are even more important for civil society and the press to be able to appraise what conclusions can be drawn from official statistics and what claims should be questioned.
Supplementary Materials
To view supplementary material for this article, please visit http://dx.doi.org/10.1017/S1537592720001346.