I. INTRODUCTION
Polymeric substrates are of interest for flexible electronic applications because of their flexibility, relative ease of production, and lower cost. However, many conventional polymers are insulators and their electronic properties do not meet the requirements for device applications. Hybridization of such polymers can alter their electronic properties along with many properties, which can enable those low cost conventional polymers to be used for flexible electronic applications. Hybrid materials consisting of mixed organic and inorganic constituents show the ability to create novel materials for applications including biosensing, Reference Bonanno and Segal1 electronics, Reference Bouclé, Ravirajan and Nelson2 optics, Reference Sanchez, Lebeau, Chaput and Boilot3,Reference Floch and Belleville4 and catalysis. Reference Wight and Davis5,Reference Lim and Stein6 These materials were fabricated using techniques including sol–gel, Reference Judeinstein and Sanchez7 molecular layer deposition, Reference Gong, Peng and Parsons8–Reference Dameron, Seghete, Burton, Davidson, Cavanagh, Bertrand and George10 and layer-by-layer deposition Reference Li, Mannen, Schulz and Grunlan11,Reference Li, Schulz, Mannen, Delhom, Condon, Chang, Zammarano and Grunlan12 by incorporation of organic and inorganic building blocks via chemical synthesis. An alternative approach to form hybrid materials is to modify either organic or inorganic materials with reactive precursors to incorporate the other kind of material. The process, referred to herein as sequential vapor infiltration (SVI), Reference Akyildiz, Padbury, Parsons and Jur13–Reference Gong, Spagnola and Parsons15 is like similar vapor phase infiltration methods (such as multiple pulsed vapor phase infiltration Reference Lee, Ischenko, Pippel, Masic, Moutanabbir, Fratzl and Knez16–Reference Lee, Pippel, Moutanabbir, Gunkel, Thurn-Albrecht and Knez18 and sequential infiltration synthesis Reference Peng, Tseng, Darling and Elam19–Reference Tseng, Peng, Ocola, Elam and Darling21 ) that utilize organometallic precursor vapors to modify polymers.
These infiltration processes, originally inspired by atomic layer deposition (ALD) on polymers, have shown three primary nucleation behaviors based on the chemical structure of the polymer. Reference Wilson, Grubbs and George22,Reference Jur, Spagnola, Lee, Gong, Peng and Parsons23 First, polymers whose surface is covered with reactive functional groups that strongly react with the ALD precursor, such as trimethylaluminum (TMA) exposed to cellulose, form a conformal coating on the polymer surface with no evidence of infiltration into the polymer. Reference Jur, Spagnola, Lee, Gong, Peng and Parsons23 Second, ALD on polymers with no reactive functional groups such as polyethylene and polypropylene shows a significant diffusion of the precursors into the polymer, particularly at high temperatures. Subsequent exposures to the secondary ALD reactant (i.e., H2O), with the organometallic precursor still in the bulk of the polymer, produce a chemical vapor deposition (CVD)-like island growth in the subsurface of the polymer. Reference Wilson, Grubbs and George22,Reference Jur, Spagnola, Lee, Gong, Peng and Parsons23 Finally, and of importance to this work, is the observation of an intermediate state in which both diffusion and reaction can occur between the organometallic and the polymer. That is, polymers with functional groups that are susceptible to ALD reaction (i.e., C=O) have shown the evidence of an organic–inorganic hybrid layer beneath the ALD inorganic thin film, resulting from the organometallic diffusion into the polymer and reaction during ALD cycling. Reference Gong, Peng, Jur, Devine, Lee and Parsons14,Reference Jur, Spagnola, Lee, Gong, Peng and Parsons23,Reference Sun, Padbury, Akyildiz, Goertz, Palmer and Jur24
Each of the proposed infiltration techniques has slight differences in processing, yet they all depend on extended exposures to ensure diffusion and reaction of the precursors in the bulk polymer. In particular, SVI uses an elongated hold stage in which the organometallic is isolated with the polymer substrate to increase the exposure. This hold stage can be repeated with a new precursor dose to extend the reaction. In practice, SVI can produce the hybrid modification in a single exposure and hold sequence. Using infiltration methods, improvement in mechanical properties of biopolymers, Reference Lee, Ischenko, Pippel, Masic, Moutanabbir, Fratzl and Knez16–Reference Lee, Pippel, Moutanabbir, Gunkel, Thurn-Albrecht and Knez18,Reference Poodt, Lankhorst, Roozeboom, Spee, Maas and Vermeer25 enabling block copolymer lithography for the formation of nanoscopic structures, Reference Peng, Tseng, Darling and Elam19–Reference Tseng, Peng, Ocola, Elam and Darling21 and synthesis of mesoporous structures for catalysis applications Reference Gong, Peng, Jur, Devine, Lee and Parsons14,Reference Gong, Spagnola and Parsons15 have been demonstrated in the literature on many carbonyl containing polymers such as polyamides, Reference Akyildiz, Padbury, Parsons and Jur13 polyesters, Reference Gong, Peng, Jur, Devine, Lee and Parsons14 poly(methyl methacrylate), Reference Peng, Tseng, Darling and Elam26 and spider silk. Reference Lee, Pippel, Goesele, Dresbach, Qin, Chandran, Braeuniger, Hause and Knez17 This work is intended to examine how the process behavior can enable control over the hybrid modification and for the first time demonstrates the effect that this materials processing has on the optical behavior of the polymer.
Previous work has reported that the SVI hybrid film formation on polyamide 6 (PA6) high surface area fabrics using TMA is dependent on temperature and exposure conditions, showing a maximum of ∼15 wt% increase after 10 exposure cycles of 2 s dose and 60 s hold. Here, we present data on SVI of polyethylene terephthalate (PET) fibers using the same precursor chemistry and demonstrate the increased growth of materials (up to ∼55 wt%). The influence of the temperature on the change in chemical composition and structure was analyzed using Fourier transform infrared (FTIR) spectroscopy as well as cross-sectional analysis using transmission electron microscopy (TEM) and atomic force microscopy-infrared spectroscopy (AFM-IR) technique.
Finally, the demonstrations of change in luminescent characteristics of the PET fibers were investigated by using photoluminescence (PL) spectroscopy. Polyesters are commonly used in textiles, food packaging, and electrical insulation due to ease of their production and high resistance to chemicals and temperature. Electroluminescence and PL of polyesters have been studied previously in relation to the space charge that is accumulated on these polymers as a result of their insulating nature. Reference Mary, Albertini and Laurent27,Reference Teyssedre, Mary and Laurent28 Following UV excitation, PET shows two PL bands in the blue spectrum. The band with lower wavelength has been attributed in the literature to the luminescence of monomers, and the higher energy luminescence is attributed to the polymer chain interactions called excimer emission. Reference Kim, Davis, Cain and Grunlan29–Reference Teyssedre, Menegotto and Laurent31 Upon alumina-hybrid infiltration, the intensity of luminescence increased an order of magnitude with a slight red shift. This is attributed to the increase in excimer emission of the materials from alumina attachment to the carbonyl groups of the polymer. These significant changes in the optical properties of PET show promising capabilities of SVI in terms of optical tailoring of organic molecules. Specifically, the formation of these materials on high surface area porous textile structures can enable new means for flexible/wearable electronics, including platforms for sensing based on optical characteristics.
II. EXPERIMENTAL
SVI experiments were conducted using a custom-designed flow tube type reactor described previously. Reference Akyildiz, Padbury, Parsons and Jur13 Precursors TMA (STREM chemicals CAS no. 75-24-1, 98% purity, Newburyport, MA) and high purity water (Sigma Aldrich, biotechnology performance certified grade, CAS no. 7732-18-5, St. Louis, MO) were used as obtained. Precursors were delivered to the system via a N2 (Airgas National Welders, 99.999%, Raleigh, NC) flow, and the pressure of the system was maintained at 1 Torr during purge cycling. Following an initial 5 min purge, samples were exposed to TMA cycles consisting of 0.5 s dose, 30 s hold, and 30 s purge. After the TMA cycles are completed, the reactor chamber is evacuated for 5 min, before exposure to H2O cycles to oxidize any unreacted methyl groups with a sequence of 0.2 s dose, 30 s hold, and 30 s purge.
PET round fiber (RF) and winged fiber (WF) were treated with SVI, and their mass gain was calculated as a weight percentage using the initial and final weight of the sample. The final mass of the samples was measured after the samples were equilibrated for approximately 2 h. This time was found to be more than sufficient for PET because of its low inherent moisture gain (0.4%). Other polymers, such as PA-6 (4%), require longer equilibration times due to their high moisture content. Reference Akyildiz, Padbury, Parsons and Jur13 RFs with an average diameter of ∼25 μm were obtained in the form of woven fabric made of 100% PET 330/70 denier multifilament yarns with a 2/1 twill structure. High surface area (3 m2/g) WFs with an average diameter of 1 μm were obtained from Allasso Industries as hydroentangled nonwoven fiber mats. During SVI experiments, the temperature varied from 60 to 150 °C and exposure conditions were varied by a number of TMA cycles (1–90).
SEM micrographs were obtained using a Phenom G1 desktop SEM. Prior to imaging, samples were sputter coated with ∼10 nm gold/palladium thin films using a Quorum Technologies SC7620 Mini Sputter Coater (East Sussex, UK). FTIR analysis was conducted using a Nicolet Nexus 470 FTIR spectrophotometer (Rochester, NY) with attenuated total reflectance (ATR) equipment using a germanium crystal. 64 scans were performed over a range from 4000 to 700 cm−1 and averaged for each spectrum reported. Samples for AFM-IR were prepared using a Leica UC7 Ultracut diamond knife microtome. The microtome samples were prepared by first embedding the fibrous yarn samples in Devcon 2 Ton epoxy resin and then cured overnight at room temperature. The blocks were then cut to a thickness of 200–300 nm at room temperature. All AFM-IR images and spectra were collected on a nanoIR™ instrument (Anasys Instruments, Santa Barbara, CA) and a 450-µm-long contact mode cantilever (0.1 N/m). For TEM analysis, fibrous yarn samples were embedded into Spurr low viscosity epoxy resin (Ladd Research Industries, Williston, VT) and then cured overnight at room temperature. A Leica Ultracut diamond knife microtome was used to cut films with a thickness of ∼100 nm. Films were floated on deionized water to place them on Cu TEM grids coated with ultrathin amorphous carbon. TEM micrographs were obtained by using Hitachi HF 2000 with a 200 kV cold emission source. Energy dispersive x-ray (EDX) microanalysis was unable to be performed with a suitable spot size dimension without damaging PET. X-ray diffraction (XRD) data were obtained using a Panalytical Empyrean x-ray diffractometer using a Cu anode producing K-Alpha x-rays of 1.54 Å.
PL spectra were obtained from samples mounted in air using a 30 cm grating spectrometer and a Princeton Instruments Spec-10 liquid nitrogen cooled charge coupled device detector. The light source was a continuous wave xenon arc lamp with a monochromator used to adjust the wave length.
III. RESULTS AND DISCUSSIONS
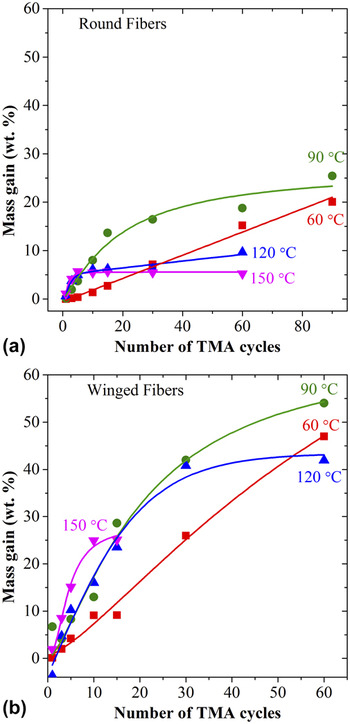
Figures 1(a) and 1(b) show the mass gain of RFs (low surface area) and WFs (high surface area), respectively, measured as a function of number of consecutive SVI cycles of TMA at reactor temperatures from 60 to 150 °C. For low and high surface area samples, a decrease in the highest mass gain is observed as the process temperature increases. This is consistent with our previous analysis of TMA SVI on PA6 fibers. Reference Akyildiz, Padbury, Parsons and Jur13 In that analysis, the mass gain saturation occurred for all temperatures within ∼10 SVI cycles. Here, the saturation on PET fibers shows a dramatic delay with decrease in temperature. At 60 °C, a nearly linear increase of mass gain up to 90 SVI cycles is observed with no sign of saturation in mass gain. At an infiltration temperature of 90 °C, a saturation behavior is observed by around 15 cycles for low surface area fabric and 30 cycles for high surface area fabric. As the temperature increases, the number of cycles to saturation continues to decrease from 120 to 150 °C.
Mass gain of (a) RFs and (b) WFs as a function of number of TMA cycles at temperatures varying between 60 and 150 °C. TMA cycles were conducted with a sequence of 0.5 s dose/30 s hold/30 s purge and H2O cycles of approximately half number of the TMA cycles were conducted with a sequence of 0.2 s dose/30 s hold/30 s purge.

SVI is enabled by the diffusion of precursors and the diffusion is limited by high reaction rates at higher temperature. Data in Fig. 1 support this previously proposed reaction mechanism. At low temperature (i.e., 60 °C), the linear growth per TMA cycle suggests that the diffusion of the precursor into polymer matrix is possible until all the available sites (free volume and reactive sites on the backbone of the polymer) are satisfied. However, the slope of the line at 60 °C is lower compared to the linear parts of the high temperature samples. This can be attributed to the slower diffusion rates at lower temperatures. As we increase the process temperature, a rapid increase in the mass gain is observed with a corresponding increase in the initial slope. At the higher temperatures, the mass gain saturates quickly indicating that no precursor is diffused into the samples for subsequent reaction. We think that this deceleration of diffusion is a result of higher reaction kinetics, which forms a dense hybrid layer close to the surface, so the penetration of the additional precursors is blocked.
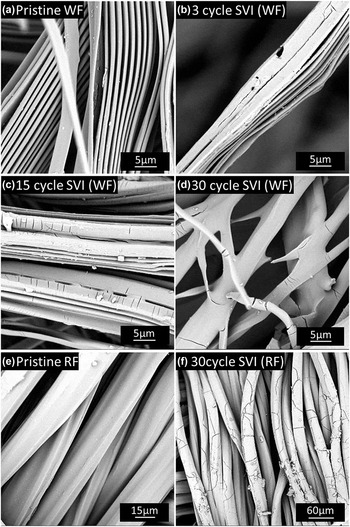
The influence of the surface area [Fig. 1(a) versus Fig. 1(b)] is evident. The increased surface area allows for an increased mass gain. However, inspection by SEM, provided in Figs. 2(a)–2(d), shows that the morphology of the high surface area fibers undergoes a dramatic change after SVI processing, whereas RFs retain their shape. This coalescence of the winged structure is observed as the number of the SVI cycles increases. Cracks are formed on the surface of the fibers along with the coalescence of the winged structure. In contrast, low surface area PET RFs do not show fiber coalescence, but still form cracks on the surface, as shown in Figs. 2(e) and 2(f).
SEM micrographs of (a) untreated, (b) 3 cycle, (c) 15 cycle, and (d) 30 cycle SVI treated WFs, (e) untreated, and (f) 30 cycle SVI treated RFs showing the change in the fiber morphology upon SVI treatment. All the treatments are at 60 °C.

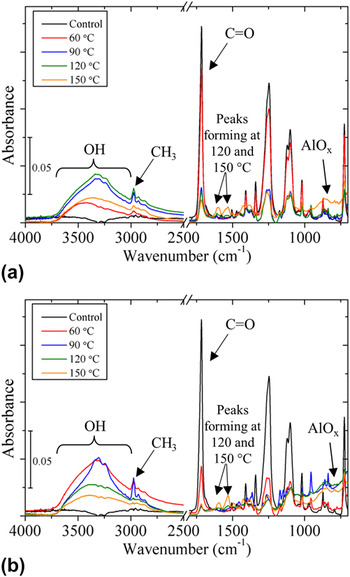
Figures 3(a) and 3(b) present FTIR-ATR results after 10 and 60 TMA SVI cycles, respectively, of round PET fibers at reactor temperatures of 60, 90, 120, and 150 °C. As shown in Fig. 3(a), the peak related to the C=O group at ∼1735 cm−1 decreases in intensity after SVI processing and generally decreases in intensity with an increase in temperature. This trend is also observed after 60 SVI cycles in Fig. 3(b), although the peak intensity is much lower in comparison to the untreated control sample. This C=O feature can be considered to follow the extent of the reaction in the near surface region of the polymer. Reference Gong, Peng, Jur, Devine, Lee and Parsons14,Reference Spagnola, Gong, Arvidson, Jur, Khan and Parsons32 As such, the lower temperature processing results in less near surface consumption of the PET C=O functionality by the ligand exchange reactions between TMA and C=O groups as explained in the literature. Reference Akyildiz, Padbury, Parsons and Jur13,Reference Gong, Peng, Jur, Devine, Lee and Parsons14,Reference Parsons, Atanasov, Dandley, Devine, Gong, Jur, Lee, Oldham, Peng and Spagnola33 At 10 SVI cycles, this is in agreement with mass gain analysis [Fig. 1(a)]: Initial extent of reaction is higher at increased temperatures, but it is less clearly differentiated than at higher numbers of SVI cycles.
FTIR spectra of SVI treated fabrics made of RFs after (a) 10 TMA cycles and (b) 60 TMA cycles. Samples are treated under similar exposure conditions (TMA cycle: 0.5 s dose/30 s hold/30 s purge and H2O cycle: 0.2 s dose/30 s hold/30 s purge).

Other than the reduction of the C=O peak intensity, there is additional spectral evidence of the formation of an organic–inorganic hybrid structure. First, the peak emerging at ∼2975 cm−1 is evidence of CH3 stretching, resulting from groups that form in ligand exchange reactions between the TMA precursor and the C=O group. Reference Gong, Peng, Jur, Devine, Lee and Parsons14 Second, the broad peak spanning from 3000 to 3750 cm−1 is due to the OH groups that form by the oxidation of Al(CH3) x ligand groups formed within the polymer matrix by the TMA polymer reactions during water cycles. Furthermore, Al–O interactions show up with a weak and wide peak at ∼775 cm−1 and have higher intensity at increased processing temperature.
Most interesting, are the new peaks that form in the fingerprint region, especially of the spectra obtained for 120 and 150 °C samples. After 10 SVI cycles, all samples show a low intensity peak at ∼1610 cm−1, which is in the literature attributed to Al–H Van der Waals interactions. Reference Pullumbi, Bouteiller and Manceron34,Reference Wang, Andrews, Tam, DeRose and Fajardo35 Other peaks may also be attributed to the deformation of polymer groups that are formed by the addition of TMA into the polymer. The peak at ∼1592 cm−1 may be attributed to a different conformation of the C=O group formed during SVI reactions as a result of CH3 addition to the ester group. Reference Lin and Lee36 In the literature, the peak at ∼1537 cm−1 is attributed to the CCO stretch in the CH2CHO Reference Jacox37 group, a functional group whose structure is very similar to what is formed by the SVI process. The literature reports a peak location of ∼1425 cm−1 for CH3COO2 (Refs. Reference von Ahsen, Willner and Francisco38 and Reference Bruckmann and Willner39) deformation or a methyl radical deformation. Reference Zhang, Zhang and Liu40 There is also another report showing that it can represent the –OH scissor group in water. Reference Thompson and Jacox41 However, the latter is not likely since it would be expected for other samples as much as for the 150 °C sample. The intensity of these peaks for 120 and 150 °C samples increases after 60 SVI cycles whereas these peaks are still not observable for low temperature samples. This is evidence of different reaction mechanisms for higher temperature samples.
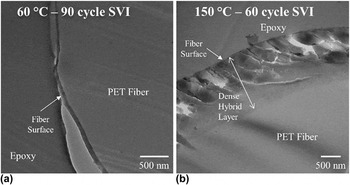
TEM was conducted on the cross-sections of the round PET fiber to examine the extent of the reaction into the subsurface region of the polymer at exposure temperatures of 60 and 150 °C, as presented in Fig. 4. The SVI treatment of 60 °C sample shows no distinct formation of a hybrid material, which would be indicated by a high light contrast compared to the polymer. In comparison, a distinct hybrid layer formation is observed for samples exposed at 150 °C. In addition, mechanical properties show a much more brittle material, as indicated by the cracks that are formed during the microtome cross-section preparation. Given the high mass gain of the 60 °C sample, it is predicted that the reacted vapor infiltration is more thorough and evenly dispersed into the cross-section of the fiber. Note that in Fig. 1(b), the 150 °C data are discontinued at 15 cycles because samples started to come out fractured after the SVI processing and an accurate mass could not be measured. The brittleness is attributed either to tension created by the dense SVI layer near the surface of the fiber or to chain scission reactions in the polymer. As observed through handling, the brittleness is greater for higher temperature SVI processing on the high surface areaWFs.
TEM micrograph of cross-section of RFs treated with (a) 90 TMA SVI cycles at 60 °C and (b) 60 TMA SVI cycles at 150 °C.

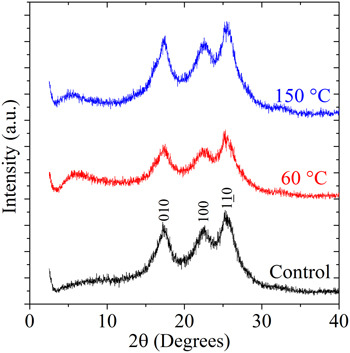
To understand the brittle nature of the hybrid materials observed in Fig. 4, the effect of SVI on the structure of the polymer was analyzed with XRD. XRD spectra of the pristine PET and samples treated with SVI at 60 and 150 °C are given in Fig. 5. Control samples showed three diffraction peaks at 2θ = 17, 22.5, and 25.5° corresponding to (100), (010), and (110) reflections, respectively, which defines the triclinic structure of the polymer as given in the literature. Reference Johnson42,Reference Daubeny and Bunn43 These peaks are observed on top of a broad peak spanning from ∼5 to ∼35° which identifies the amorphous regions of the polymer. After SVI processing, XRD spectra of the samples did not show significant changes except for a broad peak observed from ∼3.5 to ∼8° at both SVI treatment temperatures. These broad peaks are most likely attributed to the hybrid material formation. The broadness of the peak identifies the amorphous nature of the alumina–polymer hybrid materials and the low angle reflects the large size of the structures. The XRD data also suggest that the SVI reactions primarily occur within the amorphous regions of the polymer and result in a possibly more brittle material between the crystalline regions of PET. However, the flexibility of the polymer coming from the amorphous regions present in the polymer is decreased by the addition of AlO x to the backbone of the polymer as seen in the TEM images of Fig. 4.
X-ray diffraction spectra of the control and samples treated with SVI at 60 and 90 °C.

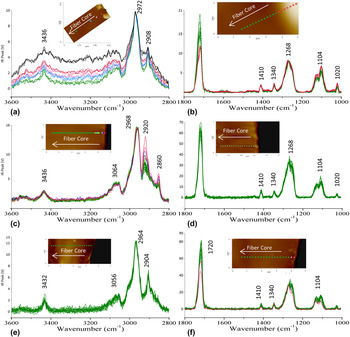
AFM-IR analysis was performed to examine the chemical constituent through the fiber cross-section in more detail. Figure 6(a) provides the high wave number spectra of the PET RFs treated with 60 cycles of TMA SVI at 150 °C. In the figure, three spectra are collected from each point shown in the AFM image. Of particular interest are peaks located at 3436, 2972, and 2908 cm−1 wave numbers. The peak at 3436 cm−1 is likely coming from the overtone band of the C=O group in PET. This peak is not visible in FTIR-ATR analysis due to the presence of a broad and strong OH peak. Peaks at 2972 and 2908 cm−1 can be attributed to the antisymmetric and symmetric stretches of CH2 groups in PET, respectively. Reference Bower44 Closer to the fiber surface intensity of these peaks decreases can be indication of the more hybrid material forming close to the surface. Figure 6(b) provides the low wave number region of the sample treated at 150 °C, showing peaks at 1720, 1410, 1340, 1268, 1104, and 1020 cm−1; Each normalized to the polymer C–O stretch at 1268 cm−1. All these peaks are attributed to the polymer functional groups that can be observed in the control sample except for 1020 cm−1 which can due to AlO x formation in the fiber. This peak is not seen in the control sample and formed only after SVI processing. It can either be a peak directly associated with AlO x vibrational modes as reported in the literature Reference Archibong and St-Amant45 or coming from a mode of PET that is activated by AlO x modification. Through normalization of the peaks, we are able to see that all the peaks coming from polymer show similar intensities, however, the C=O peak shows a sharp decrease as the analysis is performed closer to the surface. This transition point is emphasized in the spectra by showing low carbonyl amount colored as pink and rest colored green. At this point, the AFM image also shows a higher topography, which is attributed to the hardness change and corresponds to the dense surface layer observed in the TEM micrographs [Fig. 4(b)].
AFM-IR spectra and AFM images of cross-sections of RFs treated with (a) high wave number (normalized at 2972 cm−1), (b) low wave number (normalized at 1268 cm−1) 60 TMA SVI cycles at 150 °C, (c) high wave number (normalized at 2968 cm−1), (d) low wave number (normalized at 1268 cm−1) 90 TMA SVI cycles at 90 °C, (e) high wave number (normalized at 2964 cm−1), and (f) low wave number (normalized at 1268 cm−1) 90 TMA SVI cycles at 90 °C after 1 h heat treatment at 150 °C.

In Figs. 6(c) and 6(d), high and low wave number spectra of the sample treated with 90 TMA cycles SVI at 90 °C are given. At high wave number region, we see peaks at 3436, 3064, 2968, 2920, and 2860 cm−1. Again, the peak at 3436 cm−1 is attributed to the overtone band of the C=O group in PET and the peak at 2968 cm−1 is attributed to the antisymmetric stretch of the CH2 group in PET. The 2908 cm−1 peak shown in Fig. 6(a) can be observed as a shoulder on the 2920 cm−1 peak. Peaks at 2920 and 2860 cm−1 are attributed to the methyl (CH3) stretches Reference Kvisle and Rytter46,Reference O'Brien and Ozin47 attached to the polymer backbone as a result of reactions taking place between C=O groups and TMA precursor. Reference Gong, Peng, Jur, Devine, Lee and Parsons14,Reference Parsons, Atanasov, Dandley, Devine, Gong, Jur, Lee, Oldham, Peng and Spagnola33 These peaks show higher intensity closer to the surface suggesting that more TMA polymer reactions take place closer to the surface. The low wave number region shows peaks at exactly the same wave numbers as the 150 °C sample. However, all the peaks show similar intensities. Since the CH3 peaks and AlO x peak are observed, this can be attributed to a more homogeneous composition of the sample within the measured section.
To further investigate the reasons for the differences in the spectra of different temperature samples, the same cross-sectioned sample shown in Figs. 6(c) and 6(d) is heated for 60 min at 150 °C under an ambient atmosphere. Spectra of high wave number and low wave number regions are given in Figs. 6(e) and 6(f), respectively. In the high wave number region, we observe that spectra are very similar to the spectra in Fig. 6(a) with the peaks at 2964 and 2904 cm−1. The peaks observed at 2920 and 2860 cm−1 in Fig. 6(c) disappear. This can be an indication that the hybrid material structure, which is formed at low temperatures, forms metastable metal organic coordination complexes as suggested in the literature. Reference Parsons, Atanasov, Dandley, Devine, Gong, Jur, Lee, Oldham, Peng and Spagnola33 Upon heat treatment, these coordination complexes transition to more stable chemistries or structures. Furthermore, in the lower energy spectra, the intensity of the peak at 1020 cm−1 is decreased at the surface. This is attributed to the change in the AlO x structure by further oxidation of these groups.
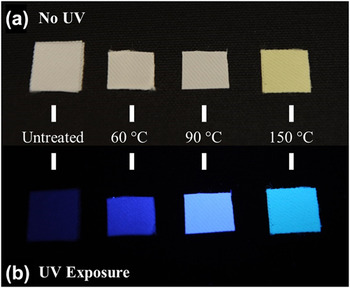
Of high interest is the ability to create new hybrid materials characteristics within the textile construct. In this work, the PL of the PET fabrics has shown significant changes upon SVI processing. Figure 7 shows that PET RF, woven fabrics emit stronger PL after SVI processing when they are exposed to UV illumination. The samples processed at 60 and 90 °C show similar color and intensity illumination to the eye whereas the sample treated SVI at 150 °C shows green hue. Even though samples do become more rigid after SVI process, the textile is still flexible and the luminescent appearance is not changed with flexing or handling. Samples treated at higher temperatures come out of the reactor with a bright yellow color whereas low temperature samples come out with an original white color. As we discussed during FTIR-ATR analysis, high temperature SVI processed samples show various peaks associated with different species formation. This color change can be due to the color providing nature of some of those species. For example, quinone radicals, which are known to be giving yellow color, show FTIR peaks at 1518, 1536, and 1504 cm−1 due to the C=O stretching mode as reported in the literature. Reference Burie, Boussac, Boullais, Berger, Mattioli, Mioskowski, Nabedryk and Breton48 The FTIR peaks in the fingerprint region discussed above can be attributed to the quinone-like structures.
Comparison of untreated PET samples and those treated with SVI at 60, 90, and 150 °C (a) under natural lighting and (b) under UV illumination.

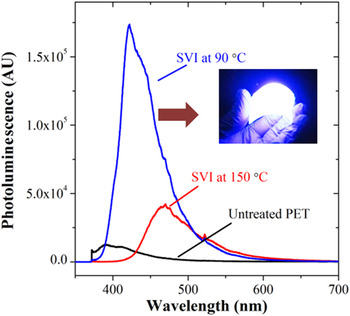
To analyze the visible wave length emission of the fibers, room temperature PL spectroscopic analysis at λex = 355 nm was conducted on control fabrics and on samples treated by SVI and the resulting spectra are given in Fig. 8. The control, untreated fabric shows peaks at 400 and 425 nm and has been attributed in the literature to monomer emission and interchain interactions (i.e., excimer), respectively. Reference Takai, Mizutani and Ieda30,Reference Teyssedre, Menegotto and Laurent31 After the SVI treatment at 90 °C, the PL intensity is increased by ∼13x with a slight red shift, showing an emission band at 425 nm and a shoulder at 450 nm wave length. This strong emission at 425 nm can be attributed to the increased interchain interactions as a result of Al–OH formation during SVI. Treatments at 150 °C on the other hand show ∼3x increase in the PL intensity and a higher red shift than 90 °C samples with a single broad emission band at 472 nm. This shift in the emission can be seen optically in Fig. 7 as well.
Room temperature PL spectra conducted on control fabrics and 90 and 150 °C SVI treated fabrics excited at λex = 355 nm.

These optical responses can be explained by the difference in reaction mechanisms at different temperatures as presented in the FTIR and AFM-IR analyses. Thus, the process temperature of SVI determines the chemical and physical structure of the hybrid material. Difference in PL mechanism can be caused by subtle differences in chemical species formed at the different temperatures. For example, at low temperatures metal organic coordination complexes can be formed via TMA carbonyl group reactions whereas at higher temperatures chain dissociation by TMA can be more effective, which likely results in different emission mechanisms. Reference Parsons, Atanasov, Dandley, Devine, Gong, Jur, Lee, Oldham, Peng and Spagnola33 The difference in intensity can be explained by the lower mass gain observed at higher temperatures (Fig. 1) or by the absorption of the emitted light by the color providing structures formed at high temperature SVI processing.
IV. CONCLUSIONS
The effects of temperature, exposure conditions, and surface area on the SVI process into PET fibers are explored. Increasing process temperature decreases the mass gain of the SVI process as a general trend. A linear mass increase with a number of TMA cycles was observed at 60 °C but at higher temperatures such as 90, 120, and 150 °C initial cycles show a rapid increase in mass gain before saturation behavior is observed. Saturation behavior becomes clearer as the temperature increases to 150 °C. This phenomenon is interpreted as the increasing temperature speeds the reaction kinetics, forming a barrier layer at the surface of the polymer that slows down the diffusion of the reactant. This idea is supported with the FTIR-ATR and AFM-IR analyses of these fibers and TEM micrographs of cross-sections of fiber. The structure of the hybrid materials formed during SVI is studied with XRD, which demonstrated that hybrid materials formed during SVI show amorphous nature. PL analysis of SVI treated PET fabrics shows the ability of tailoring the luminescent behavior of organic materials. Furthermore, the mechanism of the SVI process is shown to affect the resulting material optical properties. In general, luminescence is increased by incorporation of alumina into the bulk polymer while the substrate remains flexible and porous. As a result of this work, many carbonyl containing polymers often made inexpensively and applied range of constructs (including textiles) may be enabled by SVI processing toward applications in organic/flexible electronics.
ACKNOWLEDGMENTS
We would like to acknowledge Roberto Garcia from Analytical Instrumental Facility of North Carolina State University for his help for microtome. Authors also acknowledge partial funding from National Science Foundation Industry & University Cooperative Research Program: Center for Dielectrics and Piezoelectrics (CDP) (Grant No. 1361503), Army Competitive In-house Innovative Laboratory Research Grant, and Ministry of National Education of Republic of Turkey.