Introduction
Morphometric studies are widely used for species classification (Doyle et al., Reference Doyle, Gammell and Nash2018). Even with the availability of molecular analysis, the use of morphometry remains an integrative tool, and combined with other variables (e.g. phylogeography, population genetics, animal behaviour and ecology) allows more accurate classification of species (Padial et al., Reference Padial, Miralles, De la Riva and Vences2010). Besides that, the high cost of molecular analysis can be a challenge and a morphometric approach, with relatively low costs, is a good complement for these studies.
The use of body measurement proportions is a classic morphometry tool widely used in animal species, mostly in articulated organisms (e.g. arthropods) (Baur et al., Reference Baur, Kranz-Baltensperger, Cruaud, Rasplus, Timokhov and Gokhman2014; Chanu et al., Reference Chanu, Gupta and Gupta2021). This technique can be improved through integration of two or more proportions (e.g. ratios of width and length), and applied multivariate statistical analyses to become more effective and distinguish a subtle pattern between species that can reveal a hidden population structure or arrive at a better delineation of groups (Baur & Leuenberger, Reference Baur and Leuenberger2011).
In gastropod molluscs, shell shape morphometrics is one of the most important methods for the identification of groups, in addition to establishing intraspecific variations, latitudinal variations and ecological relationships (Cruz et al., Reference Cruz, Pante and Rohlf2012; Haumahu & Uneputty, Reference Haumahu and Uneputty2018; Hamli et al., Reference Hamli, Hamed, Azmai and Idris2020; Matos et al., Reference Matos, Matthews-Cascon and Chaparro2020). However, the study of shell shape ratios is poorly reported in the literature (Hamli et al., Reference Hamli, Hamed, Azmai and Idris2020). Here, we used this methodology to check if this morphometric ratio is able to discriminate interspecific variations in four species of neritids.
The species of Nerita Linnaeus, 1758 have a wide variety of colours, stripe patterns and shell ornaments, which historically caused numerous synonyms, making the group's taxonomy difficult and reducing its number of studies (Prado, Reference Prado1998; Tan & Clements, Reference Tan and Clements2008; Susintowati et al., Reference Susintowati, Puniawati, Poedjirahajoe and Handayani2018). Neritids are widely recognized due to the globular shell, with little whorl, and spire generally low (Rios, Reference Rios2009). Also, the replacement of columella by one septum is a major feature for taxonomy (Ponder & Lindberg, Reference Ponder and Lindberg1997). These gastropods are present in tropical and subtropical regions, being found in marine, brackish and freshwater environments, distributed in the intertidal bands, where they feed on algae (Cascon et al., Reference Cascon, Pinheiro and Matthews1990; Tan & Clements, Reference Tan and Clements2008).
Susintowati et al. (Reference Susintowati, Puniawati, Poedjirahajoe and Handayani2018) proposed the use of morphometric characteristics of the shell and operculum in neritid taxonomy. However, it is not always possible to analyse samples which have physical and structural integrity. Moreover, the samples can be damaged, such as having lost the operculum, protoconch and colour. Therefore, optimizing the use of the morphometric variables in shell shape is important.
Recently, Altomari et al. (Reference Altomari, Alves, Santos, Santos, Barros, Bezerra, Herrmann and Chagas2021) found a significant correlation between the morphometric variables in shell shape of the species Nerita fulgurans Gmelin, 1791, Nerita peloronta Linnaeus, 1758, Nerita tessellata Linnaeus, 1758 and Nerita versicolor Gmelin, 1791. The correlation between the morphometric variables was also found by Echem (Reference Echem2017) when characterizing the relationships between biomass and morphometry of Nerita albicilla Linnaeus, 1758.
Based on the aforementioned, this study aims to (1) compare the shell shape morphometric variables of four species of neritid gastropods (Nerita fulgurans, Nerita peloronta, Nerita tessellata and Nerita versicolor) and (2) test the hypothesis that the ratios of the shell shape morphometric variables allow the taxonomic differentiation between the four species studied.
Methods
Study location and sampling
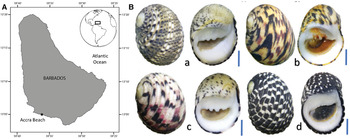
This study was carried out in Accra Beach, Barbados Island, Caribbean Sea, in the northern Atlantic Ocean (Figure 1A). In the sampling area, several rocks are present, providing cover and protection for gastropods (Chagas et al., Reference Chagas, da Silva, Freire, Barros, Santos, Santos and Herrmann2020). The specimens were collected in September 2015, during low tide in a delimited area of 100 m2 at an upper level. Specimens from the four neritids used in the present study are deposited in Coleção Malacológica do Museu de Zoologia da Universidade Federal Rural da Amazônia (MZUFRA), with the following vouchers: Nerita fulgurans (MZUFRA Moll 167), Nerita peloronta (MZUFRA Moll 168), Nerita tessellata (MZUFRA Moll 166) and Nerita versicolor (MZUFRA Moll 169) (Figure 1B).
(A) – Location map of sampling site in Accra Beach (★), Barbados Island, Caribbean Sea, northern Atlantic Ocean. (B) – Top and bottom view from neritids: Nerita fulgurans (a), Nerita peloronta (b), Nerita versicolor (c), Nerita tessellata (d). Vertical bars: 3 mm. Source: Altomari et al. (Reference Altomari, Alves, Santos, Santos, Barros, Bezerra, Herrmann and Chagas2021) adapted from Chagas et al. (Reference Chagas, da Silva, Freire, Barros, Santos, Santos and Herrmann2020).

Shell measurements
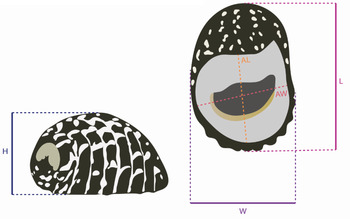
External measurements (L, length; H, height; W, width) and aperture (AL, shell aperture length; AW, shell aperture width) were taken in millimetres (Figure 2). A total of 67 N. fulgurans, 17 N. peloronta, 215 N. tessellatta and 21 N. versicolor were measured using a digital micrometer (TESA Data-Direct, 0.01 mm precision). The raw data from morphometrics are available in Data Publisher for Earth & Environmental Science – PANGAEA (Chagas et al., Reference Chagas, Assis, da Silva, Santos, Barros, Santos and Herrmann2019).
Schematic representation of Nerita tessellata Gmelin, 1791 with the measurements taken in the morphometrics. H, height; L, length; W, width; AL, shell aperture length; AW, shell aperture width.

Statistical analysis
All morphometrics measurements are grouped in defined classes of 1 mm, rearranged in class intervals using their length. The use of means for each class excluded possible bias due to differences in the sample size of each species. In other words, comparisons were made between the averages of class lengths. Additionally, proportionality morphometric ratios were determined: W/L, H/L, H/W, AL/W, AL/L, AL/H, AW/W, AW/L, AW/H. These efforts are essential for data standardization, allowing intraspecific and interspecific comparison.
In order to reduce the number of measurements, an autocorrelation analysis was conducted with morphometrics ratios. Variables with strong Spearman correlation coefficients (r > 0.7) were excluded, using corrplot package (Wei et al., Reference Wei, Simko, Levy, Xie, Jin, Zemla, Freidank, Cai and Protivinsky2021). In this study, any morphometric ratio with over 60% correlation with others was considered as autocorrelation. Subsequently, the collinearity of the morphometric ratios was verified with an analysis of covariance (ANCOVA).
To test the hypothesis that shell morphometrics allows taxonomic distinction among the neritids employed in the study, a principal component analysis (PCA) was applied using FactoRMine (Le et al., Reference Le, Josse and Husson2008) and vegan packages (Oksanen et al., Reference Oksanen, Blanchet, Kindt, Legendre, Minchin, O'Hara, Simpson, Solymos, Stevens and Wagner2020). Besides, the major morphometric ratios were recovered, using them to verify the distinctiveness of neritids. An ad hoc Shapiro–Wilk test was used to check the normal data distribution in morphometrics variables. A Levene test permits checking whether the variances are homogeneous with car package (Fox & Weisberg, Reference Fox and Weisberg2018). The ratios that satisfy the assumptions (P > 0.05) for both tests were submitted to a Kruskal–Wallis test, followed by a post hoc Dunn test when necessary, using dunn.test package (Dinno, Reference Dinno2017).
Figures were plotted with ggplot2 (Wickham, Reference Wickham2016) and ggfortify packages (Tang et al., Reference Tang, Horikoshi and Li2016). Schematic shell illustrations were made in Adobe Illustrator. All the statistical analyses are realized in R version 4.1.0 (R Core Team, 2021), considering a P > 0.05 significance level.
Results
The morphometric ratios, mean values, standard deviation, maximum and minimum measures are described in Table 1.
Morphometric ratios of neritids, with minimal values (Min), maximal (Max), mean (M), and standard deviation (SD)

H/W, shell height and width; AW/H, aperture width and height; AL/L, aperture length and shell length.
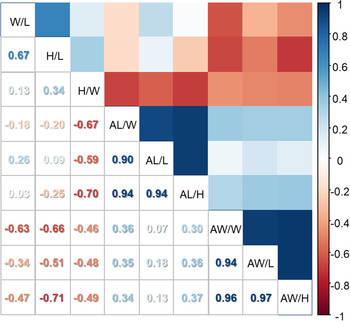
The outcome of the analysis highlights that six morphometric ratios positively correlated and one negatively correlated (Figure 3). However, no morphometric ratio was excluded by the autocorrelation analysis.
Strength of Spearman correlation coefficients in morphometric ratios of neritids. H, height; L, length; W, width; AL, shell aperture length; AW, shell aperture width.

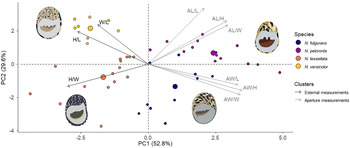
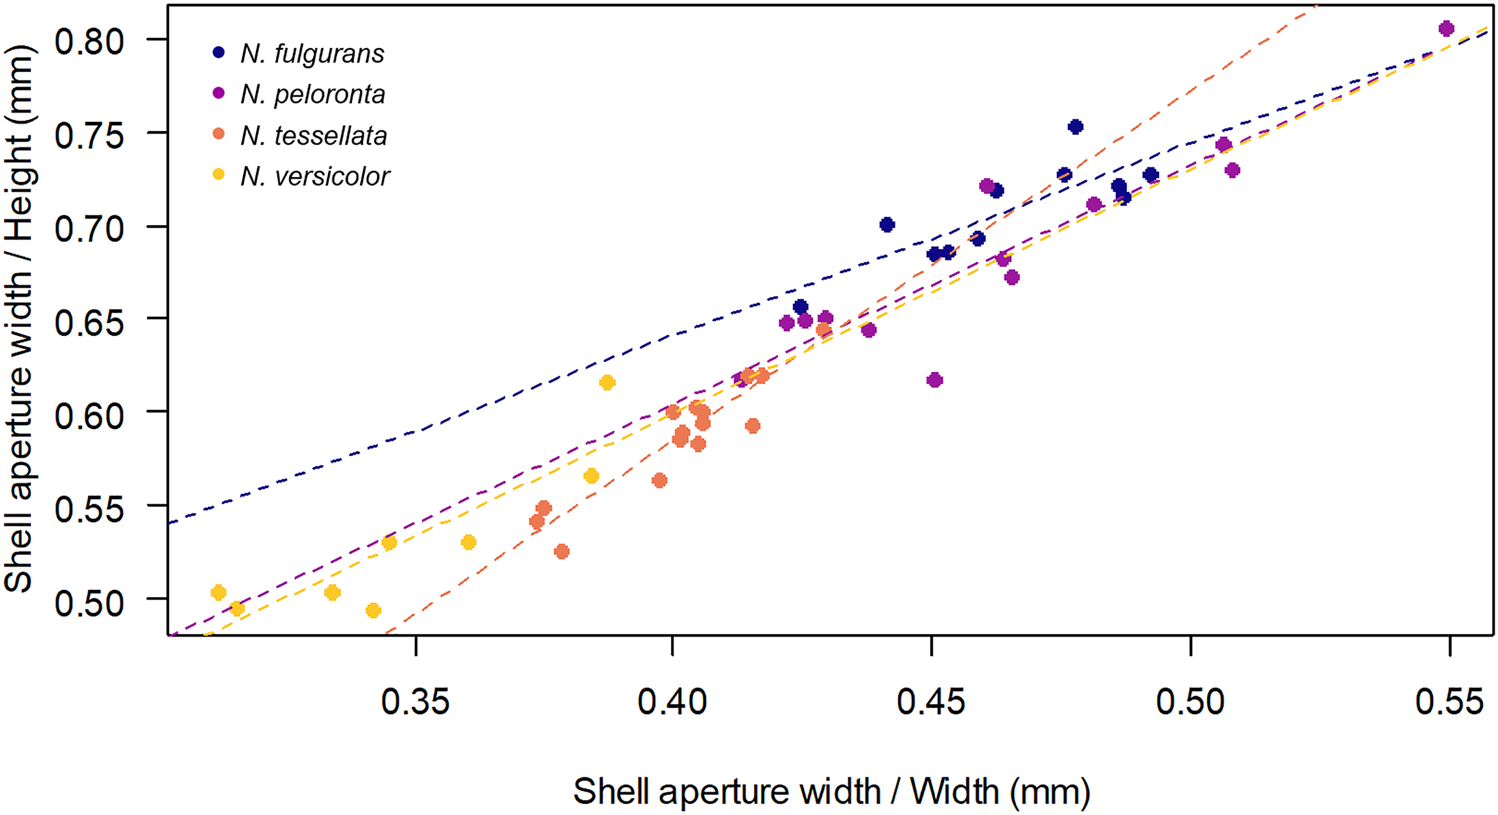
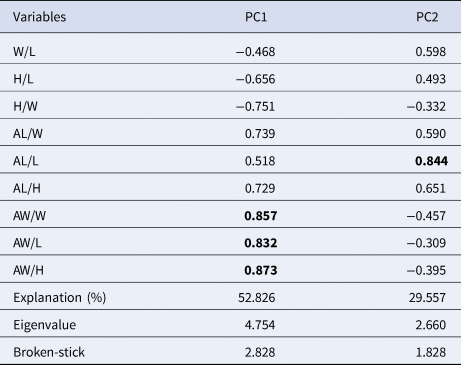
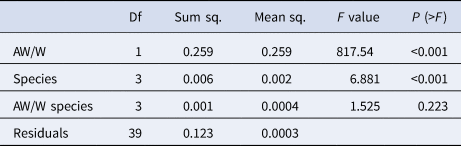
The PCA reduced by 82.383% the variation of the data, with the PC1 accounting for 52.826% and the PC2 29.557% (Table 2). These results sorted the data in three groups: one group assembling individuals of Nerita fulgurans and Nerita peloronta together, one group formed only by individuals of Nerita tessellata and another group formed only by individuals of Nerita versicolor. The readings of PC1 indicate that N. fulgurans and N. peloronta shared the same morphometric ratios (AL/H, AL/W, AW/W, AW/L and AW/H), as well as N. tessellata and N. versicolor (H/W). The PC2 indicates the ratio AL/L as a determinant in the organization of the data, being responsible for highlighting the distinction between the species N. tessellata and N. versicolor. Nevertheless, morphometric similarity between N. fulgurans and N. peloronta is still observed (Figure 4). The ANCOVA result shows us that the AW/H ratio is associated with the AW/W ratio. Furthermore, this relationship differs between species (Table 3, Figure 5).
Biplot showing ordination of neritids along the first two axes derived from PCA of morphometric variables. The total per cent by each axis is shown in parentheses; see Table 2 for loadings, eigenvalues, and Broken-stick.

Representation of the collinearity (ANCOVA) of the morphometric ratios between the four species of neritids.

Variables used to test morphometric differentiation among neritids and their PCA axis loadings

H, height; L, length; W, width; AL, shell aperture length; AW, shell aperture width.
Variables in bold are >0.8.
Values of collinearity analysis (ANCOVA) of morphometric ratios showing that the AW/H ratio is associated with the AW/W

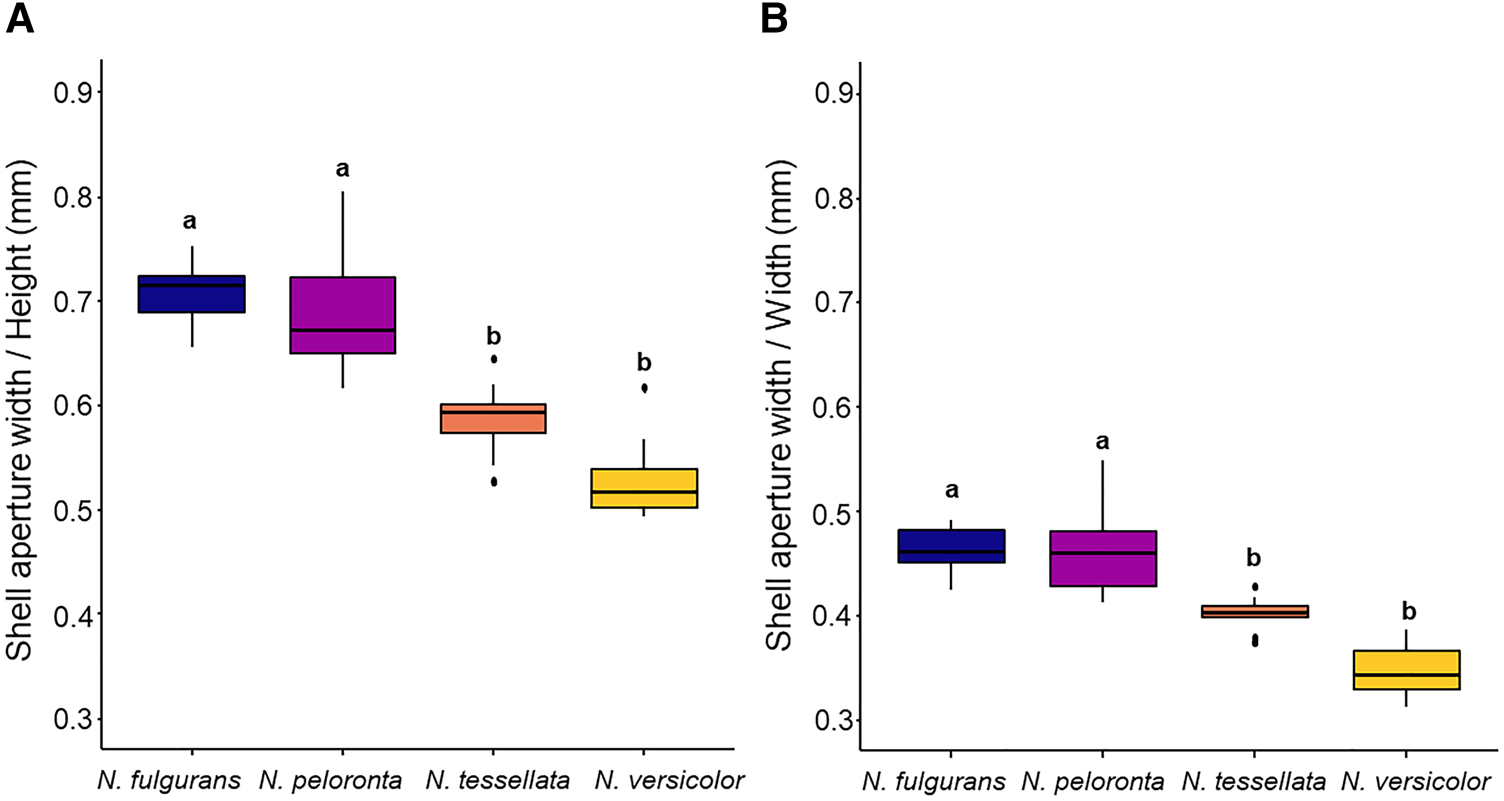
According to the PCA results, two analyses were carried out (Kruskal–Wallis) with the most significant variables in order to test the differences between the means of the morphometric ratios. Therefore, the first analysis, using the ratio AW/H (H = 35.521, P < 0.001) as a base, indicates morphometric similarity between N. fulgurans and N. peloronta, and differences between them and the species N. versicolor and N. tessellata. Additionally, it indicates differences between N. tessellata and N. peloronta. The third analysis, using the ratio AL/L (H = 36.103, P < 0.001) as a base, indicate morphometric similarity between N. fulgurans and N. tessellata, and differences between them and the species N. peloronta and N. versicolor (Figure 6).
Selected morphometric variables for distinctiveness inference in neritids. (A) shell aperture width/height. (B) Shell aperture width/width. Different letters in bars indicate a significant difference between means (P < 0.05).

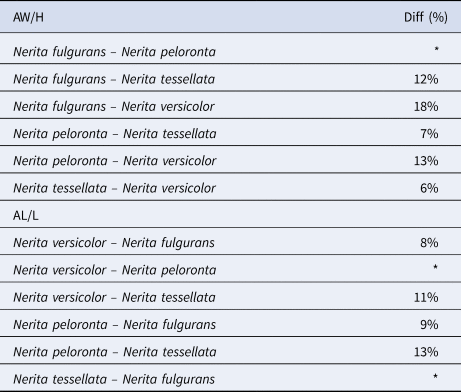
The morphometric ratios demonstrated the significant differences in percentage between the species (Table 4).
Per cent variation among neritids regarding significant morphometric ratios reported in PCA

*No significant differences were evidenced.
Discussion
The morphometric ratios AW/H and AL/L were decisive in distinguishing the four species of neritids studied. Morphometric measurements related to the width and length of the shell opening have already been added as determinants in the taxonomic differentiation of other species of gastropods (Cruz et al., Reference Cruz, Pante and Rohlf2012; Hamli et al., Reference Hamli, Hamed, Azmai and Idris2020).
The shell shape structural differences among the four neritids can be explained due to the speciation process experienced by Nerita Linnaeus, 1758 (Frey, Reference Frey2010). The geographic distribution is one of the main reasons for the speciation process in Nerita, since it was verified that distantly related species shared nearby or overlapping geographic areas (Frey, Reference Frey2010). The overlapping distribution of the four studied species is cited only by Hughes (Reference Hughes1971) which characterizes the geographic distribution in Barbados island for three neritid species. Nerita tessellata is in the infralittoral zone until near middle littoral zone. Nerita versicolor is located in the middle littoral zone until near supralittoral zone and Nerita peloronta is located in the supralittoral zone, where it is continuously drenched by waves, without being submerged (Hughes, Reference Hughes1971). Nerita fulgurans inhabits the rocky environment of the intertidal zone, within areas of reduced salinity (Cascon et al., Reference Cascon, Pinheiro and Matthews1990; Chagas et al., Reference Chagas, da Silva, Freire, Barros, Santos, Santos and Herrmann2020). Furthermore, regions such as the studied area (Caribbean Sea) tend to facilitate the habitat overlap (Barber & Bellwood, Reference Barber and Bellwood2005) which occurred with the studied neritids. Further research in other Caribbean islands on neritid distribution may make this association clearer.
Wave exposure has a particular influence in shell shape morphology and foot size in intertidal species. When exposed to wave action, gastropods produce adaptive responses that change the shell shape, decreasing its height and also reducing the spiral when compared with species protected from waves (Trussell, Reference Trussell1997; Forrester et al., Reference Forrester, Macfarlan, Holevoet and Merolla2016). Such adaptations culminate in a globose shell shape or more conspicuous format, such as limpets (Yamamori & Kato, Reference Yamamori and Kato2018). Another adaptive response to wave action is the growth of the foot surface and muscle strength to increase fixing to rocks resulting in a greater operculum and larger shell aperture (Trussell, Reference Trussell1997; Forrester et al., Reference Forrester, Macfarlan, Holevoet and Merolla2016; Clayman & Seebacher, Reference Clayman and Seebacher2019).
Thus, high ratios between AW/H and AL/W can be observed in gastropods that are continuously exposed to wave action. We understand, therefore, that species less exposed to waves tend to have smaller ratios of AW/H and AL/L, with shells having a greater height than in exposed species.
The ecological aspects may also have contributed to the differentiation process of the species, since the morphology of radula and feeding habits are similar in clades sharing the same environment (Frey, Reference Frey2010). More detailed studies in natural history may better elucidate the ecological differences between the species regards feeding.
Shell morphometrics approaches in gastropod molluscs are widely used because of their easy application and low cost (Chagas et al., Reference Chagas, Barros and Bezerra2018; Barros et al., Reference Barros, Dos Santos and Das Chagas2020; Matos et al., Reference Matos, Matthews-Cascon and Chaparro2020). However, according to Doyle et al. (Reference Doyle, Gammell and Nash2018) the analysis of morphometric data may be more effective for some species than for others. The authors demonstrate the use in some species of Caenogastropoda that have a smooth shell, and therefore fewer points of identification. In addition, other species of the genus may follow different patterns of allometry, and therefore should be investigated in further studies.
The shell shape morphometric ratios approach can be highlighted in taxonomic studies of fossil species, where the morphometrics characteristics can be used when other phenotypes are missing, such as shell colour, shell shape, characteristics of the apex, operculum, incomplete ornaments and loss due erosion processes (Reisser et al., Reference Reisser, Marshall and Gardner2012; Scarponi et al., Reference Scarponi, Della Bella, Dell'Angelo, Huntley and Sosso2015). Hamli et al. (Reference Hamli, Hamed, Azmai and Idris2020) mentions that the use of morphometric ratios to determine the species is fundamental for the elimination of age bias from the sample, and ontogenic characteristics.
Here, we analyse whether shell morphometric ratios are able to determine the four studied species. We confirm that among the species studied, the ratios AW/H and AL/L were able to differentiate them from each other. However, more studies are needed to verify if the morphometric ratios are sufficient to determine the taxonomy among other species.