




No CrossRef data available.
PERCEIVING VOWELS IN A SECOND LANGUAGE
Published online by Cambridge University Press: 05 February 2004
Abstract
This study examines the perception of English vowels by native speakers of Italian. In two preliminary experiments, Italian university students who had lived in Canada for 3 months were found to have difficulty discriminating  because they often identified both members of each contrast as instances of a single Italian vowel. The participants in two other experiments, long-time residents of Canada, were assigned to groups based on their age of arrival in Canada from Italy (early vs. late) and percentage of first language (L1) use (high L1 use vs. low L1 use). Experiment 3 focused on the discrimination of
 , and experiment 4 examined the discrimination of correct from incorrect realizations of
 . In both experiments, the early learners obtained higher discrimination scores than the late learners, and low-L1-use participants obtained higher scores than high-L1-use participants. Most important, the early learners who used Italian often (early high), but not the early learners who used Italian seldom (early low), were found to differ from native speakers of English in perceiving English vowels. These results suggest two important conclusions regarding second language (L2) perceptual learning: Learning an L2 in childhood does not guarantee a nativelike perception of L2 vowels, nor does the establishment of a sound system for the L1 preclude a functionally nativelike perception of L2 vowels. Another important finding is that, although the late learners generally perceived English vowels less accurately than the early learners, some perceived them accurately.This study was supported by grant DC00257 from the National Institute of Deafness and Other Communicative Disorders. The authors thank J. Prosperine and M. Pearse for help locating participants, Fr. M. Brodeur of St. Anthony's Church in Ottawa, Ontario, and all the participants. The authors are grateful to D. Meador and T. Piske for help preparing the stimuli used in experiment 4. Finally, thanks are extended to K. Aoyama, S. Imai, K. Tsukada, T. Piske, and three anonymous SSLA reviewers for comments on an earlier version of this article.
Information
- Type
- Research Article
- Information
- Copyright
- 2004 Cambridge University Press
It is important to understand how the vowels of a second language (L2) are perceived. Differences in segmental perception between native and nonnative speakers may slow the processing of an L2 (Munro & Derwing, 1995; Schmid & Yeni-Komshian, 1999) and may contribute to word-recognition difficulty (e.g., Bradlow & Pisoni, 1999; Mayo, Florentine, & Buus, 1997). It has also been hypothesized (e.g., Rochet, 1995) that native-nonnative differences in perception may limit the accuracy with which L2 phonetic segments can be produced. The aim of this study, therefore, is to provide a better understanding of L2 vowel perception. The study focuses on the question as to whether adults who begin learning their L2 in childhood can or cannot perceive L2 vowels in a nativelike fashion.
A number of studies have examined the production of L2 vowels by adults who were first exposed to their L2 either in childhood (early learners) or in late adolescence or early adulthood (late learners). These studies have shown that an influence of the first language (L1) vowel system is often readily apparent in late learners' production of L2 vowels, especially in early stages of learning (Jun & Cowie, 1994; Major, 1987; Munro, 1993). However, late learners typically produce L2 vowels more accurately as they gain experience in the L2, sometimes producing L2 vowels with formant frequency values that are intermediate to the values observed for monolingual speakers of the L1 and L2 (e.g., Flege & Hillenbrand, 1984). Experienced late learners have also been observed to produce certain L2 vowels accurately, especially when the L2 vowels are located in a portion of vowel space that is not occupied by an L1 vowel (Bohn & Flege, 1992; Flege, 1987, 1992b; Ingram & Park, 1997). Previous research has shown that early learners produce L2 vowels more accurately than most late learners (Baker, Trofimovich, Mack, & Flege, 2002; Flege, 1992a; Munro, Flege, & MacKay, 1996) although they may differ from the native speakers of the target language in producing certain vowels if they continue using their L1 frequently (Flege, Schirru, & MacKay, 2003; Piske, Flege, MacKay, & Meador, 2002).
A similar pattern of results has been obtained in research examining the perception of L2 vowels. Gottfried (1984) found that native speakers of English who had studied French in the United States correctly identified naturally produced French vowels less often than native French speakers (see also Ingram & Park, 1997). The participants in a study by Flege, Bohn, and Jang (1997) identified the members of a synthetic “beat-to-bit”

continuum that differed orthogonally in spectral quality and duration. Native English speakers based their judgments primarily on spectral quality, whereas many of the native Spanish late learners based their judgments exclusively on vowel duration. The results suggested that some native Spanish late learners failed to perceive the spectral difference between English /i/ and

even though previous research had shown that native Spanish adults can auditorily detect such differences (Flege, 1991; Flege, Munro, & Fox, 1994). However, 4 of the 20 late learners who were examined showed a nativelike use of spectral differences in classifying the English vowels (see also Morrison, 2002).
Baker et al. (2002) examined the discrimination of English vowels by groups of Koreans who were matched for years of residence in the United States (M = 9 years) but differed in age of arrival (AOA, M = 9 vs. 19 years) and percentage Korean use (M = 31% vs. 55%). The early learners discriminated English vowels better than the late learners but did not differ significantly from native English (NE) speakers. Similar results were obtained by Flege, MacKay, and Meador (1999), who examined the discrimination of English vowels by native speakers of Italian. The native Italian (NI) participants were selected based on their AOA in Canada from Italy and percentage Italian use. The participants in groups designated “early high” and “late high” used Italian relatively often but differed in AOA (M = 7 vs. 19 years), whereas participants in “early low” and “early high” groups were matched for AOA but differed in Italian use (M = 8% vs. 32%). Both groups of early learners (early low and early high) obtained higher discrimination scores than the late bilinguals but did not differ significantly from either the NE group or one another.
Other studies have provided evidence that early learners differ from native speakers of the target L2 (or L2 native speakers, for short), however. Mack (1989) reported that French-English bilinguals living in the United States identified significantly fewer members of a synthetic

continuum as /i/ than NE speakers. Four studies tested for differences between native Spanish learners of Catalan and native speakers of Catalan. The early learners in these studies were university students in Barcelona who had begun to learn Catalan by school age, were highly proficient in both Spanish and Catalan, and were said to use both languages frequently. Each study used a different technique to assess the perception of Catalan speech sounds. Pallier, Bosch, and Sebastián-Gallés (1997) examined the identification and discrimination of vowels in a synthetic continuum. Pallier, Colomé, and Sebastián-Gallés (2001) used the repetition priming paradigm. Sebastián-Gallés and Soto-Faraco (1999) used a version of the gating paradigm. Bosch, Costa, and Sebastián-Gallés (2000) employed the “perceptual magnet” paradigm. All four studies examined Catalan

, and all four revealed differences between early learners and native speakers in the perception of these vowels.
1Sebastián-Gallés and Soto-Faraco (1999) also examined Catalan

, and Pallier et al. (2001) also examined

.

identification function obtained by Pallier et al. (1997) for native speakers of Catalan but not for early learners revealed a clear crossover from

.
The results obtained for early learners in Barcelona suggested that an accurate perception of L2 vowels might be impossible following establishment of the L1 sound system. Sebastián-Gallés and Soto-Faraco (1999, p. 120) interpreted their findings to indicate a “lack of plasticity” in early learners and suggested that the malleability of the speech perception system might be limited “severely” by school age because exposure to the L1 exerts a “very strong constraint” on the “organization and acquisition of phonemic categories.” Pallier et al. (1997, p. B14) concluded that even early and frequent exposure to an L2 might be insufficient to permit the learning of “two new phonetic categories which overlap” a single L1 category. Bosch et al. (2000, pp. 215–216) inferred that the early learners continued to represent Catalan vowels as “foreign” speech sounds for which “stable representations in long-term memory” were not established.
CAN EARLY LEARNERS PERCEIVE L2 VOWELS ACCURATELY?
The basis for vowel perception differences between the early learners in Barcelona and L2 native speakers is uncertain. The differences were probably not due to the passing of a critical period, at least not one ending at the age of 12 years (Scovel, 1988, 2000) or 15 years (Patkowski, 1989). It seems unlikely that a critical period for L2 speech perception, should one exist, would occur prior to the completion of L1 speech perception development (see, e.g., Eisenberg, Shannon, Martinez, Wygonski, & Boothroyd, 2000; Johnson, 2000; Walley & Flege, 2000).
An explanation for the results obtained for early learners in Barcelona might be drawn from the native language magnet model, or NLM (e.g., Kuhl, 2000). The primary aim of the NLM is to account for the transition from auditory to language-specific perceptual processing. The NLM proposes that perception of the acoustic properties of speech sounds is defined by early experience. Infants perceptually sort segment-sized units into categories based on the recurrence of features they have detected in speech input. This results in a language-specific mapping between the categories developed for L1 speech sounds and phonetic input. In support of this, Kuhl, Williams, Lacerda, Stevens, and Lindblom (1992) observed differences in the perception of vowels by 6-month-old infants in the United States and Sweden.
Kuhl (2000, p. 11854) proposed that infants' perceptual mapping of ambient language speech sounds creates a “complex network, or filter, through which language is perceived.” Perceptual attunement to L1 categories may later shape the perception of L2 speech sounds. Interference effects might arise because of the difficulty inherent in functionally separating L1 and L2 mappings (i.e., categories) or because a neural commitment to L1 category mappings will later influence the processing of L2 speech sounds.
Support for this was provided by Iverson et al. (2003), who examined the perception of English

by NE adults and native Japanese adults in Tokyo. Participants rated the acoustic similarity of a grid of

stimuli differing in the frequency of F2 and F3 transitions into the vowel. Multidimensional scaling analyses suggested that the perception of acoustic-phonetic dimensions was shaped by attunement to the L1 phonetic system in a way that might be conceptualized as a “warping” of the phonetic space. Unlike NE participants, the native Japanese participants did not show a heightened discrimination of stimuli straddling the English

boundary, nor did they show evidence of a stretching or shrinking of the F3 dimension. The authors suggested that native speakers of Japanese develop perceptual maps that, although well suited for Japanese, may impede acquisition of the English

contrast. They also suggested that Japanese adults who do manage to establish new categories for English liquids might develop erroneous long-term memory representations in which variation in F3 frequency is given too little prominence.
Importantly, the NLM proposes that constraints on the perception of L2 speech sounds arise from prior experience, not a loss of neural plasticity. Iverson et al. (2003) suggested that L1 interference effects might be “self-reinforcing” for Japanese adults if, as the result of a warping of the phonetic space, they fail to experience the same auditory distribution of F3 differences in English

tokens as do children who are learning English as an L1. However, perceptual learning by adults remains possible, according to the NLM. Kuhl (2000, p. 11855) suggested that the influence of prior experience might be minimal for children who learn two languages simultaneously in early childhood if “two different mappings” are acquired for L1 and L2 speech sounds. Adult L2 learners might circumvent L1 interference effects if they can recapitulate infants' experience of L1 speech—that is, if they manage to receive “exaggerated acoustic cues, multiple instances by many talkers, and massed listening experience” (see also McCandliss, Fiez, Protopapas, Conway, & McClelland, 2002; McClelland, Thomas, McCandliss, & Fiez, 1999).
Although the findings for early learners in Barcelona are straightforward, there is reason for caution in accepting the conclusion that an accurate perception of L2 vowels is impossible following establishment of the L1 sound system. First, it is widely believed that children learn an L2 rapidly and well (see Snow, 1987, for review). Second, it has been established that early bilinguals generally succeed better in producing and perceiving an L2 than late bilinguals do (see Flege, 1999, for review). If early bilinguals' capacity for perceptual learning were severely limited, one would expect to observe little if any perceptual learning by late learners and, by extension, little improvement in production. However, the research previously reviewed indicated that adult L2 learners do make progress in learning to produce L2 vowels. Finally, conclusions drawn from the Barcelona research run counter to models of speech acquisition such as the NLM and the speech learning model, or SLM.
The SLM (Flege, 1988, 1992a, 1995, 1999, 2002, 2003a) proposes that even adults retain the capacities used by infants and children to acquire their L1, including the ability, in time, to perceive the properties of L2 speech sounds accurately and to establish new phonetic categories. However, the SLM hypothesizes that the likelihood of category formation for L2 speech sounds depends on perceived cross-language phonetic distance and the state of development of L1 phonetic categories. More specifically, it predicts that the likelihood of category formation for L2 speech sounds increases as a function of their perceived distance from the closest L1 speech sound. The SLM also predicts that, as L1 phonetic categories develop through childhood and into adolescence, they will become more powerful attractors of L2 speech sounds and thus become more likely to block the formation of new categories for L2 speech sounds. In support of this, Baker et al. (2002) obtained evidence that the perceptual assimilation of English vowels by Korean vowels was stronger for Korean adults than children.
One possibility evaluated in this study is that the observed difference between early learners and native speakers in Barcelona may not be generalizable to all vowels encountered in an L2. It is generally agreed that the perception of L2 vowels will depend, at least initially, on their perceived relationship to vowels in the L1 inventory (Best, 1995; Kuhl, 2000). For example, research has shown that L2 vowels tend to be discriminated well if they map onto (i.e., are perceptually assimilated by) two different L1 vowels. A pair of L2 vowels will be discriminated less accurately, however, if they are judged to be instances of a single L1 vowel (Best, Faber, & Levitt, 1996; Flege, Guion, Akahane-Yamada, & Downs-Pruitt, 1998).
Catalan

may pose an especially difficult perceptual learning task for native speakers of Spanish. These vowels occur in a portion of vowel space that is occupied by a single Spanish vowel, /e/. Bosch et al. (2000) described Spanish /e/ as having

allophones and as occurring near the perceptual boundary between Catalan

. The perceived relationship between Catalan

and Spanish /e/ was not assessed. However, if Spanish speakers judge Catalan

tokens to be equally good instances of Spanish /e/, then the perceptual assimilation model, or PAM (e.g., Best, 1995; Best, McRoberts, & Goodell, 2001) would predict poor discrimination of Catalan

by Spanish learners of Catalan, regardless of their age of first exposure to Catalan.
Another possibility is that the results obtained for early learners in Barcelona will not generalize to all early learners of an L2. Language-use patterns are known to influence performance in an L2 (e.g., Bahrick, Hall, Goggin, Bahrick, & Berger, 1994). Recent studies have shown that, compared to NI learners of English who continue to use their L1 often, those who seldom use it have a better overall pronunciation of English (Flege, Frieda, & Nozawa, 1997; Piske, MacKay, & Flege, 2001), identify English consonants better (MacKay, Meador, & Flege, 2001), and recognize more English words in noise (Meador, Flege, & MacKay, 2000). The early bilinguals in Barcelona were said to use their L1 frequently (Pallier et al., 1997, p. B11). It is therefore possible that early learners who used Spanish infrequently might not have differed from native speakers of Catalan.
THE PRESENT STUDY
This study examined the perception of English vowels by native speakers of Italian. Standard Italian has fewer contrastive vowels

than English (Agard & DiPietro, 1964). If Italian children who learn English cannot establish new categories for English vowels, one would expect them (and a fortiori Italian adults) to have difficulty discriminating certain pairs of English vowels. For example, if NI speakers identify English

tokens as instances of Italian /i/, they should discriminate these English vowels less accurately than NE speakers (Best, 1995; Best et al., 1996; Polka, 1995).
No previous study has examined the perceived relation between English and Italian vowels. The aim of the first two experiments, therefore, was to assess the perceptual assimilation of English vowels by Italian vowels and to determine which of nine English vowel contrasts would prove difficult for NI speakers to discriminate. The participants in experiments 1 and 2 were Italian university students who had resided in Canada for just 3 months. These experiments revealed that both members of the

contrasts tended to be identified as instances of a single Italian vowel. These contrasts may, therefore, have posed the same kind of learning problem for NI learners of English that Catalan

pose for native Spanish learners of Catalan.
Experiments 3 and 4 examined native speakers of Italian who were long-time residents of Canada. Half were early learners with an AOA ranging from 2 to 13 years, and half were late learners with an AOA ranging from 15 to 26 years. Experiment 3 focused on the categorial discrimination of

and experiment 4 examined the perception of

using an error detection task. As expected (Flege, 1992a; Flege et al., 1999; Yamada, 1995), the late learners discriminated English vowels less accurately than the early learners. The primary question, however, was whether the early learners would differ from NE speakers. The early and late learners were subdivided according to percentage Italian use (low L1 use, 1–15%; high L1 use, 25–100%). Flege et al. did not observe a difference in English vowel discrimination for early learners differing in percentage Italian use. However, the difference between the early-low and early-high groups approached significance (p = .08). Obtaining a significant L1 use effect was considered more likely in this study because the L1 use difference between the early-low and early-high groups was larger than in the previous study. If the early-high but not the early-low group were found to discriminate English vowels less accurately than the NE group, it would challenge the view that an accurate perception of L2 vowels is impossible following establishment of the L1 sound system. Another question addressed by experiment 3 was whether, as predicted by the SLM, some late learners would establish new categories for English vowels and discriminate English vowels as accurately as NE speakers.
EXPERIMENT 1
The purpose of this experiment was to examine the perception of English vowels by NI university students who had recently arrived in Canada. Vowel perception was evaluated using an oddity discrimination test that has been used in recent L2 research (Flege, 2003b; Flege et al., 1998, 1999; Guion, Flege, Akahane-Yamada, & Pruitt, 2000). The test was categorial in that each vowel category was represented by multiple natural tokens.
Method
Participants.
Two groups of university students participated in Ottawa, Ontario. One group (3 males, 9 females) consisted of native speakers of Canadian English enrolled at the University of Ottawa. The other group (3 males, 9 females) consisted of native speakers of Italian. The NI students, who had the same age (M = 22 years) and years of formal education (M = 15 years) as the NE students, had all been living in Canada for 3 months at the time of testing. They were enrolled in a special one-semester program at Carleton University as part of their training in translation at an Italian university. The Italian students reported having studied English in Italy for an average of 9 years (range = 3–15 years) beginning at an average age of 12 years (range = 7–18 years). They came from a variety of regions in Italy (3 from Puglia, 3 Molise, 2 Sicilia, 2 Abruzzo, 1 Umbria, 1 Piemonte, 1 Lombardia) and so were likely to have learned somewhat different L1 vowels as children (e.g., Canepari, 1986).
Stimuli.
The perceptual stimuli consisted of consonant-vowel-consonant (CVC) English words produced by adult native speakers of Canadian English (4 male, 1 female). The words were formed by inserting the vowels

into a /b_d/ context and the vowels

into a /k_d/ context. Vowels in the /b_d/ context (e.g., bead, bid) were used to test the

contrasts, and vowels in the /k_d/ context (e.g., cod, cud) were used to test the

contrast.
The words were digitized (22.05 kHz) and then normalized for peak intensity. The design required that there be within-category variation in the tokens representing each vowel category of interest. As expected, acoustic analyses revealed higher formant frequency values in vowels spoken by the female talker than by the four male talkers and also differences in the duration, midpoint formant frequency values, and amount of formant movement among the five tokens of each vowel. A preliminary auditory evaluation revealed that despite the existence of considerable within-category variation, NE-speaking listeners judged the vowels in each of the CVC stimuli to be good instances of their intended categories.
Procedure.
All participants were tested individually in a quiet room using a notebook computer. The Italian students were tested on the Carleton University campus, whereas the NE students were tested at the University of Ottawa. Instructions were administered in English to all participants in this and subsequent experiments.
The three CVC stimuli presented on each trial were always produced by three different talkers. A total of 20 trials tested each of the nine contrasts. Half the trials, called change trials (e.g.,

), contained an odd item out that occurred with near-equal frequency in all three possible serial positions. The remaining trials, called no-change trials (e.g.,

), contained three physically different instances of a single vowel category. The interstimulus interval between the three stimuli in all trials was 1.2 s.
The decision to include both change and no-change trials was motivated by the widely held view (e.g., Francis & Nusbaum, 2002; Guenther, Husain, Cohen, & Shinn-Cunningham, 1999; Kuhl, 1980) that the formation of a phonetic category will increase sensitivity to differences between members of the new category and other categories but lead to a decrease in sensitivity to differences among members of the new category. The change trials tested the participants' ability to distinguish vowels drawn from two different categories. The vowels in no-change trials differed audibly but not in a phonetically relevant manner. The no-change trials therefore tested the participants' ability to ignore audible but phonetically irrelevant within-category variation.
The stimuli were presented via headphones at a self-selected comfortable volume level.
2In some categorial discrimination tests (e.g., Best et al., 2001), the trials testing each contrast of interest are presented in separate, counterbalanced blocks. In this study, the trials testing all nine contrasts were presented in a single, randomized block to increase task difficulty and thus maximize the likelihood of observing significant between-group differences.

tokens) before the experiment began. Feedback was not provided during the experiment. However, five extra trials were presented for practice at the beginning of the experiment. The participants were told to focus their attention on the vowels in the three CVC words presented on each trial. They were instructed to click a button marked “1,” “2,” or “3” to indicate the serial position of the odd item out, if they heard one. They were told to click a fourth button marked “same” if they heard three different instances of one vowel. A trial could be replayed, but responses could not be changed once given.
An A′ score was calculated for each contrast to reduce the possible effect of response bias. The A′ scores were based on the proportion of hits and false alarms. Hits were defined as the correct selection of the odd item out in change trials (maximum = 10 per contrast). False alarms were defined as the incorrect selection of an odd item out in no-change trials (maximum = 10 per contrast).3
If the proportion of hits (H) equaled the proportion of false alarms (FA), then A′ was set to .500. If H exceeded FA, then A′ = .500 + ((H – FA) × (1 + H – FA))/((4 × H) × (1 – FA)). However, if FA exceeded H, then A′ = .500 – ((FA – H) × (1 + FA – H))/((4 × FA) × (1 – H)).
Results and Discussion
The NE students' scores were higher (M = .996, SD = .006) than the NI students' scores (M = .780, SD = .061). However, as shown in Figure 1, the size of differences between the two groups varied as a function of vowel contrast. The NE students obtained perfect scores for

and near-perfect scores for the remaining eight English vowel contrasts. Accordingly, the

scores were excluded from the group (NI vs. NE) by contrast (eight levels) ANOVA examining the discrimination scores. This analysis yielded significant main effects of group, F(1, 22) = 151.0, p < .01, and contrast, F(7, 154) = 10.3, p < .01, and a significant two-way interaction, F(7, 154) = 10.2, p < .01.

Mean discrimination (A′) of nine English vowel contrasts by the native English (NE) and native Italian (NI) students in experiment 1. The error bars bracket ±1.0 SE.
The two-way interaction was explored by a series of independent t-tests (each with df = 22) testing the simple effect of group for each contrast. These tests revealed that the Italian students obtained significantly lower scores than the NE students for each of the eight contrasts examined in the ANOVA (Bonferroni adjusted p < .01). A one-sample t-test was conducted to evaluate the NI students' discrimination of the ninth contrast examined,

. Their scores for

were significantly lower than the mean score of 1.000 obtained for the NE students, t = 2.54, p = .019.
The Italian students discriminated all nine English contrasts more poorly than the NE students. A series of one-sample t-tests was carried out to determine how many contrasts were discriminated at a significantly above-chance rate. The Italian students' scores were compared to .500, the value indicating a theoretical lack of sensitivity (Snodgrass et al., 1985). The students' scores significantly exceeded .500 (Bonferroni adjusted p < .05) for all contrasts except the two receiving the lowest discrimination scores (

, t = 1.84;

, t = 1.88). This suggested that the Italian students were at least partially aware of differences between certain pairs of English vowels. The relative difficulty of the nine English contrasts was explored further in a one-way ANOVA, which yielded a significant effect of contrast, F(8, 88) = 13.7, p < .01. Tukey's HSD procedure indicated that the Italian students obtained significantly lower scores for both

than for six other contrasts (

, for

than for three other contrasts

, and for

than

(p < .05).
In summary, Italian students who lived in Canada for 3 months discriminated nine pairs of English vowels less accurately than age-matched NE students. However, the English vowel contrasts varied considerably in difficulty. The Italian students discriminated seven of the nine contrasts that were examined at significantly above-chance rates. They obtained significantly lower scores for

than for one or more of the other contrasts examined. The aim of the next experiment was to help account for differences between the nine contrasts.
EXPERIMENT 2
The aim of this experiment was to assess the perceived relation between the English vowel stimuli used in experiment 1 and Italian vowels. Research within the framework of the PAM (Best, 1995) suggests that contrastive L2 vowels that are identified as instances of two different L1 vowel categories will be relatively easy for L2 learners to discriminate. Conversely, the PAM predicts less accurate discrimination of contrastive L2 vowels that are identified as instances of a single L1 vowel category.
Procedure
The Italian students (described previously) participated immediately after completing experiment 1. The CVC stimuli from experiment 1, along with booed (/u/) and bode (/o/) tokens spoken by the same five NE speakers, were presented randomly via headphones. Responses were written on a specially prepared answer sheet rather than recorded by the notebook computer used for testing. This is because two different types of judgments were needed for each vowel stimulus. Each stimulus was aurally presented twice in a row. When hearing a stimulus for the first time, the participants classified its vowel as Italian

.
4To prevent possible confusions arising from a lack of familiarity with phonetic symbols, alternate labels were also provided for the mid vowels (e chiusa and e aperta for

, o chiusa and o aperta for

). These terms are taught in Italian elementary schools.
No training was provided for either the classification or rating task. However, we were concerned that differences in the participants' L1 vowel systems might influence the results. For example, distinctions between

are taught in Italian elementary schools because they do not exist in certain varieties or dialects of Italian. As a precaution, the participants were given a written list of Italian keywords containing the seven vowels of standard Italian before the experiment began. They were asked to repeat the keywords aloud and pay special attention to the distinction between

and between

. One of the 12 Italian students reported that these distinctions do not exist in her native dialect of Italian.
Results and Discussion
Table 1 shows the percentage of times that the English vowel stimuli were identified as instances of each Italian vowel category. The percentages in italics indicate the modal classification of each English vowel. Both vowels in three contrasts received the same modal classification: English

as Italian

as Italian /a/; and /i/ and

as Italian /i/. However, different modal classifications were obtained for the English vowels comprising the remaining six English vowel contrasts. Table 1 also shows, in parentheses, the average ratings assigned to the stimuli that were classified in terms of each Italian vowel category. The most notable aspect of these data is that the English

stimuli received much lower goodness-of-fit ratings than the other English vowel stimuli, especially /i/ and /u/.
Classification of the English vowel stimuli as one of seven Italian vowels in experiment 1

A question of interest was whether the perceptual assimilation data could provide an explanation as to why certain English vowels were more difficult than others for the Italian students to discriminate in experiment 1. To address this question, classification overlap scores were computed for each contrast. The computation can be illustrated as follows. The Italian students classified the English

tokens as Italian /e/ in 47% and 10% of instances, respectively. This gave a 10% overlap in use of the Italian /e/ category. The

tokens were classified as Italian

in 53% and 75% of instances, giving a 53% overlap in use of the

category. The two partial overlap scores yielded a score of 63% for the

contrast.
There was a high degree of overlap for three of the four English vowel contrasts that were most difficult for the Italian students to discriminate in experiment 1 (viz.,

). A single Italian vowel was used in 63% of instances to classify both the English

tokens, in 74% of instances to classify both the English

tokens, and in 72% of instances to classify both the English

tokens. Conversely, there was little classification overlap for two of the three contrasts that were discriminated most accurately by the Italian students (viz.,

). Specifically, a single Italian vowel was used in only 15% of instances to classify both

, and the same Italian vowel was never used to classify both

.
These results are consistent with predictions generated by the PAM (Best, 1995). However, the results for two other contrasts diverged from the general pattern just described. The high classification overlap score computed for

(viz., 87%) led to the expectation of poor discrimination. However, the Italian students discriminated

much better than the three other contrasts receiving high classification overlap scores (viz.,

). An inspection of the classifications given by individual students provided some insight into this anomaly. When considered on an individual basis, the overlap of Italian vowel categories used to classify

averaged only 40%.
The results for

also diverged from the general pattern. The relatively low classification overlap score computed for

(viz., 35%) led to the expectation of relatively good discrimination. However,

received lower discrimination scores than all but two other contrasts (viz.,

). The difficulty of

might be explained in part by considering the acoustic specification of these vowels. Most vowels that are adjacent to one another in the English vowel space differ in terms of midpoint formant frequency values, duration, and formant movement patterns. However, English

differ relatively little in terms of their midpoint formant frequencies and duration and do not show a differing pattern of formant movement (Hillenbrand, Clark, & Nearey, 2001). This might explain why NE-speaking listeners sometimes misidentify English

tokens that have been produced by other NE speakers (see Flege, 1988, for review). The results obtained here for

suggest indirectly, therefore, that nonnative discrimination of L2 vowels may depend on more than just cross-language patterns of perceptual assimilation.
EXPERIMENT 3
This experiment examined discrimination of English vowels by long-time NI residents of Canada using the stimuli and procedures from experiment 1. Analyses focused on the

contrasts, which showed a single-category perceptual assimilation pattern in experiment 2. The PAM (Best, 1995) predicts that contrasts of this type will be difficult for L2 learners to discriminate.
Method
Participants.
Eighteen NE and 72 NI speakers participated. The NI participants were required to have been born in Italy and have immigrated to Canada between the ages of 2 and 13 years (early L2 learners) or 15 and 26 years (late L2 learners). They also had to report using Italian between 1% and 15% (low L1 use) or between 25% and 100% (high L1 use) of the time. Length of residence (LOR) in Canada was not used as a selection criterion. However, all but two of the 72 NI participants had lived in Canada for more than 10 years, and all but three had lived there for more than 20 years.
The NI participants were assigned to one of four groups of 18 each based on their AOA in Canada and self-reported percentage use of Italian. The early learners who reported using Italian relatively seldom and often were designated the early-low and early-high groups, respectively. The late learners who reported using Italian seldom and often were designated the late-low and late-high groups, respectively. Characteristics of the four groups are summarized in Table 2. The NI participants were born in one of 13 Italian regions (24 in Abruzzo, 12 Calabria, 8 Sicilia, 7 Veneto, 6 Campania, 4 Basilicata, 3 Lazio, 2 Friuli, 2 Puglia, 1 Lombardia, 1 Marche, 1 Piemonte, 1 Toscana). Place of birth did not vary systematically across the four groups. The age of the NE speakers was comparable (M = 50, SD = 5) to that of the four NI groups. None of the 90 participants reported a history of auditory disorder, and all passed a pure-tone hearing screening at octave frequencies between 500 and 4,000 Hz (re: 35 dB HL).
Characteristics (means, standard deviations, ranges) of the five groups of participants in experiment 3

The Language Background Questionnaire (LBQ) shown in Appendix A was administered to the NI participants before testing began. The experimenter read each question and recorded all answers to prevent variation in reading ability from influencing the results obtained. Analysis of the LBQ revealed that the early learners had received substantially more education in Canada than in Italy (M = 12.6 vs. 2.2 years), whereas the late learners had received substantially less education in Canada than in Italy (M = 1.7 vs. 9.0 years). Informal interactions with the participants revealed that they had received little, if any, exposure to English in Italy before arriving in Canada.
The NI participants were asked to estimate their percentage use of Italian in the 5 years, 5 months, and 5 weeks prior to testing. The three estimates were averaged in Table 2 because they were highly correlated (p < .001). Participants in the early-low and late-low groups reported using Italian 8% of the time on the average, whereas those in the early-high and late-high groups reported using Italian 48% of the time. The AOA of the early and late learners averaged 8 and 20 years, respectively. An ANOVA revealed that the low-L1-use and high-L1-use participants did not differ significantly according to AOA, F(1, 68) = 0.7, p > .10. Another ANOVA revealed that the late learners used Italian more than the early learners, F(1, 68) = 7.3, p < .01. However, AOA and L1 use did not interact significantly in an ANOVA examining percentage Italian use, F(1, 68) = 2.45, p > .10.
The NI participants' L1 use estimates appear to have been valid and reliable. They were asked to name the persons with whom they spoke Italian. The number of named interlocutors was examined in a two-way ANOVA. Participants assigned to the high-L1-use groups named significantly more persons than those assigned to the low-L1-use groups, F(1, 68) = 34.1, p < .01. However, the number of persons named by participants in the early and late groups did not differ significantly, F(1, 68) = 0.3, p > .10, nor did the AOA × L1 Use interaction reach significance, F(1, 68) = 0.27, p > .10.
In addition to providing global percentage Italian use estimates, the NI participants were also asked to indicate their percentage Italian use in a variety of contexts (at work, while shopping, on the telephone, at home, in social situations, with friends, and with family members). The average contextualized estimates given by the four NI groups are shown in Figure 2. These findings suggest that participants in the early-low and late-low groups used Italian almost exclusively with family members. An average of the contextualized estimates was computed for each NI participant. These average estimates were correlated with the global Italian use estimates reported in Table 2, r(70) = .91, p < .01.

Mean percentage use of Italian reported by the four groups of participants in experiment 3 at work (WO), while shopping (SH), on the telephone (TE), at home (HO), at social events (SO), with friends (FR), and with family members (FA).
Procedures.
All 90 participants were tested individually in a quiet room located at a predominantly Italian Roman Catholic parish in Ottawa, Ontario. The stimuli and procedures were the same as those used in experiment 1.
Results and Discussion
The discrimination scores for the five groups are shown in Figure 3. The NE and early-low groups obtained similar mean scores for the nine contrasts (M = .988 vs. .985), whereas participants in the other three groups obtained lower average scores (early high = .957, late low = .927, and late high = .869).

Mean discrimination of nine English vowel contrasts by native English (NE) speakers and four native Italian (NI) groups in experiment 3. Scores for the NI students in experiment 1 are included for comparison.
Figure 4 shows the scores for

in greater detail. A series of AOA × L1 use ANOVAs revealed that the early learners discriminated all three of these contrasts significantly better than the late learners:

, F(1, 68) = 19.2, p < .01;

, F(1, 68) = 29.1, p < .01;

, F(1, 68) = 6.0, p < .05. Also, the low-L1-use participants discriminated all three contrasts better than the high-L1-use participants:

, F(1, 68) = 5.8, p < .05;

, F(1, 68) = 13.1, p < .01;

, F(1, 68) = 5.1, p < .05. No significant AOA × L1 Use interactions were obtained:

, F(1, 68) = 1.8, p > .10;

, F(1, 68) = 0.1, p > .10;

, F(1, 68) = 0.3, p > .10.

Mean discrimination of (a) , (b) , and (c) by four native Italian (NI) groups in experiment 3. The error bars bracket ±1.0 SE. The reference lines show the mean scores obtained by the native English (NE) and NI students tested in experiment 1.
Differences between the NE group and the four NI groups were evaluated in a series of one-way ANOVAs. The effect of group was significant for all three contrasts:

, F(4, 85) = 10.2, p < .01;

, F(4, 85) = 17.5, p < .01;

, F(4, 85) = 5.5, p < .01. The four NI groups were compared to the NE group in a series of t-tests (df = 34) to evaluate native versus nonnative differences. Participants in the late-low, late-high, and early-high groups, but not those in the early-low group, obtained lower scores than the NE group for

(Bonferroni adjusted p < .05). Participants in the late-low and late-high groups obtained lower scores than the NE group for

(p < .05). The difference between the early-high and NE groups for

was marginally significant (p = .06), but the difference between the early-low and NE groups was nonsignificant (p > .10). Only the late-low and late-high groups differed significantly from the NE group for

(p < .05).
The scores obtained for each of the 72 NI participants for

were evaluated to determine if they fell within ±2.0 SDs of the NE groups' mean scores. The late learners met the 2-SD criterion in 32% of 216 (3 contrasts × 72) possible instances. The early learners met the 2-SD criterion in 81% of instances.
5The NE group's scores for

averaged .988 (SD = .032). A total of 33 participants met the 2-SD criterion for

(17 early low, 9 early high, 4 late low, and 3 late high). The NE speakers' scores for

averaged .990 (SD = .015), with 44 NI participants meeting the 2-SD criterion (18 early low, 15 early high, 8 late low, and 3 late high). Finally, the NE speakers'

scores averaged .990 (SD = .015), with 45 NI participants meeting the 2-SD criterion (17 early low, 12 early high, 10 late low, and 6 late high).

, χ2(1) = 10.9, p < .05;

, χ2(1) = 11.0, p < .05;

, χ2(1) = 3.8, p < .05. To obtain a high discrimination score, participants had to correctly choose the odd item out in change trials and also ignore phonetically irrelevant but auditorily accessible within-category differences (e.g., the gender of the talker) in no-change trials. These findings therefore support the SLM hypothesis that, although individuals of all ages retain the capacity for category formation, early L2 learners are more likely than late L2 learners to establish new categories for L2 speech sounds.
Multiple Regression Analyses.
Exploratory multiple regression analyses were run to examine the relation between the six participant variables shown in Table 2 and vowel discrimination. The analyses were necessarily exploratory because, as expected from previous research (e.g., Bahrick et al., 1994; Flege, 1998; Yeni-Komshian, Flege, & Liu, 2000), the participant variables were intercorrelated.
As summarized in Table 3, there was a strong correlation between the bilinguals' AOA in Canada and how many years of education they had received in English-medium schools in Canada. All participants who arrived in Canada as children were soon enrolled in school, whereas many later-arriving participants received no education in Canada.6
The 20 participants with an AOA less than 9 years attended Canadian schools for 14.4 years on average, whereas the 27 participants with an AOA greater than 17 years attended school for just 1.3 years on average.
Simple Pearson correlations between the participant variables in Table 2

Two forward, step-wise multiple regression analyses examined the relation between the six participant variables (in Table 2) and vowel discrimination. The criterion variables were the average discrimination scores obtained for all nine English vowels contrasts and the average score for just the three contrasts of special interest. As summarized in Table 4, years of education in Canada accounted for 37% of the variance in the overall discrimination scores at step 1, and percentage Italian use accounted for an additional 16% of the variance at step 2. Years of education accounted for 37% of the variance in the scores obtained for

, and percentage Italian use accounted for an additional 12% of the variance.
Multiple regression analyses examining the relation between participant variables (see Table 2) and the vowel discrimination scores obtained in experiment 3 for 72 Italian-English bilinguals

The failure of AOA to emerge as a significant predictor of vowel discrimination in either analysis might seem surprising, given the focus on the age of L2 learning in so much second language acquisition research. The results obtained by Flege, Yeni-Komshian, and Liu (1999) suggest the possibility that the lack of an AOA effect on L2 perception was due to the multicollinearity mentioned previously. These authors used a subgroup matching procedure to control for the effect of variation in years of education in L2-medium schools. One analysis compared two subgroups of 20 Korean immigrants each that were matched for AOA in the United States but differed in years of education in the United States. These subgroups were not found to differ significantly in overall degree of foreign accent. However, the subgroup consisting of participants with many years of education displayed significantly greater knowledge of grammatically regular aspects of English morphosyntax than the group consisting of participants with fewer years of education. The opposite pattern was obtained for subgroups of 20 each that consisted of Korean immigrants who were matched for years of education in English-medium schools but differed in AOA in the United States. That is, early-arriving participants were found to have a significantly better pronunciation of English than later-arriving participants when the years-of-education variable was controlled. However, the early-arriving and late-arriving Korean participants were not found to differ in terms of morphosyntax scores.
In the present study, a strong correlation existed between the NI participants' AOA in Canada and how long they had attended L2-medium schools in Canada (see Table 3). AOA was not identified as a predictor of English vowel discrimination in the regression analyses presented earlier because a marginally stronger correlation existed between the discrimination scores and years of education—overall average discrimination, r(70) = .611, p < .01; discrimination of

, r(70) = .612, p < .01—than between the discrimination scores and AOA—overall average discrimination, r(70) = –.572, p < .01; discrimination of

, r(70) = –.572, p < .01.
Two additional regression analyses were undertaken in which the years-of-education variable was excluded from the set of predictor variables. AOA emerged as the dominant predictor of the Italian-English bilinguals' discrimination of English vowels in these analyses. AOA accounted for 33% of variance in the average discrimination scores (p < .01), and percentage Italian use accounted for an additional 19% of the variance (p < .01). AOA accounted for 33% of the variance in the analysis of the average scores obtained for

(p < .01), and percentage Italian use accounted for 15% of the variance (p < .01). These results underscore the need for controlling factors that are confounded with AOA in research evaluating the effect of age on L2 performance.
Comparison to the Experiment 1 Results.
Previous research (Flege, Bohn, et al., 1997; Ingram & Park, 1997) has suggested that L2 vowel perception is likely to improve only modestly as the result of several additional years of residence in a predominantly L2 speaking environment. The question addressed here was whether larger amounts of additional L2 input would yield a more substantial improvement in L2 vowel perception.
The discrimination scores obtained for the NI students in experiment 1 have been juxtaposed in Figure 3 to the scores obtained in experiment 3. The Italian students might be considered late learners because their first extensive exposure to native English speakers occurred when they arrived in Canada at the age of 21 years. Accordingly, independent t-tests were carried out to determine if the two groups of late learners from experiment 3 obtained significantly higher scores for

than the Italian students. Participants in the late-low group obtained higher scores (Bonferroni adjusted p < .05) than the Italian students for all three contrasts:

, t(28) = 3.00;

, t(28) = 6.82;

, t(28) = 4.93. Participants in the late-high group obtained significantly higher scores for two contrasts:

, t(28) = 3.78, p < .05;

, t(28) = 3.65, p < .05;

, t(28) = 1.46, p > .10. As previously mentioned, the experienced late learners in experiment 3 obtained discrimination scores that fell within 2 SDs of the mean scores obtained for age-matched NE speakers in 32% of instances. However, none of the Italian students in experiment 1 obtained scores for

that fell within ±2.0 SDs of the mean scores obtained for age-matched NE students.
Participants in the late-low and late-high groups had lived in Canada longer (M = 30.2 years) than the Italian students (M = 0.3 years). These results therefore suggest that late learners' discrimination of L2 vowels improves as they receive additional native speaker input. Of course, LOR in a predominantly L2-speaking environment may not accurately predict amount of L2 native speaker input (see Flege & Liu, 2001). Moreover, the experienced late learners differed from the Italian students in more than just LOR. For example, the Italian students were younger than the experienced late learners and may have had greater aptitude for language learning inasmuch as they were studying to become professional translators. Both of these differences would have tended to favor the Italian students, which suggests that the difference between late learners with a short versus long LOR in Canada may have been underestimated. However, an anonymous reviewer speculated that the Italian students may have received more Italian-accented English input than the late learners had because much of their early English input was from NI teachers in Italy. Additional research will therefore be needed to quantify the effect of differing amounts of native speaker input on the perception of L2 vowels.
EXPERIMENT 4
In experiment 3, participants in the early-low group obtained lower discrimination scores than the NE group for

(p < .05) and

(p = .06). Neither group of early learners differed significantly from the NE group for

, however. The aim of experiment 4 was therefore to determine if either or both groups of early bilinguals would differ from the NE group in perceiving

if a more difficult perceptual test were employed.
The test used in this experiment required participants to detect mispronunciations of English

. Previous research has shown that listeners readily detect segmental errors in L1 words (e.g., Cole, 1981; Flege, 1984; Flege & Hammond, 1982). Other research has shown that some NI late learners produce English

as an [i]-quality vowel and English /i/ as an

-quality vowel (Flege et al., 1999; Piske et al., 2002). Such individuals may have developed a compromise L1-L2 vowel category that merged the phonetic properties of Italian /i/, English /i/, and English

(see e.g., Flege, 1999). If so, they would probably not be able to detect

substitutions in their own speech or that of others.
The perceptual stimuli used here were short English phrases containing the vowel /i/ (e.g., you meet some) or the vowel

(e.g., very difficult). The target vowels in some phrases were produced correctly, whereas the vowels in other phrases were produced incorrectly (

substitutions). The participants' task was to determine if the target vowel in each phrase had been produced correctly or incorrectly. We reasoned that a high rate of detections of both

substitutions would require distinct representations for

in long-term memory as well as correct lexicalization of the words containing the target vowels (see McAllister, Flege, & Piske, 2002).
Method
Participants.
Sixty-four participants from experiment 3 (14 NE, 15 early low, 13 early high, 9 late low, and 13 late high) returned 1 year later for this experiment. Along with 16 new participants drawn from the Italian-speaking community of Ottawa, they were assigned to five groups, each with 16 members.7
The data for one participant in the late-high group was lost due to a technical error.
Stimuli.
The perceptual stimuli used here consisted of phrases drawn from an unpublished study in which NI late learners responded extemporaneously in English to questions about immigration. The speech samples were digitized, and phrases containing various target vowels were edited out. The phrases were then presented to six NE adults with phonetic training. The listeners' classifications of the target vowels were used to select one to three phrases produced by 13 NE speakers and 24 NI late learners. The selected phrases contained the target vowels

. Some target vowels were identified as intended by the majority of listeners, whereas others were misidentified by most listeners in a particular way.
Three sets of phrases containing the target vowel /i/ were selected as stimuli. The native English-correct (NE-correct) set contained /i/ tokens produced by NE speakers that were transcribed as [i] by at least four of the six listeners. The native Italian-correct (NI-correct) set also contained /i/ tokens that were transcribed as [i] by the majority of listeners. However, the /i/ tokens in the native Italian-incorrect (NI-incorrect) set were transcribed as

rather than [i] by the majority of listeners. The same procedures were used in selecting three sets of phrases containing the target vowel

. (Productions of

in the NI-incorrect set were transcribed as [i] by the majority of listeners.) Also, three sets of phrases containing the target vowel

(incorrect productions of

transcribed as

) were selected as filler material.
Procedure.
The stimulus sets containing the target

and /i/ tokens were presented in counterbalanced order, with the

sets in between. The phrases were presented via loudspeakers at a comfortable level. As the phrases were presented auditorily, a written version of the phrases (see Appendix B) was presented on the screen of the notebook computer used for testing. The target vowel in each written phrase was replaced by an asterisk. This was done to ensure that the participants knew which vowel in each (auditory) phrase was to be judged. For example, the asterisk in very d*fficult indicated that the target vowel to be judged was

. (This assumes, of course, that participants knew that the word difficult contains

.) The participants were told to indicate if the target vowel in each phrase had been produced correctly or incorrectly. They did so by clicking one of two buttons shown on the computer screen. A stimulus phrase could be replayed, but a response could not be changed once given. The interval between each response and the next stimulus was 1 s.
Analysis.
Five practice stimuli were presented at the beginning of each block and were not analyzed. A′ scores were computed for responses to the

targets in the NI-correct and NI-incorrect sets. The A′ scores were based on the proportion of hits and false alarms (Snodgrass et al., 1985). Hits (maximum = 16) were defined as judgments of target vowels in the NI-correct sets as correct; false alarms (maximum = 16) were defined as judgments of target vowels in the NI-incorrect sets as correct. The rationale for not including responses to stimuli in the NE-correct set was that phrases in this set, unlike phrases in the NI-correct and NI-incorrect sets, were produced without foreign accent.
Results and Discussion
The mean A′ scores obtained for the five groups are shown in Figure 5. The scores obtained here were considerably lower than the scores obtained for

in experiment 3, probably because the target vowels under examination were not good instances of the

categories. However, the pattern of between-group differences obtained here was remarkably similar to the experiment 3 pattern. A two-way ANOVA examining the scores obtained for the NI participants yielded significant main effects of AOA, F(1, 59) = 9.3, p < .01, and L1 use, F(1, 59) = 9.5, p < .01, and a nonsignificant interaction, F(1, 59) = 0.4, p > .10. This replicated the results for

in experiment 3. Native-nonnative differences were evaluated by t-tests comparing the scores obtained for the NE group to the scores for the four NI groups. Significantly lower scores were obtained for the early-high, late-low, and late-high groups than for the NE group, t(30) = 2.8–3.9, Bonferroni adjusted, p < .05. However, the early-low and NE groups did not differ significantly, t(30) = .09, p > .10. This replicated the results obtained for the discrimination of

in experiment 3.

Mean error detection scores obtained for four native Italian (NI) groups in experiment 4. The reference line shows the mean score obtained for native English (NE) speakers. The error bars bracket ±1.0 SE.
GENERAL DISCUSSION
This study began with two preliminary experiments (experiments 1 and 2) examining the perception of English vowels by Italian university students who had resided in Canada for just 3 months. The results of these experiments suggested that the contrasts between English

are difficult for Italian speakers to discriminate because both members of each contrast tend to be identified as instances of a single Italian vowel. The two principal experiments of the study then examined the perception of

by NI speakers who had lived in Canada for an average of 36 years. These participants were assigned to one of four groups based on their AOA in Canada (early vs. late) and percentage Italian use (high L1 use vs. low L1 use). Experiment 3 focused on the categorial discrimination of

in CVC words. Experiment 4 tested participants' ability to differentiate correct from incorrect productions of

in short English phrases.
ANOVAs examining the scores from experiments 3 and 4 yielded significant main effects of AOA and L1 use and nonsignificant two-way interactions. Lower scores were obtained for the late L2 learners than for the early L2 learners. This result is consistent with previous research examining L2 segmental perception (e.g., MacKay et al., 2001; Yamada, 1995), including studies that focused on vowel perception (Baker et al., 2002; Flege et al., 1999). The lower scores obtained for high-L1-use than low-L1-use participants were expected from research examining overall degree of foreign accent (Piske et al., 2002), the identification of L2 consonants (MacKay et al.), and the recognition of L2 words in noise (Meador et al., 2000).
The primary purpose of this study, however, was to determine if the early learners differ from NE speakers in perceiving English vowels. Some previous research has revealed no difference between early learners and L2 native speakers (Baker et al., 2002; Flege et al., 1999). However, research with native Spanish learners of Catalan in Barcelona did reveal such differences (Bosch et al., 2000; Pallier et al., 1997, 2001; Sebastián-Gallés & Soto-Faraco, 1999), which suggests that an accurate perception of L2 vowels might be impossible following establishment of the L1 sound system. The hypothesis tested here—that high-L1-use but not low-L1-use early learners would differ from NE speakers—was largely confirmed. The early-low group did not differ from the NE speakers in discriminating

in experiment 3. However, the early-high group obtained scores that were significantly lower than the NE groups' scores for

, and their scores for

differed from the NE speakers' scores at the .06 level. In experiment 4, the early-high group but not the early-low group was found to differ significantly from the NE group in an error detection task focusing on the English

distinction.
Two conclusions can be drawn from the results obtained here for early learners. Consistent with the results obtained in Barcelona, beginning to learn an L2 in childhood does not guarantee a nativelike perception of L2 vowels. On the other hand, establishment of the L1 phonetic system does not guarantee that measurable vowel-perception differences will exist between early learners and L2 native speakers. The L1 phonetic systems of the early-high and early-low groups were probably similar when they began to learn English, for participants in these groups arrived in Canada at the same age. Therefore, if early learners are prevented from perceiving L2 vowels accurately as the result of interference from L1 vowels (e.g., Kuhl et al., 1992), one would have expected comparable results for the early-high and early-low groups.
The tests administered in experiments 3 and 4 were sufficiently sensitive to reveal differences between participants in the NE and early-high groups. Thus, the results for these experiments suggest that the representations developed for English vowels by participants in the early-low group were functionally equivalent. However, the lack of significant differences between the NE and early-low groups does not necessarily indicate that the long-term memory representations developed for English vowels by participants in these groups were identical. It is unlikely that NE and early-low group participants had received identical English input over the course of their lives. Moreover, the SLM predicts that when new phonetic categories are established for L2 vowels that are close in vowel space to preexisting L1 vowels, the L1 and L2 vowels will dissimilate (see Flege, 2002; Flege, Schirru, & MacKay, 2003). This might also lead to subtle perceptual differences between native speakers and early learners. It is also possible that residual differences in feature weighting might distinguish successful early learners from L2 native speakers (see, e.g., Crowther & Mann, 1994; Iverson et al., 2003).
Although the AOA and L1 use effects obtained here were straightforward, their interpretation is not. Age effects on L2 speech acquisition have been attributed, among other things, to age-related differences in neural plasticity (e.g., Scovel, 1988, 2000) and differences in the state of development of L1 phonetic categories (e.g., Flege, 1999). Such effects might also be attributed to factors that are typically confounded with age (e.g., Flege, Yeni-Komshian, et al., 1999). For example, there was a strong correlation between the NI participants' AOA and how many years of education they had received in English-speaking Canadian schools. Years of education, in turn, showed a slightly stronger correlation with vowel discrimination scores than AOA. Perhaps the early learners discriminated English vowels more accurately than the late learners because they had received more phonetic input from NE speakers during early stages of L2 learning (see Flege & Liu, 2001). Still another possibility is that the early and late learners differed in motivation to learn English because of perceived differences in the social or economic utility of English, or both (Grenier, 1984; Stevens, 1999).
Interpretation of the L1 use effect is also uncertain. The L1 use effect may have had a psycholinguistic origin. For example, the Italian system of the high-L1-use participants might have been activated more strongly than the low-L1-use participants' Italian system. If so, it might have exerted a comparatively stronger influence on their representations of English vowels, how they processed English vowels, or both. Alternatively, the L1 use effect may have been due to differences in phonetic input. For example, the high-L1-use participants might have been exposed to Italian-accented English more frequently than the low-L1-use participants. Another possible explanation is that more early-low than early-high participants were dominant in English, and L2 dominance contributes to an accurate perception of L2 vowels (see Flege, MacKay, & Piske, 2002).
Still another possible explanation of the observed difference between the early-low and early-high groups was offered by an anonymous reviewer: The L1 use effect was actually an effect of differences in L2 use. The NI participants were not asked to estimate their use of English (see Appendix A) because other research with participants drawn from the same community has shown that English and Italian use estimates are inversely correlated. For example, 196 native speakers of Italian living in the Ottawa region were recently asked to estimate their percentage use of English, Italian, and French. The estimates averaged 51.1% for English, 48.0% for Italian, and 0.9% for French. The correlation between the English and Italian estimates was r(194) = –.995. It is conceivable, therefore, that the low-L1-use participants in this study perceived English vowels more accurately than the high-L1-use participants because they used English more and had thus heard English vowels more frequently than the high-L1-use participants.
Finally, the results obtained here lend support to the SLM hypothesis (e.g., Flege, 1995) that the capacity to establish new vowel categories remains intact across the life span. As previously mentioned, Italian students who had lived in Canada for 3 months had difficulty discriminating English

. None of the Italian students obtained discrimination scores that fell within 2 SDs of the mean discrimination scores obtained for age-matched NE students. However, the late learners in experiment 3 obtained discrimination scores that fell within 2 SDs of the mean value for age-matched NE speakers in 32% of instances.
In conclusion, early learners who continued to use Italian L1 often, but not those who seldom used Italian, were found to differ significantly from native speakers of English in perceiving English vowels. This suggests that the establishment of the L1 vowel system does not by itself prevent an accurate perception of L2 vowels. The late learners who were examined in the present study generally perceived English vowels less accurately than the early learners. However, as predicted by the SLM, some late learners were found to perceive English vowels accurately.
APPENDIX A
LANGUAGE BACKGROUND QUESTIONNAIRE
The purpose of this questionnaire is to learn something about your language history. We would like to find out what languages you know, when you first learned them, and how much you use them.

APPENDIX B
Excerpts of extemporaneous speech by NE speakers and NI late learners of English

References
REFERENCES
Agard, F., &
DiPietro, R.
(1964).
The sounds of English and Italian.
Chicago:
University of Chicago Press.
Bahrick, H.,
Hall, L.,
Goggin, J.,
Bahrick, L., &
Berger, S.
(1994).
Fifty years of language maintenance in bilingual Hispanic
immigrants.
Journal of Experimental Psychology: General,
123,
264–283.Google Scholar
Baker, W.,
Trofimovich, P.,
Mack, M., &
Flege, J.
(2002).
The effect of perceived phonetic similarity on non-native sound learning
by children and adults. In
B. Skarabela,
S. Fish, &
A. Do (Eds.),
Proceedings of the 26th annual Boston University Conference on
Language Development (pp.
36–47).
Somerville, MA:
Cascadilla Press.
Best, C.
(1995).
A direct realistic perspective on cross-language speech
perception. In
W. Strange (Ed.),
Speech perception and linguistic experience: Issues in
cross-language research (pp.
171–206).
Timonium, MD:
York Press.
Best, C.,
Faber, A., &
Levitt, A.
(1996).
Perceptual assimilation of non-native vowel contrasts to the American
English vowel system.
Journal of the Acoustical Society of America,
99,
2602.Google Scholar
Best, C.,
McRoberts, G., &
Goodell, E.
(2001).
Discrimination of non-native consonant contrasts varying in perceptual
assimilation to the listener's native phonological system.
Journal of the Acoustical Society of America,
109,
775–794.Google Scholar
Bohn, O.-S., &
Flege, J.
(1992).
The production of new and similar vowels by adult German learners of
English.
Studies in Second Language Acquisition,
14,
131–158.Google Scholar
Bosch, L.,
Costa, A., &
Sebastián-Gallés, N.
(2000).
First and second language vowel perception in early bilinguals.
European Journal of Cognitive Psychology,
12,
189–221.Google Scholar
Bradlow, A., &
Pisoni, D.
(1999).
Recognition of spoken words by native and non-native listeners: Talker-,
listener-, and item-related factors.
Journal of the Acoustical Society of America,
106,
2074–2085.
Canepari, L.
(1986).
Italiano standard e pronunce regionali [Standard Italian and
regional pronunciations]
(3rd ed.).
Padua, Italy:
Cooperativa Libraria Editrice Università di Padova.
Cole, R.
(1981).
Perception of fluent speech by children and adults.
Annals of the New York Academy of Sciences,
379,
92–109.Google Scholar
Crowther, C., &
Mann, V.
(1994).
Use of vocalic cues to consonant voicing and native language background:
The influence of experimental design.
Perception & Psychophysics,
55,
513–525.Google Scholar
Eisenberg, L,
Shannon, R.,
Martinez, A.,
Wygonski, J., &
Boothroyd, A.
(2000).
Journal of the Acoustical Society of America,
107,
2704–2710.
Flege, J.
(1984).
The detection of French accent by American listeners.
Journal of the Acoustical Society of America,
76,
692–707.Google Scholar
Flege, J.
(1987).
The production of “new” and “similar” phones in a
foreign language: Evidence for the effect of equivalence classification.
Journal of Phonetics,
15,
47–65.Google Scholar
Flege, J.
(1988).
The production and perception of speech sounds in a foreign
languages. In
H. Winitz (Ed.),
Human communication and its disorders: A review (pp.
224–401).
Norwood, NJ:
Ablex.
Flege, J.
(1991).
Orthographic evidence for the perceptual identification of vowels in
Spanish and English.
Quarterly Journal of Experimental Psychology,
43,
701–731.Google Scholar
Flege, J.
(1992a).
Speech learning in a second language. In
C. Ferguson,
L. Menn, &
C. Stoel-Gammon (Eds.),
Phonological development: Models, research, and application (pp.
565–604).
Timonium, MD:
York Press.
Flege, J.
(1992b).
The Intelligibility of English vowels spoken by British and Dutch
talkers. In
R. Kent (Ed.),
Intelligibility in speech disorders: Theory, measurement, and
management (pp.
157–232).
Amsterdam:
Benjamins.
Flege, J.
(1995).
Second-language speech learning: Theory, findings, and problems.
In
W. Strange (Ed.),
Speech perception and linguistic experience: Issues in
cross-language research (pp.
229–273).
Timonium, MD:
York Press.
Flege, J.
(1998).
The role of subject and phonetic variables in L2 speech
acquisition. In
M. Gruber,
D. Higgins,
K. Olsen, &
T. Wysocki (Eds.),
Papers from the 34th annual meeting of the Chicago Linguistic
Society: Vol. 2. The panels (pp.
213–232).
Chicago:
Chicago Linguistic Society.
Flege, J.
(1999).
Age of learning and second-language speech. In
D. Birdsong (Ed.),
New perspectives on the critical period hypothesis for second
language acquisition (pp.
101–132).
Mahwah, NJ:
Erlbaum.
Flege, J.
(2002).
Interactions between the native and second-language phonetic
systems. In
P. Burmeister,
T. Piske, &
A. Rohde (Eds.),
An integrated view of language development: Papers in honor of
Henning Wode (pp.
217–244).
Trier, Germany:
Wissenschaftlicher Verlag Trier.
Flege, J.
(2003a).
Assessing constraints on second-language segmental production and
perception. In
A. Meyer &
N. Schiller (Eds.),
Phonetics and phonology in language comprehension and production:
Differences and similarities (pp.
319–355).
Berlin:
Mouton de Gruyter.
Flege, J.
(2003b).
Methods for assessing the perception of vowels in a second
language. In
E. Fava &
A. Mioni (Eds.),
Issues in clinical linguistics (pp.
19–44).
Padua, Italy:
UniPress.
Flege, J.,
Bohn, O.-S., &
Jang, S.
(1997).
The effect of experience on non-native subjects' production and
perception of English vowels.
Journal of Phonetics,
25,
437–470.Google Scholar
Flege, J.,
Frieda, A., &
Nozawa, T.
(1997).
Amount of native-language (L1) use affects the pronunciation of an
L2.
Journal of Phonetics,
25,
169–186.Google Scholar
Flege, J.,
Guion, S.,
Akahane-Yamada, R., &
Downs-Pruitt, J.
(1998).
Categorial discrimination of English and Japanese vowels and consonants
by native Japanese and English subjects. In
P. Kuhl &
L. Crum (Eds.),
Proceedings of the 16th International Congress on Acoustics and the
135th meeting of the Acoustical Society of America: Vol. 4. (pp.
2973–2974).
Woodbury, NY:
Acoustical Society of America.
Flege, J., &
Hammond, R.
(1982).
Mimicry of non-distinctive phonetic differences between language
varieties.
Studies in Second Language Acquisition,
5,
1–18.Google Scholar
Flege, J., &
Hillenbrand, J.
(1984).
Limits on phonetic accuracy in foreign language speech production.
Journal of the Acoustical Society of America,
76,
708–721.Google Scholar
Flege, J., &
Liu, S.
(2001).
The effect of experience on adults' acquisition of a second
language.
Studies in Second Language Acquisition,
23,
527–552.Google Scholar
Flege, J.,
MacKay, I., &
Meador, D.
(1999).
Native Italian speakers' production and perception of English
vowels.
Journal of the Acoustical Society of America,
106,
2973–2987.Google Scholar
Flege, J.,
MacKay, I., &
Piske, T.
(2002).
Assessing bilingual dominance.
Journal of Applied Psycholinguistic Research,
23,
567–598.Google Scholar
Flege, J.,
Munro, M., &
Fox, R.
(1994).
Auditory and categorical effects on cross-language vowel
perception.
Journal of the Acoustical Society of America,
95,
3623–3641.Google Scholar
Flege, J.,
Schirru, C., &
MacKay, I.
(2003).
Interaction between the native and second language phonetic
subsystems.
Speech Communication,
40,
467–491.Google Scholar
Flege, J.,
Yeni-Komshian, G., &
Liu, S.
(1999).
Age constraints on second language learning.
Journal of Memory and Language,
41,
78–104.Google Scholar
Francis, A., &
Nusbaum, H.
(2002).
Selective attention and the acquisition of new phonetic categories.
Journal of Experimental Psychology: Human Perception and
Performance,
28,
349–366.Google Scholar
Gottfried, T.
(1984).
Effects of consonant context on the perception of French vowels.
Journal of Phonetics,
12,
91–114.Google Scholar
Grenier, G.
(1984).
Shifts to English as usual language by Americans of Spanish mother
tongue.
Social Science Quarterly,
65,
537–550.Google Scholar
Guenther, F.,
Husain, F.,
Cohen, M., &
Shinn-Cunningham, B.
(1999).
Effects of categorization and discrimination training on auditory
perceptual space.
Journal of the Acoustical Society of America,
106,
2900–2912.Google Scholar
Guion, S.,
Flege, J.,
Akahane-Yamada, R., &
Pruitt, J.
(2000).
An investigation of current models of second language speech perception:
The case of Japanese adults' perception of English consonants.
Journal of the Acoustical Society of America,
107,
2711–2725.Google Scholar
Hillenbrand, J.,
Clark, M., &
Nearey, T.
(2001).
Effects of consonant environment on vowel formant patterns.
Journal of the Acoustical Society of America,
109,
748–763.Google Scholar
Ingram, J., &
Park, S.-G.
(1997).
Cross-language vowel perception and production by Japanese and Korean
learners of English.
Journal of Phonetics,
25,
343–370.Google Scholar
Iverson, P.,
Kuhl, P.,
Yamada, R.,
Diesch, E.,
Tohkura, Y.,
Ketterman, A., &
Siebert, C.
(2003).
A perceptual interference account of acquisition difficulties for non-
native phonemes.
Cognition,
87,
B47–B57.Google Scholar
Johnson, C.
(2000).
Children's phoneme identification in reverberation and noise.
Journal of Speech, Language, and Hearing Research,
43,
129–143.Google Scholar
Jun, S.-A., &
Cowie, I.
(1994)
Interference for “new” and “similar” vowels in
Korean speakers of English,
Ohio State University Working Papers,
43,
117–130.Google Scholar
Kuhl, P.
(1980).
Perceptual constancy for speech sound categories in early
infancy. In
G. Yeni-Komshian,
J. Kavanagh, &
C. Ferguson (Eds.),
Child phonology: Vol. 2. Perception (pp.
41–66).
San Diego, CA:
Academic Press.
Kuhl, P.
(2000).
A new view of language acquisition.
Proceedings of the National Academy of Science,
97,
11850–11857.Google Scholar
Kuhl, P.,
Williams, K.,
Lacerda, F.,
Stevens, K., &
Lindblom, B.
(1992).
Linguistic experience alters phonetic perception in infants six months
of age.
Science,
255,
606–608.Google Scholar
Mack, M.
(1989).
Consonant and vowel perception and production: Early English-French and
French-English bilinguals.
Perception & Psychophysics,
46,
187–200.Google Scholar
MacKay, I.,
Meador, D., &
Flege, J.
(2001).
The identification of English consonants by native speakers of
Italian.
Phonetica,
58,
103–125.Google Scholar
Major, R.
(1987).
Phonological similarity, markedness, and rate of L2 acquisition.
Studies in Second Language Acquisition,
9,
63–82.Google Scholar
Mayo, L.,
Florentine, M., &
Buus, S.
(1997).
Age of second-language acquisition and perception of speech in
noise.
Journal of Speech and Hearing Research,
40,
686–693.Google Scholar
McAllister, R.,
Flege, J., &
Piske, T.
(2002).
The influence of the L1 on the acquisition of Swedish vowel quantity by
native speakers of Spanish, English, and Estonian.
Journal of Phonetics,
30,
229–258.Google Scholar
McCandliss, B.,
Fiez, J.,
Protopapas, A.,
Conway, M., &
McClelland, J.
(2002).
Success and failure in teaching the [r]-[l] contrast
to Japanese adults: Predictions of a Hebbian model of plasticity and
stabilization in spoken language perception.
Cognitive, Affective, and Behavioral Neuroscience,
2,
89–108.Google Scholar
McClelland, J.,
Thomas, A.,
McCandliss, B., &
Fiez, J.
(1999).
Understanding failures of learning: Hebbian learning, competition for
representational space, and some preliminary experimental data. In
J. Reggia,
E. Ruppin, &
D. Glanzman (Eds.),
Progress in brain research: Vol. 121. Disorders of brain, behavior,
and cognition—the neurocomputational perspective (pp.
75–80).
Amsterdam:
Elsevier.
Meador, D.,
Flege, J., &
MacKay, I.
(2000).
Factors affecting the recognition of words in a second language.
Bilingualism: Language and Cognition,
3,
55–67.Google Scholar
Morrison, G.
(2002).
Effects of L1 duration experience on Japanese and Spanish
listeners' perception of English high front vowels.
Unpublished Master's thesis,
Simon Fraser University,
Vancouver, Canada.
Munro, M.
(1993).
Productions of English vowels by native speakers of Arabic: Acoustic
measurements and accentedness ratings.
Language and Speech,
36,
39–66.Google Scholar
Munro, M., &
Derwing, T.
(1995).
Processing time, accent, and comprehensibility in the perception of
native and foreign-accented speech.
Language and Speech,
38,
289–306.Google Scholar
Munro, M.,
Flege, J., &
MacKay, I.
(1996).
The effect of age of second-language learning on the production of
English vowels.
Applied Psycholinguistics,
17,
313–334.Google Scholar
Pallier, C.,
Bosch, L., &
Sebastián-Gallés, N.
(1997).
A limit on behavioral plasticity in speech perception.
Cognition,
64,
B9–B17.Google Scholar
Pallier, C.,
Colomé, A., &
Sebastián-Gallés, N.
(2001).
The influence of native-language phonology on lexical access:
Exemplar-based versus abstract lexical entries.
Psychological Science,
12,
445–449.Google Scholar
Patkowski, M.
(1989).
Age and accent in a second language: A reply to James Emil Flege.
Applied Linguistics,
11,
73–89.Google Scholar
Piske, T.,
Flege, J.,
MacKay, I., &
Meador, D.
(2002).
The production of English vowels by fluent early and late
bilinguals.
Phonetica,
59,
49–71.Google Scholar
Piske, T.,
MacKay, I., &
Flege, J.
(2001).
Factors affecting degree of foreign accent in an L2: A review.
Journal of Phonetics,
29,
191–215.Google Scholar
Polka, L.
(1995).
Linguistic influences in adult perception of non-native vowel
contrasts.
Journal of the Acoustical Society of America,
97,
1286–1296.Google Scholar
Rochet, B.
(1995).
Perception and production of second-language speech sounds by
adults. In
W. Strange (Ed.),
Speech perception and linguistic experience: Issues in
cross-language speech research (pp.
379–410).
Timonium, MD:
York Press.
Schmid, P., &
Yeni-Komshian, G.
(1999).
The effects of speaker accent and target predictability on perception of
mispronunciation.
Journal of Speech, Language, and Hearing Research, 42,
56–64.Google Scholar
Scovel, T.
(1988).
A time to speak: A psycholinguistic inquiry into the critical
period for human speech.
Rowley, MA:
Newbury House.
Scovel, T.
(2000).
A critical review of critical period research.
Annual Review of Applied Linguistics,
20,
213–223.Google Scholar
Sebastián-Gallés, N., &
Soto-Faraco, S.
(1999).
On-line processing of native and non-native phonemic contrasts in
early bilinguals.
Cognition,
72,
111–123.Google Scholar
Snodgrass, J.,
Levy-Berger, G., &
Haydon, M.
(1985).
Human experimental psychology.
Oxford:
Oxford University Press.
Snow, C.
(1987).
Relevance of the notion of a critical period to language
acquisition. In
M. Bornstein (Ed.),
Sensitive periods in development: Interdisciplinary perspectives (pp.
183–209).
Mahwah, NJ:
Erlbaum.
Stevens, G.
(1999).
Age at immigration and second language proficiency among
foreign-born adults.
Language in Society,
28,
555–578.Google Scholar
Walley, A., &
Flege, J.
(2000).
Effects of lexical status on children's and adults'
perception of native and non-native vowels.
Journal of Phonetics,
27,
307–332.Google Scholar
Yamada, R.
(1995).
Age and acquisition of second language speech sounds: Perception
of American English /[inverted r]/ and /l/
by native speakers of Japanese. In
W. Strange (Ed.),
Speech perception and linguistic experience: Issues in
cross-language research (pp.
305–320).
Timonium, MD:
York Press.
Yeni-Komshian, G. H.,
Flege, J., &
Liu, S.
(2000).
Pronunciation proficiency in the first and second languages of
Korean-English bilinguals.
Bilingualism: Language and Cognition,
3,
131–150.Google Scholar
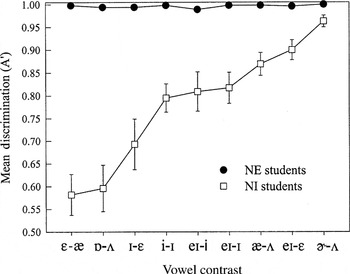
Mean discrimination (A′) of nine English vowel contrasts by the native English (NE) and native Italian (NI) students in experiment 1. The error bars bracket ±1.0 SE.
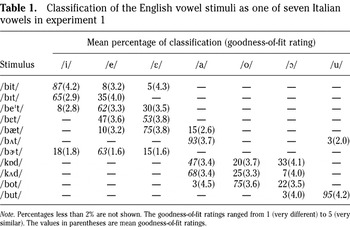
Classification of the English vowel stimuli as one of seven Italian vowels in experiment 1
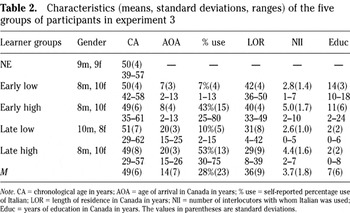
Characteristics (means, standard deviations, ranges) of the five groups of participants in experiment 3
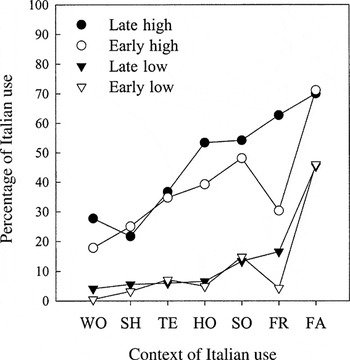
Mean percentage use of Italian reported by the four groups of participants in experiment 3 at work (WO), while shopping (SH), on the telephone (TE), at home (HO), at social events (SO), with friends (FR), and with family members (FA).
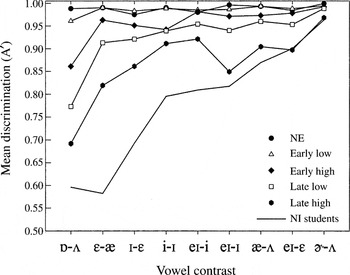
Mean discrimination of nine English vowel contrasts by native English (NE) speakers and four native Italian (NI) groups in experiment 3. Scores for the NI students in experiment 1 are included for comparison.
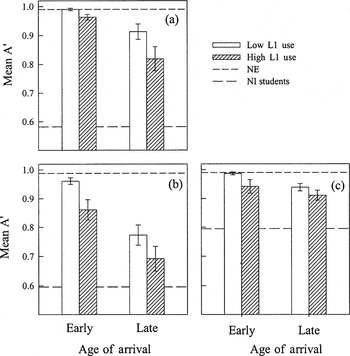
Mean discrimination of (a) , (b) , and (c) by four native Italian (NI) groups in experiment 3. The error bars bracket ±1.0 SE. The reference lines show the mean scores obtained by the native English (NE) and NI students tested in experiment 1.
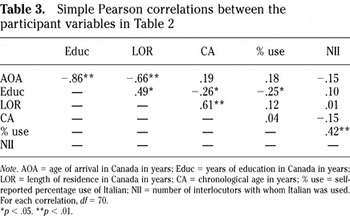
Simple Pearson correlations between the participant variables in Table 2
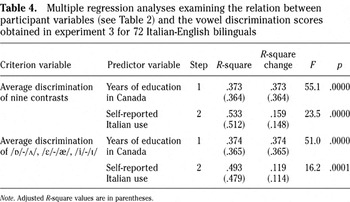
Multiple regression analyses examining the relation between participant variables (see Table 2) and the vowel discrimination scores obtained in experiment 3 for 72 Italian-English bilinguals
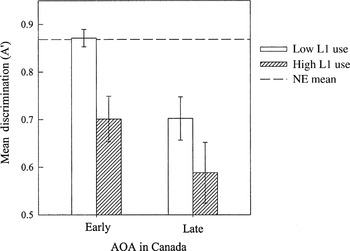
Mean error detection scores obtained for four native Italian (NI) groups in experiment 4. The reference line shows the mean score obtained for native English (NE) speakers. The error bars bracket ±1.0 SE.

Excerpts of extemporaneous speech by NE speakers and NI late learners of English
 You have
Access
- 16
- Cited by