1 Introduction
At a time when the earth is experiencing effects of ecological damage and climatic change, natural disasters are a phenomenon of high relevance and impact on society as a whole. Beside an investigation and reduction of the root causes, an improvement and extension of possibilities to respond in case of an emergency as to prevent or mitigate its destructive effects receives much attention from of a wide variety of applications and interdisciplinary research in context of disaster management. Currently, a special focus is on the potential of social media technology to play a remarkable and transformational role in the way society responds to a disaster by enabling inclusion of activities and information from members of the public (e.g. Palen et al. Reference Palen, Anderson, Mark, Martin, Sicker, Palmer and Grunwald2010; Starbird and Palen Reference Starbird and Palen2011).
This vivid vision of a participatory disaster management relies on integration of multiple fields of computer science, an understanding of online communicative behaviour, as well as on awareness of the domain of application. Critical topics for research and development include acquaintance with the quantity and quality of information occurring on social media during a disaster as well as understanding of its permanent change and life cycle, an approach to mapping new informal sources of information on existing formal schemata as to allow for their alignment with formal sources and their inclusion into standardized management processes and workflows, new application and special adaptation of information extraction methods.
In this paper, we investigate the thematic and temporal structure of social media communication in context of a natural disaster. Taking the Central European Flooding in 2013 as our case, we automatically analyse German social media messages from Facebook and Twitter by combining cross-sectional with longitudinal and singular with comparative perspectives. The insights gained should deepen the understanding of social media communicative behaviour in crisis situations and, in particular, help to fill the research gap with respect to German studies in this field. We ensure applicability of the extracted information and categories by mapping them on standard categories and schemata that form the conceptual basis of professional disaster management and, furthermore, discuss the concrete potential of social media for improvement of crisis response in Germany. As the core method for our study, we apply state-of-the-art technology from natural language processing (NLP) and unsupervised machine learning, namely topic model analysis (e.g. Blei, Ng and Jordan Reference Blei, Ng and Jordan2003; Griffiths and Steyvers Reference Griffiths and Steyvers2002) in combination with temporal clustering, and develop optimization strategies to meet the special requirements of the data type. By this methodological decision, we consciously question the commonly held prejudice against unsupervised methods for social media analysis in crisis informatics (compare Imran et al. Reference Imran, Castillo, Diaz and Vieweg2015) and finally come to disprove it.
In result of our analysis, we reveal a quite well-defined thematic structure of social media communication regarding the flood event and high potential of social media for improvement of disaster management. In the temporal dimension, we extract three characteristic phases of social media communication that quite well reflect the changing concerns of the people in course of the flood event. On basis of a match between our results on categories and schemata from disaster management as well as positive feedback from end-users, we claim good applicability of unsupervised topic modelling techniques for social media content analysis in crisis management. Our topic modelling approach has become part of a social media analysis software prototype that is currently under consideration by German authorities for future use in disaster management in Germany.
The paper starts with a background section (Section 2) that gives a description of our case, introduces the research areas of crisis informatics and social media analysis and defines basic concepts of disaster management which function as the reference point for our study. The next section (Section 3) sets the focus of our research by mentioning our research concerns, explaining our general methodological approach and discussing related work. Thereafter, we describe the data basis of our study and give a more detailed description of all methods used (Section 4). In the next two sections, the results from the analysis of thematic and temporal structures are offered (Sections 5 and 6). They are discussed then from a methodological perspective as well as from the point of view of application and brought into relation to the conceptual basis in the application domain (Section 7). In the conclusion (Section 8), the results are used to show the potential of social media for German disaster management and to reflect on the methodological consequences of our study. With respect to the benefit of our work as well as present limitations, we finally hint towards some of our future plans and research ideas (Section 9).
2 Background
2.1 Digital volunteering during the flood 2013
When in June 2013, after a period of heavy rain, the Rivers Elbe and Danube burst their banks and floodwaters were threatening the cities and communities in the east and south German states and Austria, a huge wave of readiness to help throughout the country was also on its way. During these days, not only the water levels and amount of rain set new records at many places, but the engagement of volunteers likewise was on an unprecedented scale. Notably, those volunteers organized themselves mainly via social media.
This process had been initiated independently by private people or small NGOs, without any involvement of state agencies and professional disaster management. The new social media platforms just had created an opportunity to channel social energy and put into real action a valuable potential that might have been lost otherwise. And the viral effects of the open network made the movement rapidly spread and grow. For instance, the public Facebook site ‘Fluthilfe Dresden’ founded by a young man, Daniel Neumann, got about 12,500 followers after half a day and reached 2.4 million people in one week. Before he knew how, the young man and two of his friends found themselves in a position to receive and answer about 60–80 messages per minute and to coordinate as much as 50,000 people (EIJK 2015).
Against this background, it is true that the resulting involvement provided invaluable help, at the same time, though, not all actions were carried out smoothly and flawlessly (DKKV 2015). When evaluating the event from the point of view now, volunteers and emergency managers both agree that state agencies should regain information sovereignty and decision-making authority and that they have to assume ultimate responsibility in case of a disaster (EIJK 2015). And this is only to be achieved by working hand in hand with volunteer’s organizations and by becoming more present for gathering and giving information and for interactive communication on social media (Kirchbachkommission 2013).
2.2 Social media analysis for crisis informatics
The flood in 2013 in Central Europe is just one example where the relevance of new information technology for disaster management has been revealed. Several other events, such as Hurricane Katrina, 9/11 or the Haiti earthquake have demonstrated before that there is urgent need to understand how individuals, non-government and government agencies share, disseminate, access, collect, organize and process information during a crisis. The emerging field of crisis informatics (e.g. Hagar Reference Hagar2006; Palen et al. Reference Palen, Vieweg, Liu and Hughes2007; Palen et al. Reference Palen, Anderson, Mark, Martin, Sicker, Palmer and Grunwald2010) is based on the insight that nowadays the ability to efficiently access and distil huge amounts of complex data is crucial to situational awareness, knowledge building and decision-making of those responsible for saving lives and property of people affect by a crisis. Within an interdisciplinary setting, crisis informatics aims at a socially and behaviourally informed development of information and communication technology for crisis situations.
Within crisis informatics, social media offer a new opportunity for improvement of disaster response by providing active communication channels that allow for more efficient propagation of information and enable participation of the public (e.g. Starbird and Palen Reference Starbird and Palen2011). Due to their bi-directional information flow, social media support efficient information exchange and interaction between formal response agencies and the people affected. The social aspects are inherent in the platform environment in form of interactivity, network building and multiplication of effects. But so far we know quite little about the rules that govern social media communication and the spectrum of possible contents seems virtually unlimited. Any attempt at systematic investigation or usage is easily getting lost trying to find a path through the overwhelming amount of data that are available on social media and that is getting updated every second. In context of crisis informatics, there currently are made strong efforts towards a more systematic investigation of the properties and use of social media (e.g. Olteanu, Vieweg and Castillo Reference Olteanu, Vieweg and Castillo2015; Eismann, Posegga and Fischbach Reference Evans2016).
Computer-based tools can help to face the problem of information overload by reducing the amount of information to be examined by human end-users. Computational methods from the area of NLP offer a wide range of possibilities for systematically and efficiently searching, filtering, sorting and analysing huge amounts of data. However, social media data are a relatively new topic of NLP research, and, up to now, they confront the researchers with many questions and challenges (e.g. Foster et al. Reference Foster, Cetinoglu, Wagner, Le Roux, Nivre, Hogan and van Genabith2011; Baldwin Reference Baldwin2012; Stieglitz et al. Reference Stieglitz, Dang-Xuan, Bruns and Neuberger2014). As already stated, social media data are Big Data not only with respect to their volume but also in terms of dynamicity and variety. By being the outcome of technology-mediated social interactions, social media add the dimension of highly semantic data to common big data dimensions (Olshannikova et al. Reference Olshannikova, Olsson, Huhtamäki and Kärkkäinen2017). At the same time, not only their content and communicative functions but also their formal properties considerably differ from standard NLP data types, like News. Social media come with rich contextual information associated, for instance, in form of metadata, links and interactive features of the respective platform environment. At the same time, the linguistic context inside a message can be extremely poor as texts are usually very short or even fragmentary. Additional challenges to automatic processing are placed by orthographical errors, slang or elements of non-verbal communication like emoticons. For all these reasons, standard NLP methods often do not perform well when applied to social media data but have to be reassessed, reconsidered and adapted as to meet the special requirements of the data type. No reliable unique methodological framework for social media processing is available so far (e.g. Stieglitz et al. Reference Stieglitz, Dang-Xuan, Bruns and Neuberger2014) and, accordingly, different strategies to overcome the various problems are followed by different researchers. Here too, current research in crisis informatics is making efforts to treat social media data in a more systematic and methodically sound way (e.g. Imran et al. Reference Imran, Castillo, Diaz and Vieweg2015; Castillo Reference Castillo2016).
In the context of crisis informatics, there arise additional requirements for a successful implementation of NLP techniques for social media analysis (e.g. Imran et al. Reference Imran, Castillo, Diaz and Vieweg2015). First, the software should be especially efficient, reliable and user-friendly and should possibly be integrated into existing standard software and workflows in disaster management. Second, the methods should be specially chosen and adapted to meet the needs of the end-user-group. Hereby, it has to be taken into account that different end-users may have different interests depending on the circumstances of the disaster and on the role they have to play in managing it (e.g. Vieweg Reference Vieweg2012). Moreover, the methods should be able to account for the fact that, similar to the disaster event itself, the information needs of the end-users are time-dynamic and go through a certain life cycle (e.g. Vieweg et al. Reference Vieweg, Hughes, Starbird and Palen2010), and that, besides knowing about the current state, trend detection and prediction making are a focus of interest for professional decision makers. Third, in order to promote usability, the results of an NLP analysis should be directly interpretable within the general conceptual framework established within the user domain, for instance, by including the same categories or relating to the same schemata (e.g. Imran et al. Reference Imran, Castillo, Diaz and Vieweg2015).
2.3 Basic concepts in disaster management
This last, conceptual level certainly is the most fundamental one, because it predetermines the structuring of knowledge and actions within the domain. Relevant aspects of the event are captured by it and available perspectives and roles derive from it. In this subsection, we will shortly introduce three conceptual schemata that are at the very basis of most of the categorizations in disaster management and that, therefore, will serve as the reference point for the conceptualizations within our NLP approach.
From the point of view of disaster management, a crisis is considered to have three basic dimensions: (1) the real event; (2) the actions of the involved organizations; (3) the perception of the crisis (BMI 2008). Communication plays a very important and very characteristic role in each case. In the first dimension, there is need for quick and precise information on the event; the second dimension comes with requirement for efficient and clear action-related communication between partners in different institutions, locations, cultures; in the third dimension, processes like trust building, opinion formation and emotion management open up social, political and psychological aspects of communication (ibid.).
As a second basic conceptual schema, on top of this general dimensional structure of an event, crisis management assumes a disaster life cycle in the sense of a generic temporal structuring into several characteristic stages. There are different models in use in different organizations and countries (Baird Reference Baird2010) but the most basic one divides a disaster event up into three different stages: (A) preparedness; (B) response; (C) recovery. (Often a fourth phase – mitigation – is assumed to fill the time when no event is actually taking place.) Each stage is characterized by certain situational pattern, tasks and risks (ibid.).
In the same context, the concept of different alarm levels is a third basic schema we want to include here. On the basis of objective measures like, for instance, water levels, it defines temporal transition points between phases of a certain type of event that trigger specific compulsory actions for the emergency forces to take (Grün Reference Grün, Grün and Schenker-Wicki2014). For water level alarms, for instance, the four alarm levels in Germany include (LUBW and LfU 2015) (1) reporting; (2) control; (3) watch; (4) response. Trying to loosely relate alarm levels for flood in Germany to the aforementioned general concept of disaster life cycle, one would certainly set the point in time where alarm level 1 is reached as the start of the preparedness phase, map the highest alarm level 4 to the response stage, and leave some time after for short-term recovery, maybe taking normal water height as a possible end point. One should keep in mind, though, that event phases, in difference to alarm levels, are not absolutely temporally fixed but constitute a very flexible schema. Stages can repeat or overlap and depend on the entire circumstances of the concrete event (e.g. Baird Reference Baird2010).
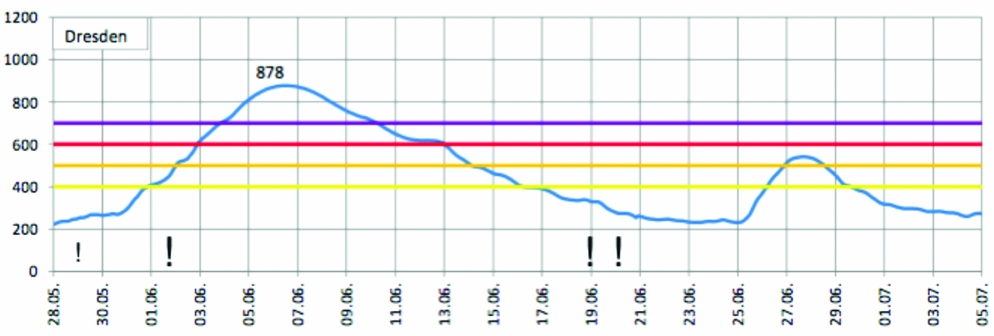
As one example that will have to play a role in what follows here, Figure 1 shows the hydrological development and alarm level profile for the flood 2013 by the example of the river Elbe in the city Dresden (LfULG 2014). The x-axis shows dates, the y-axis shows water levels in cm and the horizontal lines mark alarm levels in increasing order from bottom to top. Equally important in connection with flood events are weather alarms. The most critical weather phases during the flood 2013 were, first, the start of alarm phase for heavy rain 29th May with highest alarm level at several locations around 2nd June and second, around 19th or 20th June highest alarm level at many locations referring to thunderstorm, storm, hailstorm and heavy rain (ibid.). These approximate weather alarm dates have been added to Figure 1 in form of exclamation marks.
Water levels (in cm) and alarm levels over time (LfULG 2014), weather warnings (!) added.

While the disaster life cycle as described above as our second schema is focusing on the objective level of the event and the actions to be taken by disaster management, there is another, supplementary version of this schema also relevant in the context of this paper. In its second version, the disaster life cycle is taking the perspective of the affected people as well as helpers and describes their typical emotional reactions as following predictable patterns (e.g. Mahon Reference McMahon2011). In the threat phase, while expecting the impact of the disaster, people are under big uncertainty and their emotional state commonly is very vague. The impact of the event often even causes a shock at first and may briefly paralyse people, but soon after there usually starts the heroic phase characterized by high activity and altruism. After the event passed and short-term recovery started, people typically live a high emotional honeymoon phase and there appears strong empathy and community coherence. As before, there can be interruptions and fall-backs, depending on recurring threat level or new impacts. (Later on, there are long-term emotional effects that play a very important part in disaster psychology. But as we focus on the period of the actual event in our study, those long-term effects will not further be discussed here.)
3 Focus of our research
3.1 Research concerns
In the context of crisis informatics, the paper intends to make a twofold contribution – one on the level of application and one on the methodological level.
First, from the point of view of disaster management, we will investigate the content and concrete potential of German social media by conducting a statistical analysis of social media data created during the flood 2013 in Germany and Austria. We will examine data from the two big social media platforms Facebook and Twitter and reveal their thematic structure and content. On this basis, we will furthermore draw a comparison of the thematic profile in each case. In addition to considering the flood event as a whole, we will analyse its temporal structure and development over time. Taking this dynamic perspective, we want to find out which kind of content is available and prevalent at which point in time and seek to learn about the evolution of trends. Building on the outcome of this dynamic content analysis, we will try to identify characteristic phases of social media communication during the event. Again, the results of the dynamic and time phase analysis of Facebook and Twitter content will be used as a basis of comparison between the two platforms with respect to their potential for disaster management.
Second, from the point of view of crisis informatics, we will have to find methods especially suitable for dealing with the high volume, dynamicity and variety of social media data and allow for a very efficient extraction and condensed presentation of information relevant for disaster management. As an overarching aim and general principle in line with our discussion in 2.2, our application of NLP techniques, in order to grant strong applicability within the user domain, will have to go hand in hand with an adaptation and integration on the level of function and conceptualization. This means, first, that we have to find methods that allow for different perspectives on the data and different levels of detail depending on different interests of end-users. Second, on the conceptual level, we will aim to meet the ambitious demand to relate the results of our NLP analysis to basic concepts of disaster management, in particular to the different dimension of a crisis, alarm levels and to the disaster management life cycle in its two versions as introduced in Section 2.3. Our main methodological interest is to prove the applicability of unsupervised techniques within crisis informatics. Bringing into play the research perspective of NLP for social media analysis, our investigation faces an additional challenge. With focus on the core method chosen in this study, we need to be prepared to handle peculiarities of social media data and to find ways to successfully apply, modify or extend the standard approach.
3.2 Methodological approach
In our study of social media content, we will conduct two consecutive rows of statistical experiments focusing on an investigation of thematic and temporal structure of flood-related social media data, respectively. At this point, we want to give a short outline on our general methodological approach; a more detailed description of the particular methods is to follow in Section 4.
The core method for our analysis will be topic modelling (e.g. Blei et al. Reference Blei, Ng and Jordan2003; Griffiths and Steyvers Reference Griffiths and Steyvers2002). In face of the problem of information flooding, topic modelling offers a state-of-the-art technique which is able to reveal the thematic structure in huge collections of documents. In a first row of experiments in Section 5, we will conduct an latent Dirichlet allocation (LDA) topic model analysis on our German Facebook and Twitter corpora related to the flood in 2013. The application of special optimization techniques will play an important part here. As an additional analysis step, we will apply a simple approach of sentiment analysis on LDA results to support manual interpretation of topics.
Regarding the assumption that thematic structures considerably change over time in relation to communicational conditions and happenings on the event level, we furthermore will look at our corpora from a dynamic point of view. In Section 6, the results of topic model analysis will be further used for an investigation into the development of topics over time. On basis of topic distributions per day, we will apply and optimize temporal clustering techniques in order to automatically set temporal boundaries between different thematic phases of communication on the flood event.
Two supplementary sets of experiments in Sections 5 and 6 will conduct a differential analysis in context of two different comparative studies. Following our topic model analysis in Section 5, we will test a hypothesis regarding the differences in content between our flood-related corpora from different social media platforms. As a supplement to Section 6, we will use the data sets that correspond to the different stages identified before in order to analyse and compare the content available in the different temporal phases of the event. The course of the frequencies of characteristic phase terms extracted will be investigated and brought into relation to phase boundaries.
An overview of the different parts of our analysis and their respective placement within the paper is given in Figure 2.
Overview of analysis steps and related sections.

As an important methodical feature of our approach, both of our main methods – topic model analysis and temporal clustering – belong to the family of unsupervised machine learning techniques that seek to identify hidden structure in unlabelled data. Unsupervised techniques have advantages over supervised ones in cases where the structural classes are previously unknown and need to be discovered or where preparing labelled training examples would be too costly and time-consuming. On the other hand, the issue of relating the output of an automatic analysis to conceptual and methodological pre-conditions on the application side becomes especially urgent in case of an unsupervised setting (compare, e.g. Imran et al. Reference Imran, Castillo, Diaz and Vieweg2015: 24).
3.3 Related work
Social media analysis and social media crisis informatics both are very active emerging fields of research, including various possible perspectives and methodical approaches due to their interdisciplinary character and the relatively unexplored nature of the subject matter. An overview over the research domain and its intersection with crisis informatics has been given, e.g. in Stieglitz et al. (Reference Stieglitz, Dang-Xuan, Bruns and Neuberger2014), Imran et al. (Reference Imran, Castillo, Diaz and Vieweg2015) and Castillo (Reference Castillo2016).
While much of the published social media research is confined to questions of network and community structure, less work has presented a systematic analysis of the textual content, and applications of unsupervised methods are especially rare. Although topic modelling algorithms have evolved greatly over the past years, the prevailing opinion is that they do not work well with social media content but mainly produce bad results and incoherent topical clusters (e.g. Zhao et al. Reference Zhao, Jing, Weng, He, Lim, Yan and Li2011). The sparseness of context within messages is seen as especially critical. The focus of most research, therefore, is on various attempts to improve on the results, for instance, by introducing additional pre-processing methods or special pooling strategies (e.g. Mehrotra et al. Reference Mehrotra, Sanner, Buntine and Xie2013). In the context of crisis informatics, up to now, the dominant view is that structured information extraction for social media needs supervised methods with manually prepared categories (e.g. Palen et al. Reference Palen, Anderson, Mark, Martin, Sicker, Palmer and Grunwald2010; Starbird and Palen Reference Starbird, Palen, Hughes and Vieweg2010; Starbird and Palen Reference Starbird and Palen2012; Vieweg et al. Reference Vieweg, Hughes, Starbird and Palen2010; Imran et al. Reference Chowdhury, Imran, Amer-Yahia, Castillo and Asghar2013; Reuter, Heger and Pipek Reference Reuter, Heger and Pipek2013; Reuter and Schröter Reference Reuter, Ludwig, Kaufhold and Pipek2015; Ramage, Dumais and Liebling Reference Ramage, Dumais and Liebling2010 for hybrid approach with partial labelling).
Similarly, research into the development of social media content over time and its temporal structuring in relation to a disaster event either prefers to stick directly to observable features (e.g. keyword counts) or manual annotated labels (e.g. Parsons Reference Parsons, Atkinson, Simperl, Weal, Gangemi, Leonardi and Panconesi2015) or likewise falls back on supervised methods (e.g. Yang et al. Reference Yang, Chung, Lin, Lee, Chen, Wood, Kavanaugh, Sheetz, Shoemaker and Fox2013; Chowdhury et al. Reference Chowdhury, Imran, Amer-Yahia, Castillo and Asghar2013; Iyengar, Finin and Joshi Reference Iyengar, Finin and Joshi2011).
In the general research context of topic modelling, dynamic topic models have been proposed as a way to extend traditional state space models to identify a statistical model of topic evolution (Blei and Lafferty Reference Blei and Lafferty2006b). A more recent version of dynamic topic models (Wang, Blei and Heckerman Reference Wang, Blei and Heckerman2008) replaces the original discrete space with a continuous space referring to the Brownian motion law. On this basis, topics are divided into sequential groups and topics in each slice are assumed to evolve from the ones in the previous slice. Although this type of approach generally seems very interesting in the context of our research, some first experiments we did with dynamic topic models did not produce very promising results. We suspect that the short time-span, uneven temporal distribution and fine granularity of our social media data basis for temporal analysis causes data sparseness within time segments.
There are a few unsupervised approaches to temporal segmentation which integrate with results from topic modelling, most closely related Theme Delta (Gad et al. Reference Gad, Javed, Ghani, Elmqvist, Ewing, Hampton and Ramakrishnan2015). In contrast to our approach, though, Theme Delta builds up the topical basis by calculating a separate model for each time segment. Moreover, it has been designed for and applied to more standard data (like News or transcripts of political speeches) rather than social media. According to our estimates, the properties of our data basis for temporal analysis, just as described in the previous paragraph, is a strong argument against this kind of application of topic modelling on each time segment separately because of data sparseness within segments.
Finally, research on social media up to now appears to be very much dominated by English language studies and something similar holds true for investigations into social media use during crisis events where a majority of case studies is concerned with crisis events in the USA (e.g. Hughes and Palen Reference Hughes and Palen2009; Vieweg et al. Reference Vieweg, Hughes, Starbird and Palen2010; Starbird and Palen Reference Starbird, Palen, Hughes and Vieweg2010). There are some international studies available; though smaller in number and systematic coverage (e.g. Qu et al. Reference Qu, Huang, Zhang and Zhang2011; Starbird and Palen Reference Starbird and Palen2011; Starbird and Palen Reference Starbird and Palen2012). Especially, systematic research into properties and content of German social media crisis communication has just begun (Fuchs et al. Reference Fuchs, Andrienko, Andrienko, Bothe and Stange2013; Reuter et al. Reference Reuter, Ludwig, Kaufhold and Pipek2015; Backfried, Schmidt and Quirchmayr Reference Backfried, Schmidt and Quirchmayr2015), and the role of social media for German disaster management still needs to be explored (Reuter and Schröter Reference Reuter and Schröter2015). Moreover, most of the published social media research is focusing on Twitter with only very few available examples of more extended or systematic comparative approaches (Backfried et al. (Reference Backfried, Schmidt and Quirchmayr2015), Kaufhold and Reuter (Reference Kaufhold and Reuter2016); and our own previous work in Gründer-Fahrer and Schlaf (Reference Gründer-Fahrer and Schlaf2015)).
4 Data and methods
4.1 Data
Covering the period of the core flood event from the end of May to the start of July in 2013, we have collected German data from the social media platforms Facebook and Twitter via their public API. Figure 3 shows the development of relative frequencies of documents in each case. In order to prepare for further discussions in the paper, we related obvious peaks in document frequencies to important happenings on the event level.
Time and document course, including selected events.

In more detail, for the Facebook flood corpus, we retrieved data from public pages or groups containing the words ‘Hochwasser’ (flood) or ‘Fluthilfe’ (flood aid) in their names. Taking the first significant rise in frequency of messages as the start of the event from the point of view of the medium Facebook and their apparent asymptotic approximation back to normal level as its end, we focused on the time from 1st June to 30th June. The resulting sample corpus consisted of 36.377 messages from 264 public pages or groups.
For the Twitter flood corpus, we retrieved the current version of the research corpus of the QuOIMA project (QuOIMA 2011). The QuOIMA corpus was collected filtering by sixty-five hashtags coming from Twitter research on a sample of relevant messages and from terms related to disaster scenarios used by the Austrian Bundesheer as well as by twenty-nine names of manually chosen public accounts connected to disaster management and flood aid (ibid.). Again, using rise and fall of document frequency as our basis for detection of the core event, we focused on the period between 30th May and 1st July in case of Twitter. The resulting corpus comprised 353.981 tweets.
The demands with respect to pre-processing were kept quite low. Preprocessing of the corpora included deletion of punctuation marks and stop words, tokenization and lemmatization, transformation to lower case and deletion of tokens with length or frequency smaller than 2. Numbers were mapped on a generic reference (Num). Moreover, we performed removal of URLs and usernames marked with the @ sign. In case of Twitter, we additionally removed hashes from hashtags and left out retweets. After this preprocessing, we had a Facebook flood corpus of 28,144 messages/1,297,409 word tokens and a Twitter flood corpus of 194,998 posts/416,302 word tokens which we used for analysis and training for topic modelling and temporal clustering.
For differential analysis of key-terms in our supplementary analysis step, we applied a few additional pre-processing steps. In context of the comparison of thematic structures, location markers were mapped on the string ‘LOC’; for comparison of temporal structures, we deleted names of places and regions, rivers and water bodies, proper names (except for important politicians like the German chancellor Merkel).
4.2 Methods
4.2.1 Topic model analysis
In order to reveal thematic structure in our data collections, topic model analysis on social media posts will be applied. Topic models (e.g. Blei et al. Reference Blei, Ng and Jordan2003; Griffiths and Steyvers Reference Griffiths and Steyvers2002; Steyvers and Griffiths Reference Steyvers, Griffiths, Landauer, McNamara and Kintsch2005) are a family of statistical models based upon the idea that documents are mixtures of topics. We choose the most basic and well-understood model here, namely LDA (Blei et al. Reference Blei, Ng and Jordan2003). As a feature we take as essential in context of application, LDA allows for systematic parameter selection while retaining analyst control. Topic model techniques have proven very useful for searching, browsing, summarizing and soft clustering of large collections of documents. Their application does not require any prior annotations or labelling of documents since the topics emerge from the analysis of the original texts.
In an LDA model, each of the K topics is defined as a multinomial distribution β over the words from the vocabulary. The content of a document then is given in form of a multinomial distribution θ over the topics. The observed data are the words in each document; the topics themselves and how each document exhibits them represent the latent or hidden topical structure which gets derived by means of statistical inference. The topic words pick out a coherent cluster of correlated terms and allow via β for an intuitive interpretation of the topics and via θ for an interpretation of the content of documents. We will infer β and θ from the maximum likelihood estimation of the posterior probabilities of the model variables after running Gibbs Sampling for 1,000 iterations on each of our two corpora. Posts and tweets will be used as the respective document units for our analysis.
In order to optimize the outcome of LDA topic model analysis, we will perform model selection by combining numeric optimization procedures with manual evaluation. Although it is possible to optimize the model parameter in an entirely automatic manner, selecting ‘good’ settings in application-oriented qualitative data analysis scenarios is quite an intuitive undertaking that has to take into account complex conditions and interests within the application domain and should be carried out carefully by human analysts (e.g. Evans Reference Evans2014; Wiedemann Reference Wiedemann2016).
For making the numerically optimal choice for K, we will start by considering a range of K values that seems potentially useful in face of the intended application. For our optimization procedure, we then will refer to a measure of reliability (Niekler Reference Niekler2016). Reliability is known as a methodological quality factor that ensures stable outcome of a method given identical input (Rössler Reference Rössler2005). Topic modelling inference involves stochastic processes which, depending on the structure of the data, cause variability in the outcome of their application due to numerous local maxima in the probability space (Lancichinetti et al. Reference Lancichinetti, Sirer, Wang, Acuna, Körding and Amaral2015). Systematic investigation of the outcomes of multiple runs of such a non-deterministic algorithm is able to reveal which parameter setting produces significantly more stable structures than others (Greene, O’Callaghan and Cunningham Reference Greene, O’Callaghan, Cunningham, Calders, Esposito, Hüllermeier and Meo2014). The measure of reliability conducts such an investigation by bipartite matching of topic pairs from repeated runs of a topic model algorithm. This is realized by calculating cosine distances of topic-term distributions β and β′ from two different models. A topic β i is considered as a match for β′j when their distance is below a certain threshold t = 0.2 and there is no other topic β′¬j with a lower distance:
 \begin{equation}
\text{match}(\beta _i, \beta ^{\prime }_{j}) = \left\lbrace \begin{array}{@{}l@{\quad }l@{}}1, & \text{dist}(\beta _{i}, \beta ^{\prime }_{j}) < t \wedge \text{dist}(\beta _{i}, \beta ^{\prime }_{j}) < \text{dist}(\beta _{i}, \beta ^{\prime }_{\lnot j}) \\
0, & \text{otherwise} \end{array}\right.
\end{equation}
 \begin{equation}
\text{dist}(a, b) = 1 - \frac{a \cdot b}{\Vert a\Vert \Vert b\Vert }
\end{equation}
Since term probabilities representing the latent meaning of a topic accumulate only on a small subset of the entire vocabulary, cosine distance calculation is based on the N = 50 most probable words of each topic. The overall reliability rate between two models then is the proportion of matchable topic pairs:
 \begin{equation}
\text{reliability}(\beta , \beta ^{\prime }) = \frac{1}{K} \sum _{i=1}^{K} \sum _{j=1}^{K} \text{match}(\beta _{i}, \beta ^{\prime }_{j})
\end{equation}
For selecting an optimal parameter K, reliability should be as high as possible so that stable and significant structures are inferred by the model. The outcome of model parameter selection by this numerical optimization will finally be checked by manual evaluation of the model results to ensure a good interpretability and applicability within the user domain.
Manual evaluation is approached by group discussion of analysts reaching for a consensual interpretation of results from the modelling process in the light of their domain knowledge. To support this discussion process, we utilized LDAvis (Sievert and Shirley Reference Sievert and Shirley2014), a software tool for visualization of topic model results and relevance ranking of topic-defining terms. In a final step, the selected models were evaluated by an inter-annotator agreement test to judge on their overall quality. For randomly sampled social media posts, two domain experts were asked to identify the primary and secondary topic given the topic labels and twenty-five top topic words from our selected models. Their selections were then compared to the true primary topic of the posts by calculating an agreement statistic (top1-accuracy measures how often the user-selected primary topic of a sample post is also its true primary topic; top2-accuracy measures how often the user-selected primary or secondary topic is also the true primary topic).
Besides K, the LDA modelling is governed by hyperparameters α and η which are the settings of the prior distributions θ and β, respectively. We will perform optimization of the α parameter (for document’s topic distribution) by using two different measures – perplexity and topic coherence.Footnote 1 Again, the results of the numerical evaluation process will be manually checked. The perplexity measure is used in the majority of the literature (e.g. Blei et al. Reference Blei, Ng and Jordan2003; Rosen-Zvi, Chemudugunta, Griffiths, Smyth, Steyvers Reference Rosen-Zvi, Chemudugunta, Griffiths, Smyth and Steyvers2010; Blei and Lafferty Reference Blei and Lafferty2006b), and, intuitively, relies on the amount of surprise a trained model experiences when being presented unknown documents after the learning phase. A lower perplexity indicates better generalization capability of the model. More recently, the measure of topic coherence has been proposed (Mimno et al. Reference Mimno, Wallach, Talley, Leenders and McCallum2011), which better reflects correspondence between numeric evaluation and the user perception of the quality of topic models. Coherence observes word co-occurrence of the top terms of each topic in documents of a collection and favours models which have more actually co-occurring terms as top terms. In consequence, models with higher coherence model documents as mixtures of few, descriptive topics with high probabilities rather than as a composition of numerous broader topics with more equal probabilities.
Finally, we will take two additional steps to improve interpretability of topics in our chosen model. Because common terms in the corpus often appear near the top of the ranked word list for multiple topics, they can make it hard to differentiate the meanings of these topics (compare, e.g. Sievert and Shirley Reference Sievert and Shirley2014). This effect is especially strong in cases where all topics belong to a common super-topic (in our case ‘flood’). Therefore, we will systematically decrease the ranking of globally frequent terms. Instead of ranking the topic words w for a topic k just by their probability β k, w obtained from the model posterior, we will additionally take into account their probabilities over all topics and determine a rank for w in k (cp. function by.score in the Cran.r package lda):
 \begin{equation}
\beta _{k,w}(\log \beta _{k,w} - 1 / K \sum _{k^{\prime }} \log \beta _{k^{\prime },w})
\end{equation}
As a second step, we compute sentiment scores for each topic. Sentiment analysis is an NLP task concerned with measuring subjective opinion or affective states in textual data (Pang and Lee Reference Pang and Lee2008). To support interpretability of our topics, we compute a sentiment score using the freely available sentiment dictionary SentiWS (Remus, Quasthoff and Heyer Reference Remus, Quasthoff and Heyer2010). SentiWS contains 3.456 German terms classified as either positive or negative. As a basic sentiment score for a topic k, we define the sum of probabilities of SentiWS terms in that topic:
 \begin{equation}
\text{sentimentScore} (k) = \sum _{w \in \text{SentiWS}} \beta _{k,w}
\end{equation}
The score can be interpreted as a proportion of sentiment terms regarding the overall probability mass of a topic. Moreover, to be able to compare both of our social media collections, we calculate the share of sentiment terms regarding the number of tokens in each collection.
4.2.2 Temporal clustering
The topic probability distributions from our topic model analysis will serve as the basis for our investigation into the development of thematic structures over time. The basic idea is to automatically identify time segments where topic distribution is uniform and segment boundaries around where significant changes are occurring. Our approach will follow the main methodological path developed in previous work in Wiedemann (Reference Wiedemann2016) for News corpora.
Using topic distribution rather than, for instance, word counts for identification of time periods has some major advantages. While clustering on word frequencies per time slice may produce reasonable results in case of rather equally sized time slices, our data is very unevenly distributed. Experiments we did with clustering on simple and normalized frequencies with either cosine or Jensen–Shannon divergence as distance measure showed that clusters largely follow patterns of similar token quantities instead of capturing semantic change. For instance, for our collection of Facebook postings, this resulted in clusters of one day in the beginning, two days at the end and a large block of twenty-nine days in the middle of the data set. This basically reflects the situation of very low amounts of postings at the beginning and the end of our investigated disaster event, which is not very helpful for any analysis. In contrast, clustering based on topics is robust against high variance in the distribution of documents over time, since topic proportions are determined in a fixed values range. Moreover, the data basis for clustering represents latent semantics in lower dimensional space which facilitates interpretation of clusters (see Section 6).
To get a dynamic perspective on the topics within a corpus, we will first aggregate and average topic probabilities of every posting p ∈ 𝒫 per day d ∈ D.
 \begin{equation}
\theta _{d,k} = \frac{1}{|\mathcal {P}_d|} \sum _{p \in \mathcal {P}_d} \theta _{p,k}
\end{equation}
This results in a |D| × K matrix of topic probability distributions for each day. This matrix has to be transformed into a |D| × |D| distance matrix, representing dissimilarity of topic distributions between all pairs of days, which can serve as the basis for a clustering algorithm. In line with other NLP research confined to comparing topic model probability distributions (e.g. Endres and Schindelin Reference Endres and Schindelin2003; Hall et al. Reference Hall, Jurafsky and Manning2008), we use the square root of Jensen-Shannon divergence (JSD) (based on the Kullback–Leibler divergence (KL)) our distance metric.
 \begin{equation}
\text{dist}(d, d^{\prime }) = \sqrt{\text{JSD}(\theta _{d,\cdot }, \theta _{d^{\prime },\cdot })}
\end{equation}
 \begin{equation}
\text{JSD}(x, y) = \frac{1}{2} \text{KL}(x : \frac{1}{2}(x + y)) + \frac{1}{2} \text{KL}(y : \frac{1}{2}(x + y))
\end{equation}
 \begin{equation}
\text{KL}(x : y) = \sum _i x_i \log (\frac{x_i}{y_i})
\end{equation}
In face of the rather gradually changing nature of language data, we decided to apply a parametric rather than non-parametric algorithm for temporal clustering. This means that data points will be assigned to a previously defined number of K clusters. The proper selection of K can be heuristically supported by a numerically optimal solution determined by a cluster quality index. An alternative heuristic would choose the number of clusters manually, focusing on conditions and demands on the end-user side. For instance, from the point of view of usability, a numerically optimal solution of, let us say, fifty clusters may be considered less good as a numerically slightly lower ranked solution of 5. As before, we will take into account both strategies in order to optimize applicability of results. As algorithm for temporal clustering, we chose partitioning around medoids (PAM) (Reynolds et al. Reference Reynolds, Richards, de la Iglesia, Beatriz and Rayward-Smith2006). In contrast to other parametric algorithms, like K-means, cluster centres are not represented by means of all assigned observations, but PAM uses cluster representative data points. In comparison to K-means, the algorithm not only runs faster but has the advantage of an entirely deterministic behaviour. For numerical optimization of the number of clusters, we will apply the widely used Calinski–Harabasz (CH) index (Calinski and Harabasz Reference Calinski and Harabasz1974). The CH-index is defined as a normalized quotient of separation and compactness of the clustered data and has been used to determine optimal cluster numbers in many application scenarios.
4.2.3 Differential analysis
Extraction of keywords is another, more traditional way to gain insight into the content of a corpus (Scott Reference Scott1997). Moreover, the method is especially suitable for comparative language studies and will be applied for this purpose here. The ‘keyness’ of a word can be measured on the basis of its relative frequency in the target corpus in comparison to a benchmark taken from a reference corpus. Based on the observed occurrences of a word in the reference corpus, expectations of its frequencies within the target corpus are calculated and the deviation of the actually observed frequency from the expected one then is assessed using a statistical test. Those words occurring with significantly higher relative frequency in the target corpus, are seen as characterizing its content relative to the reference corpus. In our study, we will apply the log-likelihood ratio test (Dunning Reference Dunning1993) as it has proven particularly appropriate for language data (Rayson and Garside Reference Rayson and Garside2000).
5 Thematic structures
5.1 Results from Facebook topic model analysis
5.1.1 Model selection
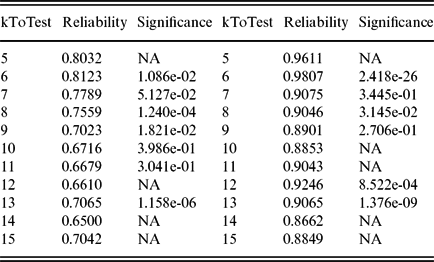
In order to choose the optimal LDA model for our Facebook flood corpus, we performed model selection in line with the method described in Section 4.2.1. For determining the best number of topics K, we calculated models for a range of 5 ⩽ K ⩽ 15. As a basis for testing reliability, we repeated processing twenty times for each K and calculated reliability by pairwise comparison between all runs using the fifty most probable words in each topic and a threshold for cosine distance of 0.2. The reliability for a certain K then is given as the average of the reliabilities of the twenty runs. Additionally, we applied t-test to make sure that the difference in reliability of a K-topic model compared to the reliability of a potentially more detailed and informative K+1-topic model is statistically significant. Table 1 (left) shows the reliability measure for the different K together with the respective p-value. In result of this analysis, K = 6 gets revealed as the numerically optimal choice for the number of topics in the Facebook corpus as the six-topic model is significantly more reliable than all more fine-grained models with K > 6 (and even more reliable than the less-detailed five-topic model).
Reliability and p value for tested K – Facebook (left) and Twitter (right)

As the next step for model selection, we tested for the best choice for the α parameter applying the measures of perplexity and topic coherence as described in Section 4.2.1. The two diagrams 4.a and 5.a show the result of the respective experiments (with fixed K = 6 and η = 1/K). Both measures agree that an α value of 0.05 should be chosen for performing LDA topic model analysis because the resulting model shows the lowest perplexity and highest coherence in comparison to all alternative setting for α. We qualitatively checked the results with respect to its potential applicability in our user domain. The check confirms parameters from our unsupervised process lead to more informative and better interpretable models compared to different settings. In the finally conducted agreement test, domain experts were able to identify the most prominent topic of a Facebook post in seventy-one per cent/Cohen’s kappa = 0.65 (top1-accuracy) resp. eighty-four per cent/Cohen’s kappa = 0.81 (top2-accuracy) of the sampled test cases. This result signals that the model captures coherent, interpretable semantics of the application domain very well.
Topic Coherence. (a) Facebook and (b) Twitter.

Topic Perplexity. (a) Facebook and (b) Twitter.

5.1.2 Facebook flood topics
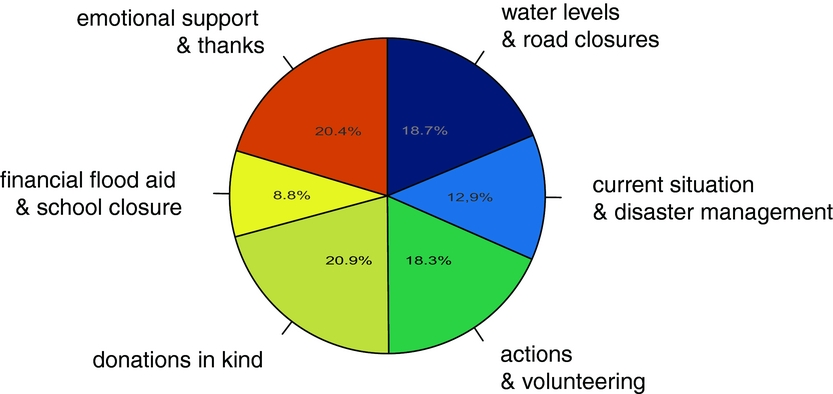
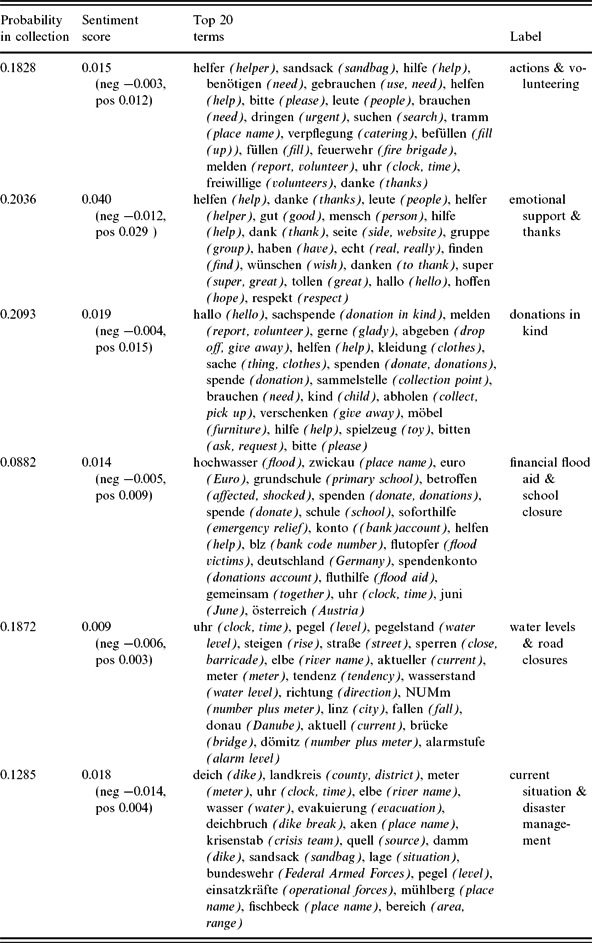
Table 2 summarizes the results from our LDA topic model analysis for Facebook. In the third column, the twenty most relevant words for each topic are displayed together with an English translation. They are ranked according to their probability, coming from the model plus our ranking method described in Section 4.2.1. In the right column, we have proposed a title for each topic on basis of relevant topic words and their thoroughly manual investigation using the LDAVis tool. The first two columns show topic proportions regarding the entire collection and sentiment scores, respectively. The topic proportions are further illustrated in form of a topic wheel in Figure 6.
Topic proportions Facebook.

Topic details Facebook

The first topic, according to Table 2, is concerned with offering, asking for and coordinating volunteer’s help. Furthermore, there is the large topic 2 on giving emotional support to the affected people and thank the helpers. Similarly, important is topic 3, regarded with the organization of donations in kind. Donations in money are covered by topic 4, together with some information on school closures. Furthermore, there is the more factual topic 5, including current information on water levels and resulting road closures. Finally, topic 6 gives information on acute current situations and how they are handled by professional disaster management.
For the further figures, we selected the following colour code in order to support interpretation of results: topics dealing with the current state of the event were colour-coded in shades of blue colours; topics dealing with helping in green; topics dealing with financial issues in yellow; topics involving social emotions in red; topics being somewhere in-between are encoded as a mix of the basic colours (e.g. turquoise as being between blue and green, purple between blue and red).
As can be seen from the topic wheel in Figure 6, the four socially and emotionally relevant topics – marked in red, yellow and green colours – are very dominant in the Facebook flood corpus, taking about eighty per cent of the overall topic space. The two topics including factual information on the event – marked in blue – contribute a considerably smaller proportion. The overall share of sentiment terms in the Facebook corpus is 14.3 per cent, with 11.2 per cent positive emotions clearly dominating over 3.1 per cent negative ones. The most emotional and most positive topic is the one concerned with emotional support and thanks. The most negative topic and the only one where negative emotions are more prominent than positive ones, is related to information on the current situation and disaster management. Like for the other topics with relative strong negative emotions, the negative sentiment scores are mostly associated with the numerous disaster terms here, rather than coming from explicit emotional assessment or involvement by the people.
5.2 Results from Twitter topic model analysis
5.2.1 Model selection
The steps we took for selecting the optimal model for the Twitter flood corpus are exactly corresponding to those just described for Facebook. Repeating the calculation of models twenty times for different K gives rise to the reliability measures and p-values in Table 1 (right). In result, K = 6 is chosen as the optimal parameter setting because the six-topic model is significantly more reliable than all models with K > 6.
Determining the optimal value for the α prior (while K = 6 and η = 1/K) on basis of perplexity and topic coherence left us with a value of approximately 0.1. As can be seen from Figures 4(b) and 5(b), both measures do not completely agree here, but the respective optima are very close to each other. As coherence should be more relevant in context of our study, we took this as our point of orientation, accepting perplexity to be slightly above its minimum. The finally selected model successfully underwent manual checking regarding interpretability in the light of domain knowledge. In the agreement test, domain experts were able to identify the most prominent topic of a tweet in sixty-three per cent/Cohen’s kappa = 0.55 (top1-accuracy) resp. 81.5 per cent/Cohen’s kappa = 0.78 (top2-accuracy) of the sampled test cases. That the agreement is not quite as high as in case of Facebook might be traced back to the fact that, in overall, the Twitter topic are more similar to each other.
5.2.2 Twitter flood topics
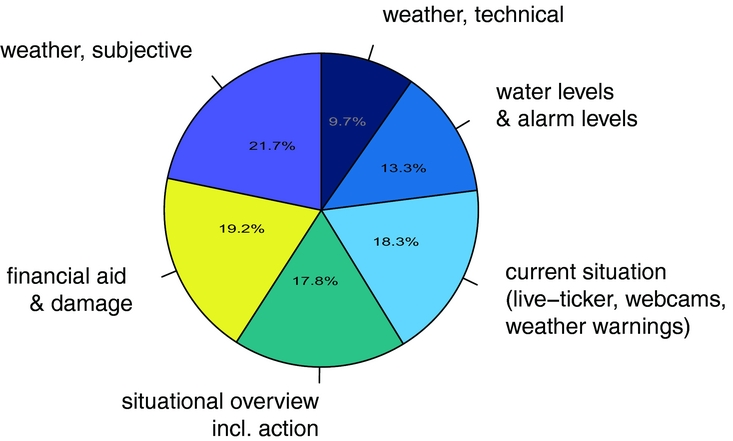
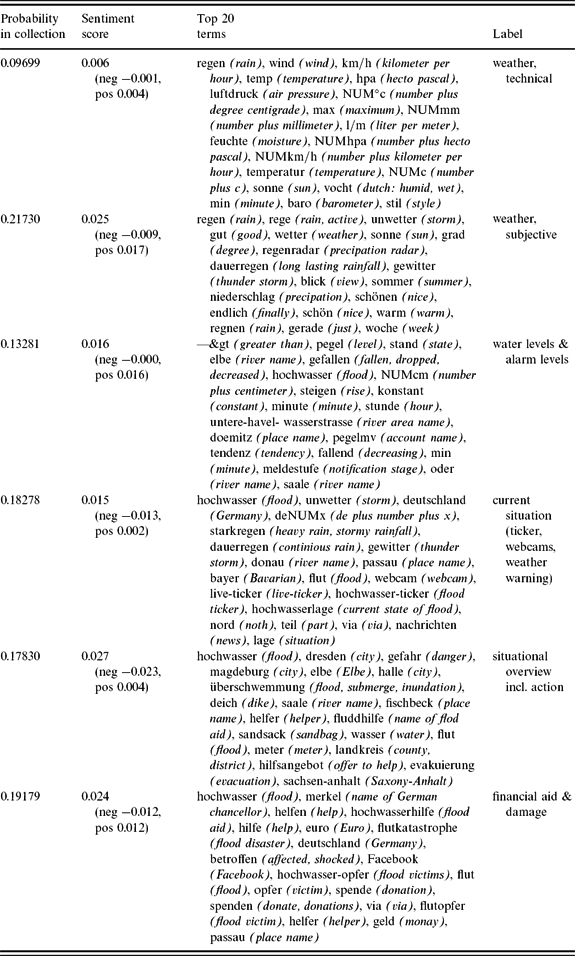
The results from our LDA topic model analysis for Twitter are presented in form of Table 3 and Figure 7 just as before. Topic 1 in Table 3 presents weather facts in quite a precise and technical manner. The prominent topic 2 also is concerned with weather but offers a more subjective view on it by involving emotional assessments by the people. Topic 3 is very objective in style once more and refers to water levels and alarm levels. The focus of topic 4 is on giving up-to-date information on acute situations in connection with the flooding. Topic 5 provides a situational overview and includes factual information regarding different locations as well as reports on flood-related actions. Only Twitter topic 6 brings in some social aspects in form of reports on damages and financial flood aid at the private as well as state level.
Topic proportions Twitter.

Topic details Twitter

This means, when moving from the Facebook to the Twitter flood corpus, the semantic focus just seems to switch. As can be read off the topic wheel and topic labels in Figure 7, the main focus in case of Twitter is on giving current information on the event. Five out of six topics are concerned with information on the factual level, taking a great majority of the overall topic space. Only a minor proportion of the Twitter topical content is socially related. The 10.4 per cent overall share of sentiment terms in the Twitter corpus is considerably less than in the Facebook corpus. 6.8 per cent positive sentiments, again, are more prominent than 3.6 per cent negative ones, although the difference is not as big as in case of Facebook. In the most emotional topic, concerned with situational information and disaster-related actions, the negative sentiments even dominate. This result is in line with our previous observations for Facebook, where negative sentiment scores most prominently appeared in factual topics and were associated with disaster-related terms.
In more detail, topic 1 in Table 3 presents weather facts in quite a precise and technical manner. The prominent topic 2 also is concerned with weather but offers a more subjective view on it by involving emotional assessments by the people. Topic 3 is very objective in style once more and refers to water levels and alarm levels. The focus of topic 4 is on giving up-to-date information on acute situations in connection with the flooding. Topic 5 provides a situational overview and includes factual information regarding different locations as well as reports on flood-related actions. Only Twitter topic 6 brings in some social aspects in form of reports on damages and financial flood aid at the private as well as state level.
5.3 Results from differential analysis of Facebook and Twitter
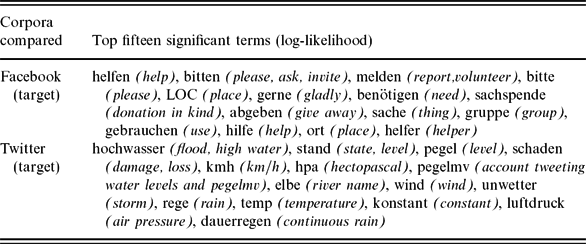
In this section, we take a closer look at the differences in content between the two social media platforms and make them explicit in form of characteristic terms which got extracted by mutual comparison of equal-sized sample corpora via log-likelihood differential analysis. In the first experiment, the Facebook flood corpus played the role of the target corpus while the Twitter flood corpus was used as the reference corpus; in the second experiment, roles just got switched.
Intuitively, according to our topic model analysis, the most striking characteristic of Facebook was its main focus on empathy and social interaction and on the organization of concrete volunteer actions. Twitter, in contrast, was prevalently used to provide up-to-date information on the event. These characteristics also come out clearly as the most striking respective differences when comparing the two corpora on the level of lexical content via differential analysis. In Table 4, the fifteen most significant extracted terms are listed. As one can see, the terms that name the characteristics of Facebook compared to Twitter all refer to asking for or thank for help or motivating and organizing concrete supporting activities, for instance donations. The characteristic terms that are provided to tell apart Twitter from Facebook, on the other hand, all are related to the factual situation in terms of water levels and weather conditions.
Mutual comparison of Facebook and Twitter flood corpora

6 Temporal structures
6.1 Results from temporal clustering for Facebook
6.1.1 Model selection
For deciding on the optimal number of temporal clusters k, we performed temporal clustering with PAM for a range of 2 ⩽ k ⩽ 10 and then calculated CH index for each case. The results of this procedure can be seen in Figure 8(a). A cluster number of k = 3 is clearly marked as the optimal solution for temporal clustering of our Facebook topics. This number seems especially promising from the point of view of applicability in the end-user domain too, given the number of event phases according to the basic disaster management life cycle.
CH index dependent on number of clusters. (a) Facebook and (b) Twitter.

6.1.2 Temporal phases in Facebook flood corpus
The three different clusters cover the time span of the core event like this: the first cluster corpus comprises the period from 1st June to 3rd June; the second goes from 4th June to 11th June; the third cluster covers the time from 12th June to 30th June. In relation to the overall document frequency, the marked time segments roughly correspond to the rise, the peak and the fall of frequency (compare Figure 3). Recall how this course of document frequencies had been brought in close relation to happenings on the actual level of the flood event in Figure 3.
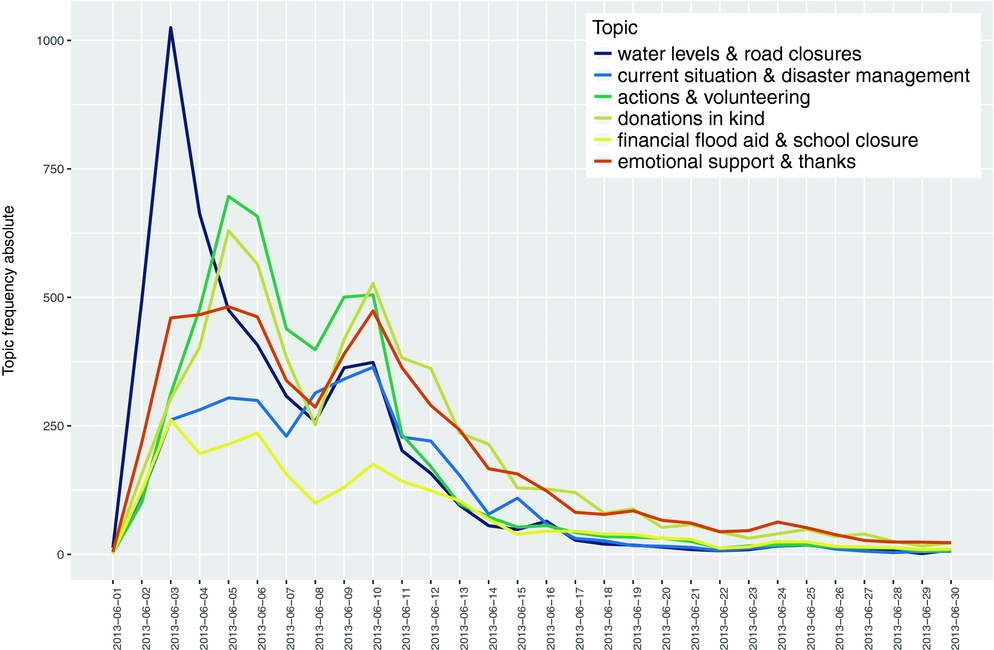
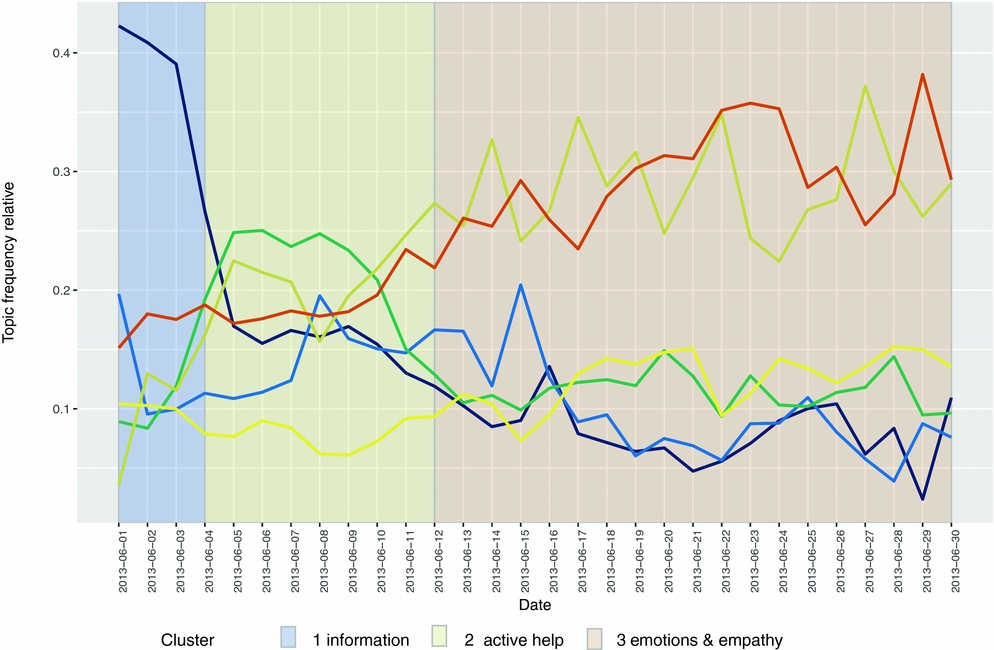
In Figures 9 and 10, one can bring the segmentation done by our clustering algorithm in relation to the development of absolute and relative topic probabilities over time. In Figure 9, it becomes obvious that the different topics show different characteristic life cycles during the time of event. For instance, the dark blue factual topic on water levels rises immediately at the start of the event and quite rapidly falls down again at around the end of the first time phase. In contrast, the green topic, concerned with the organization of volunteer’s help, rises only a bit later and has its most important period during the second phase marked by our clustering algorithm. Finally, the yellow topics on donations in kind as well as the red social emotion topic also rise and peak during the second time segment but then live on at a lower level during the third segment.
Topic frequency absolute Facebook.

Topic frequency relative and cluster boundaries Facebook.

Even more revealing is Figure 10, that shows the time clusters together with the relative topic probabilities, as it makes explicit that different kinds of topics are dominating the different time segments. While the factual topic is the most prevalent topic in the first segment, the topic about organization of volunteer’s actions is the leading topic in the second segment. The third segment is characterized mostly by the topics concerned with social emotions and donations. On this basis, one could think of giving titles to the three clusters corresponding to the most dominant topics they, respectively, include, and, by this procedure, marking characteristic communicative phases of the event. Accordingly, the communicative phases of the flood event following from our temporal clustering of Facebook topics would be (1) information, (2) active help, (3) emotions and empathy.
6.2 Results from temporal clustering for Twitter
6.2.1 Model selection
Just as before, we started by using CH index for selecting the numerically optimal number of temporal clusters. Figure 8(b) shows the results for PAM with 2 ⩽ k ⩽ 10. Here a two-phase temporal model came out as the numerically optimal solution. Unlike we had it in the case of Facebook, though, this solution may not be considered optimal with respect to applicability too. To have two distinct phases only is not expected to be very informative and, moreover, is not in line with the conceptual conditions in context of disaster management where three or more event phases are assumed. Therefore, we decided to go for the second best solution from the point of view of CH index which seems much more promising from the point of view of applicability and took four clusters to temporally analyse our Twitter corpus.
6.2.2 Temporal phases in Twitter flood corpus
The first cluster reaches from 30th May to 1st June; the second goes from 2nd June to 12th June; the third cluster is temporally divided into two separate periods, the first part covering 13th June only and the second part reaching from 19th June to 30th June; the fourth cluster finally covers a time span from 14th June to 18th June. In relation to the overall document frequency (compare Figure 3), the first and second marked temporal clusters roughly correspond to the rise and the peak of frequency again; the fourth cluster shows relatively constant low document frequency. The third cluster, appearing as a narrow segment in the middle of the flood period as well as a wider segment around its end, seems to correspond to renewed rising, peaking and falling of frequency.
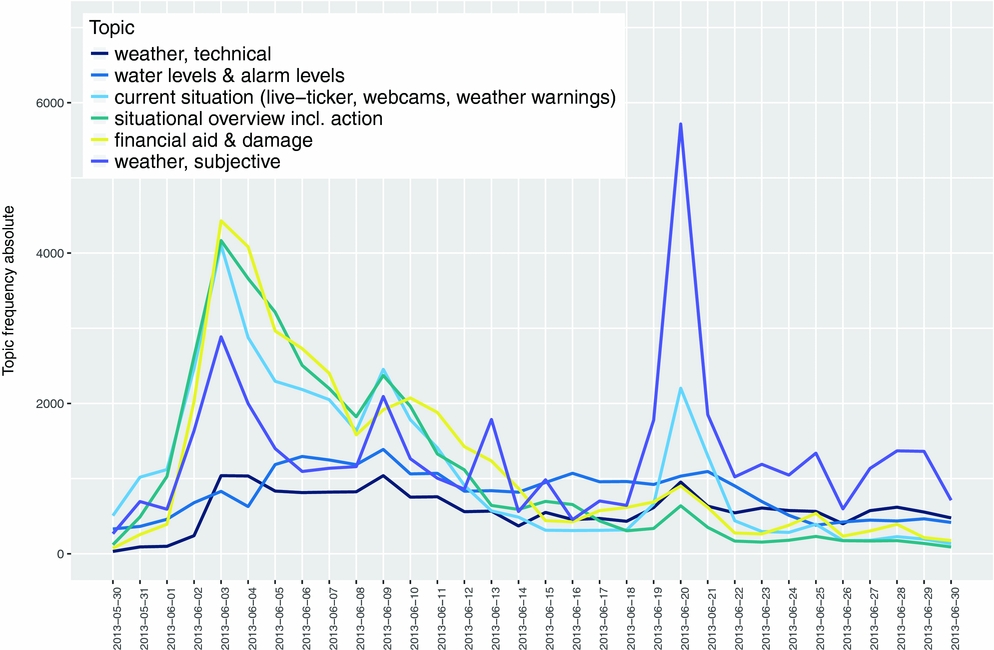
Taking the topical point of view allows for more insight into the temporal structuring of the event and its characteristics communicative phases. As before, Figure 11 shows the development of topic probabilities over time. In the first time segment, all topics appear to be on the rise, and, in the second one, they do the usual two peaks in quite a similar manner. The yellow social topic is falling down a bit more slowly than the factual topics. The middle blue topic on water and alarm levels and the dark blue topic giving weather information in a technical manner appear to be the most constant ones during this period as well as during the rest of the event. In the fourth segment, all topics behave relatively stable at some low level. Cluster number three in the third and fifth time segment shows some interesting characteristics. Both times it is marked by a high rise of the purple topic that includes subjective information and emotional comments in connection with the weather. In the last segment, the other topics likewise show one renewed peaking, though the subjective weather topic proves the most sensitive one, peaking particularly high once and going through a very unstable course of rising and falling thereafter.
Topic frequency absolute Twitter.

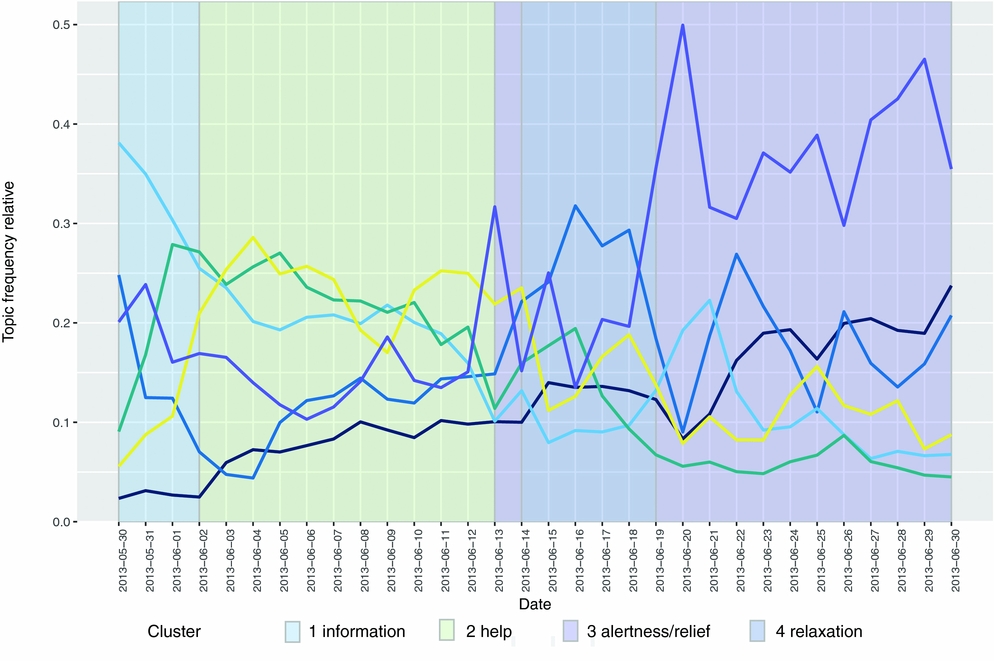
Figure 12 can be used again to characterize the different clusters in terms of topic prevalence within the respective time segments. The first cluster in segment one mainly is concerned with information on the current state of the event. The second cluster in segment two still includes much information on the factual level but its most characteristic and dominant topics refer to help and actions. Cluster four in the fourth time segment, reflects some state of relaxation, with the topic just constantly giving information of water level dominating in the absence of all other topics. The interesting third cluster in the third and fifth time segment, finally, is clearly dominated by the subjective and emotional weather topic. In order to better interpret this cluster, we relate the relevant time segments to happenings on the level of the actual event according to Figure 3. Thereby, it becomes clear, that this cluster reflects subjective alertness and relief in face of heavy thunderstorms and rains and renewed smaller rising and falling of water levels. After just having experienced a huge flood some days before, people seem to be especially vulnerable and react much stronger on an affective level than they actually did during the main event. They even keep on observing and placing negative or positive comments regarding the weather for quite a while after the critical situation has passed. In sum, the communicative phases of the flood event following from our temporal clustering of Twitter topics might be called (1) information, (2) help, (3) alertness/relief, (4) relaxation, (5) alertness/relief.
Topic frequency relative and cluster boundaries Twitter.

6.3 Results from differential analysis of temporal phases
In this supplementary section, we take a second look at the characteristics of the clusters from an alternative perspective, not structuring content according to latent topics but zooming out and just looking at the documents from a certain period of time all at once as a single time cluster corpus. We will make cluster characteristics explicit in form of characteristic terms which got extracted via log-likelihood differential analysis, taking the corpus of a particular cluster as the target corpus and the corpus comprising all other clusters as the reference corpus, respectively.
6.3.1 Characteristic phase terms of Facebook flood corpus
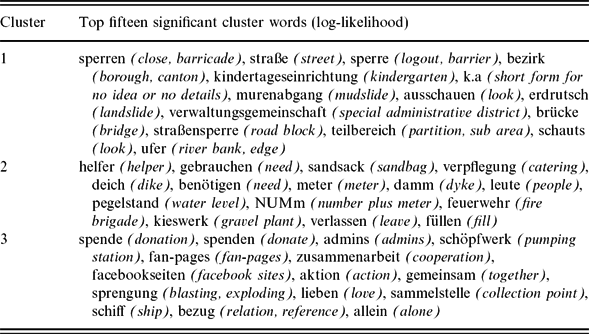
In Table 5, the fifteen most significant keywords for the three Facebook clusters are shown in decreasing order. For cluster one, the terms are related to effects of the flooding on social life, mainly traffic and schools or kindergartens and seem to convey information on the current state. In the second cluster, the main focus is on activities to fight the flood and the terms reflect engagement in the organization of volunteer actions. In cluster number three, finally, the keywords show relations to two different semantic domains. First, there appear words relating to donations or reflecting on cooperation and showing emotional involvement. Second, there shows up special vocabulary in connection with a particular event on June 15th and 17th when three barges were blown up and sunk in order to close a leak in a dike near Fischbeck. This last semantic association should be seen as accidental rather than systematic, being caused by an individual sub-event rather than based on the general development of the main event.
Significant cluster terms Facebook

Put aside the accidental factors, the general characterization of the three Facebook clusters received by differential analysis seems quite in line with the characterization we have already set up on base of dominant topics in Section 6.1.2, just adding some more details and special aspects. We interpret this result as a confirmation of our proposed cluster labels for the Facebook flood corpus: (1) information, (2) active help, (3) empathy and emotions.
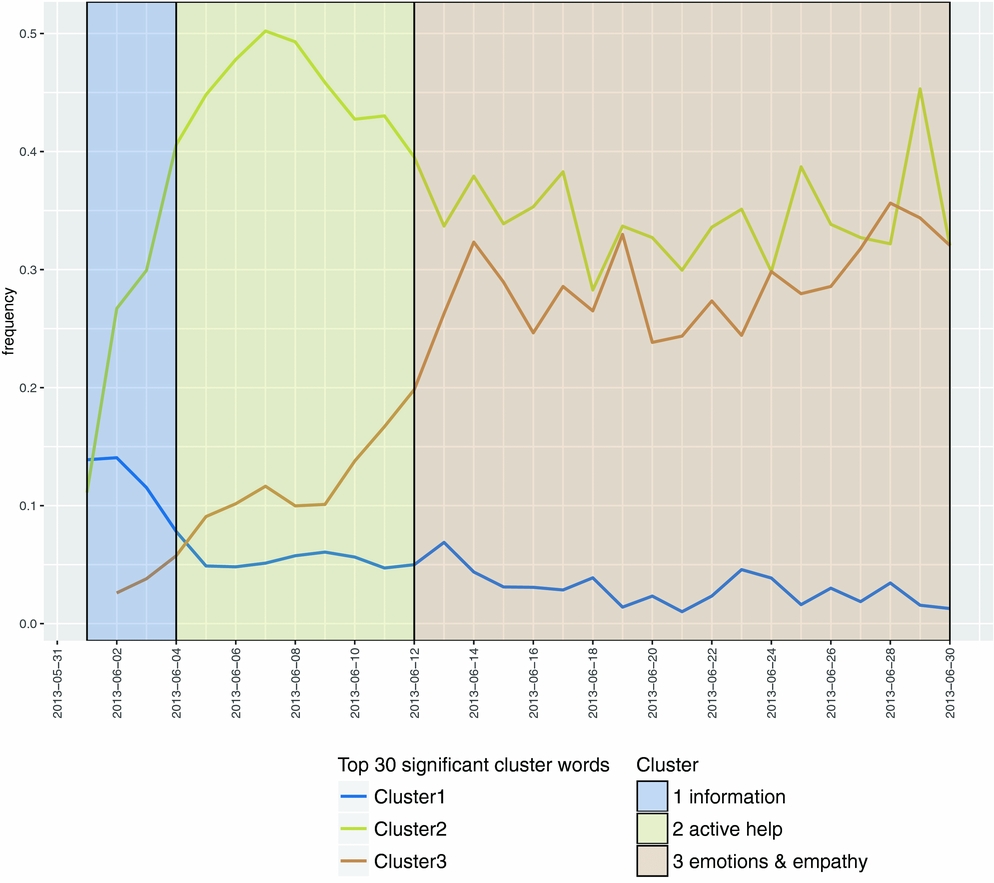
But more relevantly, having available a list of keywords associated with every temporal cluster now provides us with a very simple and direct mean to monitor the development of the event. To test for the reliability of the respective association between terms and clusters and for strength of the signals around phase boundaries, we have aggregated the frequencies of the thirty most significant terms for each cluster at every point in time and then plotted the development of these combined frequencies over time in Figure 13. In each case, the combined frequencies of the respective cluster terms peak right in the temporal cluster they are associated with. Moreover, looking at the three profiles of rising and falling of frequencies all together, there seems to be derivable information on an oncoming phase boundary ahead of time of the actual start of the respective phase.
Frequency of aggregated top thirty cluster terms and cluster boundaries Facebook.

6.3.2 Characteristic phase terms of Twitter flood corpus
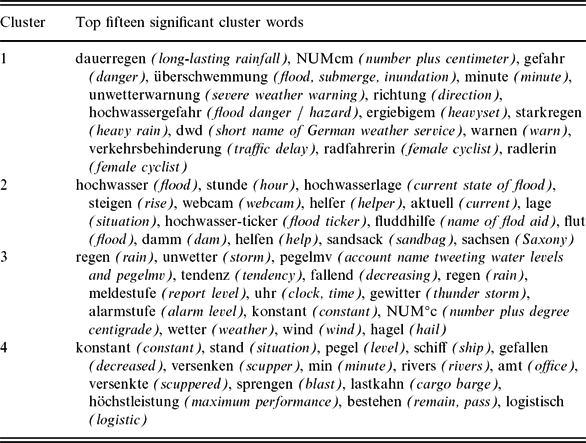
Table 6 offers the fifteen most significant keywords for each of the four temporal clusters we had automatically extracted from our Twitter flood corpus. According to differential analysis, the first Twitter cluster includes information and warnings in face of the upcoming flooding. The terms are referring to severe weather conditions and rainfalls and make announcements on water and alarm levels. First floodings are reported together with resulting traffic obstructions. The second cluster still informs about the current state of the event in terms of water level and critical effects, but now vocabulary reflecting actions of professional and volunteers to fight the flooding is included too. In cluster three, there appear two very different situations that are reported on. On the one hand, a state where water levels are constant or falling, on the other hand, and even more prominently, a state where a severe situation is described in terms of thunderstorm, hailstorms and alarms. The fourth Twitter cluster finally, is divided into two semantic parts again. First, there seems to be a relaxed state where water levels have fallen and remain constant. Second, we again find traces of this particular event where barges have been blown up and sunk to stabilize the dike near Fischbeck.
Significant cluster terms Twitter

Again, focusing on the general pattern that can be read off the clusters and leaving aside the peculiarities like the sinking barges near Fischbeck, the characterizations of the Twitter clusters we just got in form of keywords are in line with the cluster labels we had proposed on basis of dominant topics before in Section 6.2.2: (1) information, (2) help, (3) alertness/relief, (4) relaxation. Generally, it has to be noted, though, that the semantic characterization of the clusters on basis of latent topics seems to be more helpful and stringent for an interpretation of the results of the automatic temporal clustering than a characterization on basis of the combined frequencies of cluster-related terms due to a big overlap of general flood-related vocabulary and a stronger influence of individual events in the latter case.
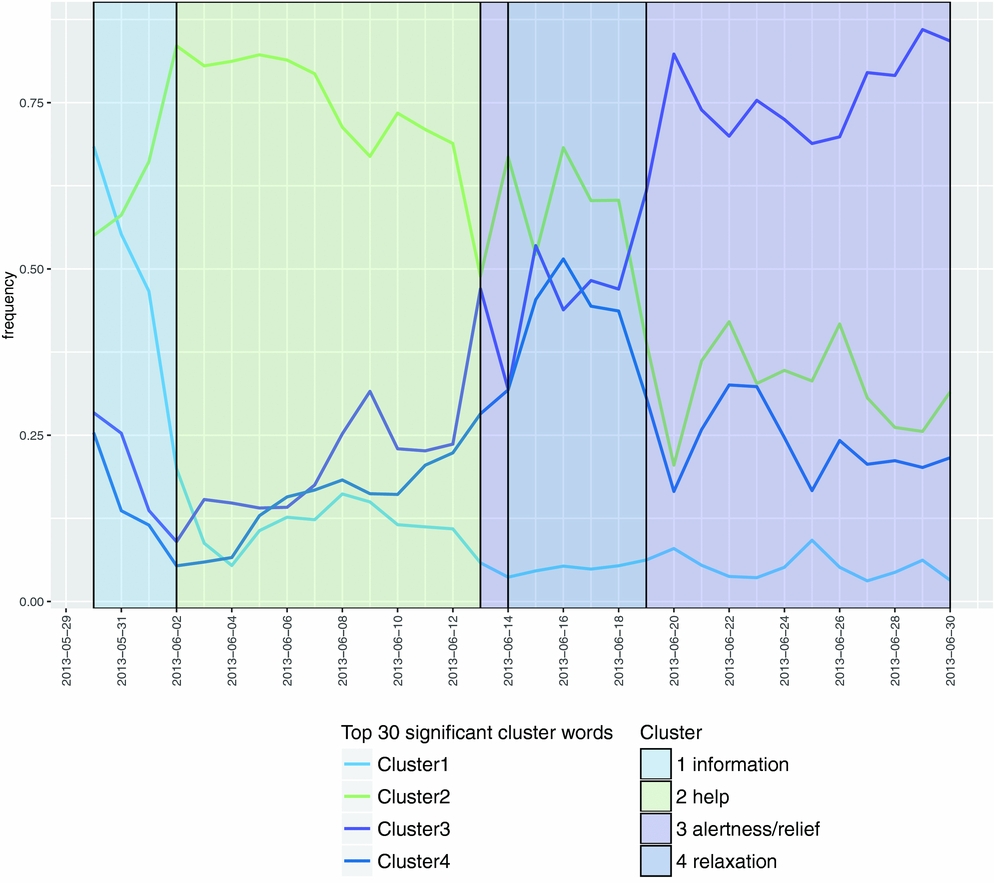
But let us check again the potential of the combined frequencies of cluster terms for an easy monitoring of the development of the event. In Figure 14, the development of aggregated term frequencies of the thirty most significant terms for all clusters over time is shown in relation to the temporal phases in the Twitter corpus. Again, each term bundle reaches its highest frequencies within that cluster it is associated with, and the rising and falling of the frequencies give significant hints towards an approaching phase boundary, hence, the start or end of a characteristic temporal phase. In context of event monitoring, the use of aggregated frequencies of characteristic cluster terms seems to be a good possibility that allows for an easier and more efficient implementation than the use of latent topics (compare Figures 9 and 11).
Frequency of aggregated top thirty cluster terms and cluster boundaries Twitter.

6.4 Comparison between temporal structures in Facebook and Twitter
Comparing temporal structures in both our social media flood corpora, we, first of all, find considerable overlap with respect to positions of phase boundaries and general phase characteristics. Both corpora show an onset time span of four days, starting on the 30th May for Twitter and 1st of June for Facebook, where the focus of contents is on informing and warning people and get organized in expectation of the flooding. The acute status of the flood event is enclosed inside a particular cluster in both cases, starting on the 2nd June for Twitter and 4th June for Facebook and extending to 12th June or 11th June, respectively. Besides information, action is the most prevalent theme in the second phase on both platforms. The final phase on Facebook is spreading uniformly from 12th June towards our chosen endpoint at 30th June and is dominated by social interaction, empathy and positive emotions. Twitter, on the other hand, is dividing up this final time phase, telling apart a state of relaxation from periods where a basic feeling of alertness or relief seems to renew or persist. As our generalized uniform temporal schema for temporally structuring of flood-related social media content, we assume a three-fold division into (A) information, (B) help, (C) empathy and emotions, with an optional extra alertness/relief state related to a renewed rise of threat.
Beside great commonalities, there also appear systematic differences between the two social media platforms which can be interpreted in line with the general characteristics of the platforms as previously described. The focus of Twitter content is on up-to-date factual information on the event; so the frequency of tweets during the information phase rises early and quickly. Facebook is prevalently used for social interaction and organization of volunteer’s activities; accordingly, it takes a little bit longer for Facebook activities to get started but the level of activity remains very high during the whole second time segment. Although both platforms put emphasis on responsive actions and help, Facebook is much more directly involved in the organization of volunteer’s activities while Twitter is mostly taking an observing and reporting point of view. In the third main part of the event after the 12 June, both platforms show emotional content. But while on Facebook, these emotions live on a social level in form of empathy, thankfulness and shared joy, on Twitter they take place on the factual level and emotional comments mostly relate to weather. Finally, the state of alertness that is brought in by Twitter but not by Facebook during the last main part as an additional aspect, reflects Twitter’s special attention to current factual information on weather conditions and water levels. Since actually no new great flooding and damaging happened to take place, Facebook users did not renew their engagement in organizing responsive actions.
7 Discussion
7.1 Analysis of thematic structures for disaster management
In our investigation of thematic structures in German social media data relating to the flood in 2013, we conducted a topic model analysis using the LDA algorithm. In face of the relatively unknown nature of social media data, our application of LDA topic modelling included several optimization steps as to set the parameters of the models rather than referring to default values. In result of our experiments, we came to reveal very reliable, coherent and meaningful clusters of content by direct application of the algorithm to social media. This should be seen as disproval of the common assumption (e.g. Zhao et al. Reference Zhao, Jing, Weng, He, Lim, Yan and Li2011) that direct application of topic modelling to social media is not feasible.
A second, more general common prejudice in connection with social media analysis in concrete user scenarios like disaster management is that structured information extraction for social media needs supervised methods with manually prepared categories (e.g. Palen et al. Reference Palen, Anderson, Mark, Martin, Sicker, Palmer and Grunwald2010; Starbird and Palen Reference Starbird, Palen, Hughes and Vieweg2010; Vieweg et al. Reference Vieweg, Hughes, Starbird and Palen2010; Starbird and Palen Reference Starbird and Palen2012; Imran et al. Reference Chowdhury, Imran, Amer-Yahia, Castillo and Asghar2013; Reuter et al. Reference Reuter, Heger and Pipek2013; Reuter and Schröter Reference Reuter and Schröter2015). This is based on the assumption that results will not be directly interpretable within the special conceptual framework established within the user domain if categories are derived automatically within an unsupervised setting. The basic conceptual schema we found in Section 2.3 in connection with a thematic structuring of information in disaster management were the different dimensions of a crisis – the real event, the actions of the involved organizations and the perception of the crisis (BMI 2008). Therefore, in order to theoretically evaluate interpretability of our results within the end-user domain, we should try and bring our topical structures in relation to these pre-defined three dimensions.
When reporting on our concrete results of topic model analysis, we had already come to arrange the topics in both our corpora in some intuitive, more general order. On the one hand, there were the factual and objective topics concerned with weather conditions, water levels, traffic obstruction and more general, objective aspects of the situation. On the other hand, we had topics related to concrete actions and the organization of help. Finally, there were emotional topics, either talking about feelings in the context of social interaction (like empathy) or feelings directed to the event (for instance, weather conditions). Notably, there appears to be a strong tendency for topics to belong either to one or the other dimension by being prevalently concerned either with factual information, the organization of actions, or with emotions. Though, there is not absolutely strict functional relation between topics and those more general categories, as one topic can show aspects of more than one category to different proportions (for instance, the subjective weather topic). Comparing this intuitive more general ordering of topical content with the three-dimensional ordering on the side of the disaster management conceptual framework, we argue that there is a very strong correspondence between the two conceptual structures. Just like the topics themselves have been created via soft clustering, the procedure for relating topics to crisis dimensions would be a soft categorization.
For final testing of the interpretability and applicability of our topic model results, we gathered informal feedback from a group of end-users from German disaster management. After being introduced to the general idea of topics and a software tool making usable our models via a graphical interface, the end-users gained a quick understanding of the meaning of the topics and their potential use within the context of their professional work. In sum, the feedback of the end-users with respect to our topic model results was very positive.
On the basis of our successful embedding of topic categories into theoretical background of disaster management and taking into account the positive feedback from end-users, there can be claimed good interpretability of our topic model results in the user domain. In face of this, the prejudice against unsupervised methods for content analysis in concrete user scenarios like disaster management seems not justified. Further arguments in favour of unsupervised approaches for crisis informatics will be offered in the next subsection.
Topic models can be used for a variety of purposes in the context given. Well-trained models for flood-related Twitter and Facebook data are a powerful tool to cope with the problem of information overload in context of disaster management application and research as they give at hands a mean to automatically filter, sort and analyse huge amounts of social media data. For instance, the inferred model may provide a quick overview of the content of a huge collection of messages and point out the main topics included there. Moreover, the model could be used to thematically order new incoming messages by providing topic labels and topic probabilities to each of them. By being structured and ordered according to thematic categories, the information will get more comprehensible and suitable to effectively satisfy special information needs and particular interests of different end-users from disaster management. Zooming in and out and changing your topical point of view within a topic model lends great flexibility to an end-user. In addition, the calculated topic words can play the role of search and filter terms for retrieval of more data within a certain topic field. Such a topic-based approach to retrieval of social media data in crisis management can supplement and refine existing terminology-based approaches (e.g. Olteanu et al. 2014; Temnikova, Castillo and Vieweg 2015).
As a supplementary focus of analysis, thematic structures in the data from the two social media platforms considered have been brought under a comparative perspective. Results from topic modelling, sentiment analysis and differential analysis revealed clear and systematic differences. According to our study, the main focus of Facebook content is on empathy and emotions and on social engagement and Facebook generally takes the perspective of the affected people. Twitter, in contrast, is mainly used for exchange of current and concrete information on the event and takes a more factual point of view on the event. This new insight concerning systematic differences in use of German Facebook and Twitter in context of a crisis was first made in our preparatory quantitative studies in Gründer and Schlaf (2015) and put on a more elaborated methodical basis in this paper. Very recently, it received general support from a complementary study by Kaufhold and Reuter (Reference Kaufhold and Reuter2016) using qualitative methods and interviews with Facebook group founders and activists.
From the point of view of application, these results can serve as an orientation point for professional disaster managers who seek to successfully search for relevant information in social media. At the same time, the outcome of our study can support them to place their own information in the right context and in an appropriate style as to gain people attention and trust.
7.2 Analysis of temporal structures for disaster management
An additional methodological aspect we tested in connection with topic modelling for social media analysis is the temporal dynamics of topic development and the suitability of topics as a basis for temporal clustering. On basis of topic distributions, we successfully extracted coherent and meaningful temporal clusters with PAM in both our corpora without further supplementary steps or real supervision. This speaks in favour of our new approach to temporal clustering of social media data on basis of topics.
There was a high correspondence between both corpora with respect to the number of clusters as well as the position of important phase boundaries. The variations in content of the respective phase between Facebook and Twitter can be traced back to the systematic differences in the thematic profile of the platforms as described in the previous subsection. The same holds true for the additional alertness/relief phase that occurred on the side of Twitter. At this point, though, it also should be recalled that we had pushed towards a more fine-grained temporal clustering in case of Twitter by choosing the second best number of clusters over the one that had been chosen as the best by the automatic optimization algorithm (compare Figure 8(b)). This choice may, furthermore, have led to the effect that the interpretation of clusters in case of Twitter seemed not quite as easy and clear as in case of Facebook, especially for the last two clusters.
As before, in order to prove interpretability of our results from unsupervised analysis within the user domain, we will look for correlation between the temporal clusters we extracted and the concept of disaster management life cycle from Section 2.3, either described on a factual level (Baird, Reference Baird2010) and more or less related to alarm levels (LUBW and LfU 2015) or from a psychological point of view (Mahon Reference McMahon2011). The three general phases we found when clustering on social media topic distributions were information; help; empathy and emotions, with an extra alertness/relief-state for renewal of threat. On the other side, we have the most basic disaster management life cycle with its soft categorization of temporal phases into preparedness; response; recovery. At the same side, finally, there are the short-term parts of the psychological life cycle for a crisis or disaster including threat phase; heroic phase; honeymoon phase. Comparing schemata on both sides, we again state that there is a very strong correspondence between our structure and categories and the structures and categories from within our application domain. The communicative behaviour of seeking and offering information during the first phase can directly be related to preparatory actions on the side of disaster management as well as to the sensation of threat. The second communicative phase with its focus on helpful actions can be seen as the response phase in social disguise and it goes very well with the predicted heroism on the psychological level. Finally, the phase characterized by high empathy and positive emotions relates to the first phase of recovery and very well reflects the honeymoon feelings. Our extra alertness/relief phase can be interpreted as going back to a state of preparedness and feelings of threat in face of new danger and living positive feelings of relief after the danger passed.
Let us further see whether we can even find some rough correspondence with respect to the concrete timeline. In Figure 1, we had given the development of water level and the corresponding alarm levels for the river of Elbe in the city of Dresden. Of course, since the times of certain happenings or alarm levels reached were slightly varying between different locations in Germany and Austria our data refer to, we will not aim at a precise match but rather expect to mirror the picture just roughly. Relating the alarm levels to disaster management phases, we get the following approximate dates: 1st to 3rd June preparatory phase; 4th to 10th June response phase; from 14th onwards tendency recovery; higher renewed alert states with control and watch around 13th and 27th June. Additionally, taking into account weather warnings, we get highest alarm levels around 2nd June and 19th/20th June. Taking together the alarm profiles for water level and weather induce a phase structure to the event that is very much corresponding to the structure we found on basis of clustering on topical content of social media messages.
In overall, we interpret these results as proving high correspondence between the temporal structures and categories we extracted on basis of topic distributions and the ones assumed in disaster management and therefore claim high generality of our schema and interpretability within the end-user domain. As before, positive feedback from our group of end-users gave further confirmation to this claim. This means unsupervised methods can successfully be applied in context of temporal analysis and clustering of social media data. The approaches commonly used so far on basis of manual labelling (e.g. Parsons Reference Parsons, Atkinson, Simperl, Weal, Gangemi, Leonardi and Panconesi2015) or supervised methods (e.g. Iyengar et al. 2011; Chowdhury et al. Reference Chowdhury, Imran, Amer-Yahia, Castillo and Asghar2013; Yang et al. Reference Yang, Chung, Lin, Lee, Chen, Wood, Kavanaugh, Sheetz, Shoemaker and Fox2013) do not represent the only options.
Given the high dynamics of social media information, permanent updating of the information state is essential. We saw that the course of the event is directly mirrored not only on the level of document frequencies but also on the level of different topics probabilities. By tracking topics over time, one can get a quick idea of the current state of an event, the type of information available or needed and the status of the people at a certain moment. Likewise, it becomes possible to observe and analyse the overall development of the situation and to possibly identify upcoming trends or critical situations in the social dimension of the event. Knowing or even anticipating which kind of situation is present or appearing at which point in time during an emergency event, is essential if one wants to react timely and adequate to information needs or emotional demands of the public. Temporal clustering of topical content allows categorizing typical stages of a certain type of event and get a structured picture of its general generic life cycle on a social and communicative level. Typical stages can be correlated with typical demands as well as typical potentials and thereby can serve as a basis for a more systematic understanding of a current situation. Moreover, understanding the life cycle of an event should enable improved planning and organization of helpful actions. By monitoring of characteristic phase terms, it might be possible to effectively predict an oncoming phase transition and therefore anticipate future demands. The characteristic phase terms we extracted by differential analysis strongly correlate with phase boundaries. At this point, further research will be necessary in order to enable reliable application in end-user contexts.
8 Conclusion
Taking the flood 2013 in Germany and Austria as our case study, our study proved high potential of social media content for German disaster management in all three dimensions of a crisis. Interestingly, the two social media platforms Facebook and Twitter, rather than just competing in the identical part of the media spectrum, play quite different and complementary parts. Moreover, the temporal development of social media content goes quite parallel with the varying interests end-users have at different temporal stages during the life cycle of a disaster.
With respect to the real event, social media is intensively used for sharing of up-to-date information on different factual aspects of the event (e.g. weather, water levels and traffic obstruction) and for warnings. In this way, social media can contribute to the improvement of situational awareness and timeliness of early warnings in the preparatory and response state. In the dimension of the activities related to the event, social media play a very important part in the organization of volunteer activities and donations. Here the potential is to improve social connectedness and concrete support possibilities in the response and first recovery stage. From the point of view of disaster management, social media provide perfect connection points to get into immediate contact with the volunteer’s movement and bring it from the current state of independent private engagement into a state of organized participation. As for the perception of the crisis and its emotional processing, social media provides a good and frequently used possibility to directly show empathy, provide emotional support or practice emotional (self-)management. In this way, social media are a valuable resource for psychological (self-)help especially during the recovery stage of a disaster. Disaster management or humanitarian organizations can use the platforms as ‘social sensors’ to get to know most directly about the emotional state of the people and to better fulfil corresponding requirements.
The basis thematic categories and the temporal schemata we revealed in this study give a quite general picture of the structure of social media communication during a natural disaster, especially flooding. In overall, our results should contribute to further fill the research gap with respect to properties of German social media crisis communication and their potential for disaster management and, moreover, give some input and impulse to interdisciplinary research, for instance in communication, linguistics and media studies.
Taking the methodological point of view, our study proved the applicability of unsupervised methods for structured information extraction in crisis informatics. Especially, we claim that topic modelling techniques are suitable for analysing social media data in context of disaster management in the thematic as well as temporal dimension. With respect to the thematic dimension, we provided an optimization workflow to adapt the LDA algorithm to the peculiarities of the new data type. Regarding the temporal dimension, our investigation offered a new way to analyse topic evolution and temporally cluster highly dynamic data on basis of topic distributions. We think that topic modelling techniques, as part of crisis management software, should be able to provide efficient and flexible computer-based access to social media content to disaster managers.
9 Outlook
An implementation of topic modelling that was the core of our study has become part of the general text analytical module of the integrated disaster management/social media analysis software prototype that has been the outcome of the European project Slandail (Slandail 2014). End-users have been involved in the development of the system from design to testing. Within the text analytical module, topic modelling has got combined with other NLP functionality, e.g. geolocation or named entity recognition, in a very fruitful way (see Gründer-Fahrer, Schlaf, Wustmann 2018). The software module is currently under consideration by German authorities for future use in German disaster management.
For further confirmation and refinement of our results and in order to grant generalizability and future applicability of our models, the methods should be applied and tested with respect to more events in future work. Therefore, we are planning to apply and test our methods with respect to other flood events or natural disaster of a different kind as soon as appropriate German data are available. Furthermore, it would certainly be interesting to extend this kind of analysis to different languages and social communities as to investigate commonalities and differences in the organization of public, collective and individual help, social behaviour, sociolinguistics and media use.
In our current research, we are also widening our focus as to include other types of crisis events, in particular, we are interested in man-made crises where messages on social media not only arise in reaction to the event but play a very active part in causing it. Here, we are analysing the role of social media in the current nationalist, anti-Islam, far-right political movement in Germany (e.g. Pegida).
In terms of further research in the field of topic modelling and temporal clustering, we want to extend the identification of temporal phases in a more fine-grained resolution. Wang, Agichtein and Benzi (2012), for instance, propose TM–LDA, a method to identify and predict typical changes of topics in social network feeds over time. For disaster management, this may provide interesting insights to (1) separate early adopters and late-comers among users, (2) learn about the different local or temporal proliferation of news and (3) allow for prediction of trends from live data streams.
Finally, much more should be said and done regarding the adaptation of other NLP methods to the peculiarities of social media language and to special characteristics of German. In our study, we consciously focused on optimization of our core method only and treated the problem on a general rather than language-specific level. Here, many interesting questions are still open for future research and we hope to contribute to answering some of them with our own future work.