Introduction
Crop-livestock-forest integrated systems (CLFIS) have been used as a strategy of sustainable agricultural intensification that integrates annual crops, trees and livestock activities on the same area and in the same season (Balbino et al., Reference Balbino, Cordeiro, Silva, Moraes, Martínez, Alvarenga, Kichel, Fontaneli, Santos, Franchini and Galerani2011). Among the controllable factors that determine crop and forage yield and quality, soil fertility, including lime and fertilizer use, is one of the most important in the highly weathered, low-fertile and acids soils of the Brazilian tropical region (Bernardi et al., 2012). Providing an adequate supply of nutrients is important for high yields and is essential to maintain high quality and profitable yields in CLFIS. However, soil fertility management without taking account of spatial variation within fields may directly affect crop yield and environmental quality (Bernardi et al., Reference Bernardi, Bettiol, Ferreira, Santos, Rabello and Inamasu2016).
The precision agriculture (PA) approach based on management zones indicates that variations of topography, soil class, soil-water and nutrient levels may be mapped and the different zones delineated. So, each zone then becomes a management unit in which issues of variable-rate applications, using on global navigation satellite systems (GNSS), are implemented to achieve optimum yield, quality and economic profitability. Due to characteristics of rotational grazing, in which the pasture area can be divided into sub-pastures, called ‘paddocks,’ this subdivision becomes a management unit.
A PA approach for management of integrated systems of tropical pastures, annual crops and trees based on variable rates application of lime and fertilizer needs to be tested. In spite of many existing techniques for data and interpolation, kriging and inverse distance weighting (IDW) are the most commonly used methods for continuous mapping (Robinson and Metternicht, Reference Robinson and Metternicht2006). The objective of this research was to map and evaluate the spatial variability of soil properties, liming and fertilizer needs of a CLFIS using kriging and IDW.
Material and Methods
Field characterization
This research was conducted in a study area of 30 ha in the crop-livestock-forest integration system (CLFIS) at Embrapa Pecuária Sudeste in São Carlos, Brazil (21° 57’S, 47° 50’W, 860 m alt) in a Red-yellow Latosol (Oxiso in USDA Soil Taxonomy). The climate is tropical, with 1502 mm of annual rainfall and average minimum temperature and maximum temperature of 16.3°C (July) and 23°C (February), respectively. The CLFIS system includes different combinations of prodction, as follows: i) intensive grazing of Piatã grass (Urochloa brizantha); ii) crop-livestock integration (CLIS), in which each year one third of the area is renovated by planting corn intercropped with Piatã grass; iii) crop-livestock-forest integration, CLFIS planted with Eucalyptus urograndis (GG100) in simple rows and alleys with a 15-m spacing and 2-m distance between trees; iv) pasture-forest system, with Piatã-grass and Eucalyptus, and; v) extensive system of Signal grass (Urochloa decumbens).
The pastures are managed in a rotational system with 6 days grazing and 35 days rest in both rainy and dry seasons. The paddocks are divided with electric fencing into 6 paddocks of 0.5 ha each with 2 replications.
Soil sampling and issues recommendation
The soil sampling strategy was based on 6 sub-samples collected at 0–0.2 m depth for each 0.5-ha paddock. The chemical properties were determined as follows: soil pH measurements were made in CaCl2, organic carbon was determined by wet combustion and available P was assessed using the resin method. Exchangeable K+, Ca2+, Mg2+ and H+Al were also measured. Cation exchange capacity (CEC) was measured at the actual soil pH value, and base saturation (%V) was determined. Soil particle size fractions (clay content) were determined by the hydrometer method. Lime and fertilizer recommendation were calculated: lime to increase basis saturation to 70% for maize and 60% for pastures, P fertilizer (super single phosphate, 18% P2O5) to increase soil P to 15 mg dm−3 and K fertilizer (KCl, 60% K2O) to increase exchangeable K to 3% of soil cation exchange capacity. Each paddock was considered a ‘management unit’, and the recommendation of lime and fertilizers was calculated considering the 0.5 ha area.
Data analysis
Statistical parameters were estimated and geostatistical analyses were conducted for all variables, focusing on the spatial continuity and dependence of soil and forage properties. Empirical directional semivariograms were calculated for the x- and y-directions. Semivariogram models were fitted to empirical semivariograms using GS+ to estimate the structure of the spatial variation. Inverse distance weighting (IDW) interpolation was also used. Contour maps of all variables were estimated using ArcGIS 10.1. Correlation studies were performed between interpolated maps by management unit (MU) and kriging and IDW techniques of lime, KCl and super single phosphate (SSP) requirements. From the maps obtained by management unit, kriging and IDW, values were sampled at the same geographical position in a virtual sampling grid of 648 points, regularly distributed over the set of data predicted for the study area and a correlation study was carried out.
Results and discussion
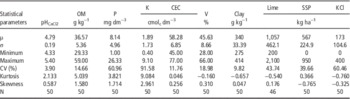
Statistical parameters of all variables analyzed are given in Table 1. These statistical parameters as mean, variance, coefficient of variation, minimum value, maximum value, skewness, and kurtosis were obtained in order to verify the existence of a central tendency and dispersion of the data. According to Carvalho et al. (2000), in a data set that approaches the normal distribution, the values for skewness and kurtosis coefficients will approach zero. These values together with the other classical statistical parameters are useful for evaluating the magnitude of data dispersion around a central tendency value. For most of the variables studied there was a normal distribution, as indicated by the coefficients of skewness and kurtosis close to zero, with the exception of pH, O.M., P and K.
Descriptive statistics for soil attributes and lime and fertilizer recommendations of a CLFIS in São Carlos – SP, Brazil

CV: coefficient of variation equals standard deviation (σ) divided by sample mean (μ).
Soil pH and clay represented soil properties with low variability with a coefficient of variation below 10%. Soil organic carbon, CEC and basis saturation represented soil properties with medium variability (CV < 30%). Soil K was the soil property with the highest variability. According to Kravchenko (2003), the level of data variability is of importance in PA management, since soil properties with high variability are potentially better candidates to be managed on a site-specific basis than the more uniformly distributed soil properties. On the other hand, the mapping of soil properties with higher variability can be less accurate than that of soil properties with lower variability. Trends in the variation of soil attributes obtained in this study are consistent with those observed by Bernardi et al. (2014 and 2016) for the same soil parameters.
The lime recommendation data had shown a pure nugget effect which indicates a weak spatial dependence due the large variability. Experimental semivariograms for P and K fertilizer requirements were computed and all fitted models were bounded (Table 2). Results showed that the full extent of the variation of P and K fertilizer have been encountered at the spatial scale of this study. Table 1 indicates that the spherical and exponential models were, respectively, the best adjustment to experimental variograms of P and K fertilizer.
Parameters for semivariograms models for and lime and fertilizer recommendation of a CLIFS in São Carlos – SP, Brazil

The parameters are ‘Co‘ the nugget variance, ‘C’ the sill of the auto correlated variance; ‘a’ the range of the spatial dependence.
The ratio of nugget to total semi-variance can be used as a criterion for classifying the spatial dependence of variables (Cambardella et al., Reference Cambardella, Moorman, Novak, Parkin, Karlen, Turco and Konopka1994). P and K fertilization had strong spatial dependence (<25%). These results may support the decision-making practices of fertilization, successfully correcting nutrient availability. Bernardi et al. (Reference Bernardi, Bettiol, Ferreira, Santos, Rabello and Inamasu2016) also established site-specific nutrient fertilizer maps based on soil nutrient availability of pasture systems.
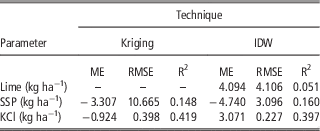
The summary of interpolation accuracy is presented in Table 3. The lower values of ME and RMSE suggest that the predictions are relatively unbiased (Robinson and Metternicht, Reference Robinson and Metternicht2006) as observed for KCl, but not for lime and SSP.
Summary of interpolator accuracy by mean error (ME), root mean squared error (RMSE), and coefficient of determination (R2).

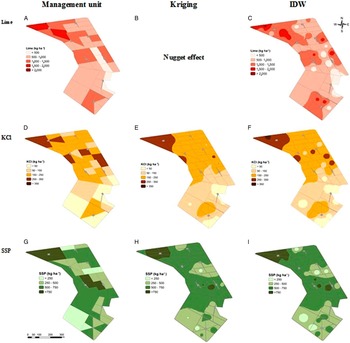
The diverse management systems had no significant effect on the effectiveness of identifying lime and fertilizer needs or mapping. Map interpolation can be performed by several techniques or methods (Robinson and Metternicht, Reference Robinson and Metternicht2006). These mechanistic or probabilistic techniques create surfaces maps from predicted values and errors. The kriging method estimates unknown values using semivariograms, which are the models of data variation as a function of distance between then. IDW method differs from kriging because it attributes proportional weights to distance, regardless of how far the variations in distances influence the behavior of the data. Figure 1 illustrates the differences between both interpolation methods and the recommendation based on paddock as management unit. Kriging is based on the observation of spatial dependence, and it was not possible to generate the kriging map for the lime recommendation. In most cases of the use of PA tools in the field, IDW is the method that has been most used (Robinson and Metternicht, Reference Robinson and Metternicht2006). However, IDW interpolates, even if there is no spatial dependence, so it can generate maps that do not translate the reality of the field.
Maps of lime (A, B and C), KCl (D, E and F) and super single phosphate – SSP (G, H and I) recommendations established by management units, kriging and IDW in a CLFIS in São Carlos – SP, Brazil.

Conclusion
The results showed that geostatistics and GIS were useful tools for revealing soil spatial variability and supporting management strategies. Soil nutrients were used to classify the soil spatial distribution map and design site-specific lime and fertilizer application maps. Spatial analyses of needs can provide management tools for avoiding potential environmental problems, like soil degradation or pollution, caused by unbalanced nutrient supplies.
Acknowledgements
To International Potash Institute - IPI, for the financial support for this research.