Introduction
The point at which the capitalist economy was initiated in Korea is hotly debated. It also remains controversial whether Korean capitalism was autogenous or transplanted from outside (Yang, Reference Yang2004). Some researchers (e.g. Kim, Reference Kim2006; Kim & Park, Reference Kim and Park2008) contend that the Japanese occupation of Korea in 1910–1945 constituted a crucial period in the making of the modern Korean economy, initiating economic take-off. However, others (e.g. Odaka, Reference Odaka1975; Cha & Lee, Reference Cha and Lee2007) stress the aspect of colonial exploitation and argue that the capitalist economy started after the colonial era. More recent evidence based on analyses of GDP (Kim, Reference Kim2006), population (Joo, Reference Joo and Rhee2006), real per capita wages (Cha & Lee, Reference Cha and Lee2007) and height (Choi & Schwekendiek, Reference Choi and Schwekendiek2009) have provided mixed results. To bridge this research gap, this study used anthropometric inequality to specify the points at which Korea experienced economic spurts during the colonial period.
The literature shows that income inequality has a pervasive influence on life. In modern economics, Kuznets (Reference Kuznets1955) first discussed the relationship between income inequality and economic growth; the inverted U-shaped relationship that he derived has since been dubbed the Kuznets curve. For example, Jha (Reference Jha1996) considered data for 61 countries between 1960 and 1992 and provided evidence for the Kuznets curve. Furthermore, Barro (Reference Barro2000) employed worldwide country-level data for the 1960s–1990s and concluded that the Kuznets curve is a clear empirical regularity. Barro (Reference Barro2008) later extended the dataset to the 2000s and confirmed this finding. Moreover, Lindert and Williamson (Reference Lindert and Williamson1983) and van Zanden (Reference Van Zanden1995) provided historical evidence of this. Hence, although not everyone agrees that the Kuznets curve exists (e.g. Deininger & Squire, Reference Deininger and Squire1998), Jha (Reference Jha1996) and Barro’s (Reference Barro2000, Reference Barro2008) data are comprehensive, and their results plausible.
Similarly, Easterlin (Reference Easterlin, David and Reder1974) showed a relationship between income inequality and happiness, finding that while happiness does not increase with income levels, the rich are happier at any single point in time. This paradox has since been termed the Easterlin paradox. Both the Kuznets curve and the Easterlin paradox have generated academic interest. In addition, income inequality is known to adversely affect the health of a population (Wilkinson & Pickett, Reference Wilkinson and Pickett2006). Furthermore, because income inequality is related to taxation, it is inevitably associated with many aspects of politics such as voting patterns and income redistribution.
Several measures are available to assess income inequality. The Gini coefficient is a typical measure; however, the income ratio of a single percentile to another percentile (e.g. 90/10, 50/10 and 90/50) can complement the Gini coefficient. One issue is that the income information used to estimate these measures is generally unavailable or of low quality for earlier time periods and developing countries, even in recent times. An alternative is to use height inequality. As height has increasingly been used to understand standards of living (Steckel, Reference Steckel2009), height inequality may explain income inequality. For example, Baten (Reference Baten2000) examined Bavarian conscripts born during 1815–1965; Quiroga and Coll (Reference Quiroga and Coll2000), Spanish conscripts born in 1893–1954; and Ayuda and Puche-Gil (Reference Ayuda and Puche-Gil2014), Valencian conscripts born during 1859–1967. Similarly, Komlos (Reference Komlos2007) employed the military conscription records of the Habsburg monarchy for those born during 1848–1889. Meisel and Vega (Reference Meisel and Vega2007) used the height information in the national identification cards of Colombians born during 1905–1985 and in the passport records of Colombians born during 1870–1919. In addition, Guntupalli and Baten (Reference Guntupalli and Baten2006) considered Indians born in 1915–1944; Moradi and Baten (Reference Moradi and Baten2005) extended the inequality database for sub-Saharan Africa to 28 countries for 1950–1980, with van Zanden et al. (Reference Van Zanden, Baten, Foldvari and van Leeuwen2014) developing this further by providing a global picture of the development of world inequality between 1820 and 2000.
To build on these findings, this study estimated height inequality in Korea in the birth decades around Japan’s colonization of Korea in 1910. The year 1910 is an extraordinary year for scholars because the Joseon Dynasty, also known as the Yi Dynasty (1392–1910), was forcibly annexed by the Japanese Empire in 1910. Japan tried to transplant industrial capitalism into a feudal agrarian society for permanent colonial rule on the Korean Peninsula. This colonial system was ended when US and Soviet forces occupied the Korean Peninsula after World War II. After Korea regained independence, it split into two regimes, one adopting a private sector-driven market system and the other a planned economy. From the 60s to the 90s, Korea has achieved phenomenal economic development. The year 1910 is a critical time for economic historians and other social scientists trying to examine the impact of Japanese colonialism in Korea. Scholars (e.g. Kim & Park, Reference Kim and Park2008) who have argued that Japanese colonialism contributed to the modernization of Korea have put more emphasis on economic development after 1910. On the other hand, other scholars (e.g. Cha & Lee, Reference Cha and Lee2007), who focused on the negative side of colonialism have argued that Korea suffered from famine due to over-taxation of the colonized economy and over-drafting during World War II. These scholars thus took the year 1910 as the starting point of colonial slavery by Japanese imperialism.
As explained in the next section, investigations of income inequality during this period are scarce. If height inequality started to increase at a certain point in time, it can be inferred that economic growth took place around that period. In this exercise, the focal period is important, because it allows the debate between econometricians and nationalist historians over the role of Japanese colonization in Korean economic growth to be joined. The former has argued that economic growth took place during the colonial period and that colonization greatly contributed to this. On the other hand, the latter has denied both, asserting that the Joseon Dynasty would have seen economic growth even without colonization and that colonization hindered the growth process (Rhee, Reference Rhee2014).
This study used height information collected from Korean prison records to estimate a coefficient of variation of height (henceforth, the CV) for the birth years 1890–1919. Unlike other prison data, the prisoners in the presented dataset were not limited to those of low socioeconomic backgrounds; their birth regions also varied greatly.
No research on income inequality in colonial Korea in the spirit of the Gini coefficient has been conducted thus far. Existing studies most closely approximating those on income inequality concern the skill premium – that is, the wage ratio of skilled to unskilled workers. However, it is worth highlighting that the skill premium does not always move in a similar way to income inequality. For example, Piketty (Reference Piketty2003, footnote 43) reported a long-term decrease in the ratio of the mean wage of managers to that of production workers in France, even when wage inequality remained constant.
With this critical caveat, the Statistical Yearbook of the Government of Colonial Korea (henceforth, Yearbook) provides the most comprehensive information on wages for 1906–1943. Thus, most research on the skill premium has analysed the Yearbook (e.g. Huh, Reference Huh1981; Lee & Cha, Reference Lee and Cha2007; Kim & Park, Reference Kim and Park2010). Despite its comprehensiveness, the data have important limitations. The level of observation in the Yearbook is not in terms of individuals but that of cities, which makes it difficult to estimate Gini coefficients from the data. In addition, the Yearbook contains yearly mean wages by occupation, with the target group being prime-aged workers with mid-level skills. Therefore, the skill premium estimated from this source is probably biased downward. Furthermore, it covers only 24 cities during 1906–1925, and even worse, eight cities during 1926–1943. Naturally, workers in rural areas are excluded; this is unfortunate, as they comprised the absolute majority of workers in colonial Korea. According to the 1930 census, for example, 7.65 million workers were engaged in the agricultural industry; however, the workers in all occupations specified in the Yearbook, and across all surveyed cities, numbered only 0.41 million (Kim & Park, Reference Kim and Park2010).
Furthermore, the number of occupations covered in the Yearbook varies, but is obviously small (e.g. 50 in 1918, 39 in 1926 and 37 in 1934). To make matters more complicated, wages are reported in daily, monthly or yearly terms and meals are separately considered for some occupations and not for others. Moreover, many cells are left blank, particularly in 1906–1925, when there are more cells to fill in than in later periods. For example, Lee and Cha (Reference Lee and Cha2007) examined wages in 51 occupations within 25 cities during a 33-year period, by ethnicity (i.e. Korean and Japanese). Had all the cells been filled, they would have seen 84,150 (=51×25×33×2) observations, but they found only slightly more than 30,000 valid observations.
Because the Yearbook provides such incomplete information on wages, those researchers who have used its data have been selective, making heroic assumptions to estimate the skill premium. For example, Huh (Reference Huh1981) selected only (not specified) cities and occupations that provided a long-term series; this probably caused severe selection bias. Lee and Cha (Reference Lee and Cha2007) and Kim and Park (Reference Kim and Park2010) tried to address this concern by analysing all wage information in the Yearbook. However, they weighted wages in each occupation in all years by the number of workers in a single year (i.e. 1930). Such a strategy is understandable when one faces data limitations; however, it is not accurate when there are many signs of economic and population growth during the period.
Some studies have employed micro data, but these datasets have comprised special groups. Consequently, it may not be convincing to infer from these groups the income inequality among the entire population. As a recent example, Kim (Reference Kim2013) drew on income tax statistics to estimate income inequality for 1933–1940; however, the information was available only for individuals whose incomes exceeded the income tax thresholds. To be specific, he showed that their proportion among individuals aged 20+ years grew from 1.39% in 1933 to 3.05% in 1940. Cha et al. (Reference Cha, Hwang and Lee2014) employed the personnel records left by the Development Bank of Colonial Korea to estimate the educational wage gap for 1922–1944. While the information is interesting, educational wage gaps are not meaningful when 65% of men and 93% of women aged 15–64 did not attend school in 1944. In addition, it is difficult to understand income inequality within the general population solely by observing the educational wage gaps of the personnel working at a single bank. Furthermore, regardless of the data, none of the studies has sufficiently covered the years around colonization.
The present study attempted to circumvent all these complications by using height inequality. Height is comparable across time and space and, as explained in the next section, the data comprised a wide range of both dimensions. These data are not proposed to be better than other data; analysis based on different data and methods could shed complementary light on income inequality for the years around colonization.
Methods
Data
The main dataset was based on the Seodaemun Prison register, which was published in a photoprint edition of historical materials for the Korean independence movement. Choi and Schwekendiek (Reference Choi and Schwekendiek2009) have already explained and explored the dataset in detail. Thus, it is only briefly described here.
The name of the register points to several important characteristics within the dataset. It concerns prisoners (prison register), but they were not typical criminals from lower socioeconomic strata. The data relate to all inmates arrested for protesting against Japanese occupation (the ‘History of the Korean Independence Movement’). Since Japanese officials followed rules to arrest as many Koreans as possible for protesting against Japanese occupation, they were unlikely to have selectively arrested suspects, which otherwise would have led to bias in the CV trend. The location of the prison (Seodaemun) is also important because it was a national prison located in Seoul (the centre of the Korean Peninsula) throughout the colonial period. Therefore, its inmates came from all regions of the country and represented a wide range of socioeconomic backgrounds. This group, therefore, reflects national trends better than would those from a narrow range of social strata or geographic locations; in particular, Blum and Baten (Reference Blum and Baten2011) warned against using such samples to analyse height inequality. In this sense, this dataset is more suitable than that of Kim and Park (Reference Kim and Park2011) for a similar period. Their dataset concerned dead persons for whom there were no acquaintances to claim their body (referred to as the ‘Hangryu deceased’). As they admitted, most of these individuals belonged to the lowest strata of society and died for poverty-related reasons. Therefore, the dataset used in this study is the only one presently available that contains height information on a sufficient number of individuals from a wide range of geographical locations and socioeconomic backgrounds for the period around colonization.
Furthermore, as height was measured, bias stemming from self-reporting was not an issue. Following Choi and Schwekendiek (Reference Choi and Schwekendiek2009), the sample was restricted to those aged 20–40 years with valid height and birth year data. This age range accounts for the majority of the sample. At the same time, it addresses several concerns that stem from those who are young, old, growing or shrinking. Those who are young or old may cause survival bias. Those who are growing may bias height inequality upward, while those who are shrinking, downward. Once the data were restricted, and observations with missing information excluded, the sample size was 1796.
One alternative approach could be a subgroup analysis. Albeit interesting, the goal of this study was to examine the nationwide trend in height inequality. Thus, the whole group analysis was more consistent with this goal. In addition, the sample size was not sufficiently large for subgroup analysis. Note also that this study regressed height on some covariates and estimated the residual. It then divided the standard deviation (SD) of the residual by its mean. However, the main point of the CV was to consider the variation in the height of a certain representative group – with no control. Any alternative way would have violated this point, because it would have removed the effects of the covariates on height, thereby making it difficult to understand what the statistic derived from the residual represents. In any case, the mean was zero by construction; thereby, this was infeasible. For these reasons, no study using the CV has employed this alternative way.
Analysis
Anthropologists utilize the standard deviations (SD) or CVs of human height to measure income inequality. The main idea is that although genetic factors mainly account for height distribution, there is sufficient room for environmental factors to perturb the actual distribution from the normal distribution (i.e. the normal distribution is expected when the genetic potential of every individual is fulfilled).
The SD of height can thus serve as a measure of height inequality, but biological variance rises with an average height (Schmitt & Harrison, Reference Schmitt and Harrison1988). Thus, it is necessary to minimize the effect of differences between samples in mean height when comparing differences in the variability of height (Bogin, Reference Bogin1991). Thus, it is necessary to normalize the SD of height with the mean height, which is the CV. Specifically, the CV is defined as:
 $${\rm{CV}} = {{\sigma}\over{\mu }} \times 100$$
where σ refers to the SD of height and μ to the mean height (Baten, 2000). In other words, CVs in the present research were based on SD, which was divided by mean of height.
When both income and height inequality indicators exist, the performance of height inequality can be investigated as a measurement for income inequality. However, a one-to-one correspondence between them should not be expected, as height reflects not only monetary incomes but also unofficial incomes such as subsistence farming and black markets. Related to this, height inequality may be superior to income inequality, as height reflects the living conditions (in childhood) that income inequality cannot. Height inequality contains information on public health and social security measures, and it can overcome the question of how incomes are distributed within families. Furthermore, height inequality (or health inequality) is probably more important in its own right than income inequality (Pradhan et al., Reference Pradhan, Sahn and Younger2003).
Evidence indicates that height inequality corresponds reasonably to income inequality. Moradi and Baten (Reference Moradi and Baten2005) regressed the Gini coefficient of income on the CV (in addition to a constant, a dummy variable for Gabon, and some fixed effects) and found that a 0.1 increase in the CV was related to a 2.05 increase in the Gini coefficient. Subsequently, Blum and Baten (Reference Blum and Baten2011) used this formula to convert the CV into a value that they called a ‘height Gini’. They then regressed the skill premium on the height Gini and found them to be positively related. These pieces of evidence allow the CV to be used to understand income inequality and probably other factors as well.
When the CV is used, one should be aware that even a small change in it is meaningful, since most of the height variation is caused by natural variation. Therefore, the CV typically fluctuates within a narrow range, even over a long period. For example, Baten (Reference Baten2000) documented a range of 3.63–3.83 for Bavarian conscripts born during 1815–1965 and Ayuda and Puche-Gil (Reference Ayuda and Puche-Gil2014), a range of 3.62–3.84 for Valencian male birth cohorts between 1880–1960. In addition, Blum (Reference Blum2014) reported that the SD of the CV for 124 populations was only 0.38.
Results
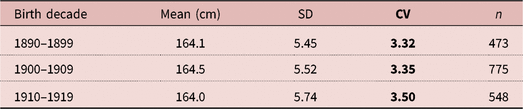
Table 1 shows the SD and CV statistics of the data. Among the three birth decades, the birth decade 1890–99 comprised the smallest sample size (N = 473). It was slightly smaller than the recommended minimum size of 500 (Jörg Baten, personal communication), but close to it. Overall, the mean height stagnated at around 164 cm over the birth decades; this value was the same as that of Choi and Schwekendiek (Reference Choi and Schwekendiek2009). More importantly, the figure was higher than that of the Hangryu deceased, which increased from 158.4 cm for those born in the 1880s to only 160.2 cm for those born in the 1910s (Kim & Park, Reference Kim and Park2011). This relatively large height difference suggests that the present sample better represents common men. However, when the sample is compared with other populations, it is clear that it is short. For example, Blum and Baten (Reference Blum and Baten2012) recorded trans-global estimates of male height by country and birth decade for 1810–1989; the world mean height for the birth decade 1910–19 was 166.6 cm. In addition, the mean height of Finnish men born more than a century earlier (in the 1810s) was as high as 171.9 cm. The results of such comparisons are consistent with the low-income levels of colonial Koreans (Bolt & van Zanden, Reference Bolt and van Zanden2013) and imply that these data are plausible.
Coefficients of variation of height (CV) of men from Seodaemun Prison register, Korea, N = 1796

More interesting statistics are those involving the CV. The highest value was 3.50 for the birth decade 1910–19. This was smaller than both the mean CV for 124 populations (3.61) calculated by Blum (Reference Blum2014) and the ‘natural’ value (3.6) suggested by Baten (Reference Baten2000). Regarding the CV trend, it increased slightly, from 3.32 to 3.35, for the birth decades 1890–99 and 1900–09 and then jumped to 3.50 for the birth decade 1910–19. Compared with the small-range fluctuations of 3.63–3.83 for Bavarian conscripts over a 150-year period (Baten, Reference Baten2000), an increase of 0.15 over such a short time period is notable. Clearly, there was an abrupt increase in the CV between the birth decades 1900–09 and 1910–19. Thus, to the extent that height inequality implies income inequality, the trend was upward, first gradually but then rapidly.
Discussion
One could object, saying that the CV for those born before 1890 might be lower than that for the birth decade 1890–99. Thus, the upturn between the birth decades 1900–09 and 1910–19 is just one point in a long series of an upward trend in the CV. However, recall that even the CV for the birth decade 1910–19 was already lower than those for other populations in various periods. Thus, this objection is not likely to be correct. Furthermore, there is evidence supportive of the presented argument. Most notably, Huh (Reference Huh1981), Lee and Cha (Reference Lee and Cha2007) and Park and Kim (2010) used the same dataset (i.e. the Yearbook), but with different assumptions. The differences in their assumptions produced a variety of results, and this was the case for the skill premium. Huh’s (Reference Huh1981) trend clearly shows a dramatic increase around 1920. Albeit flatter than Huh’s, Lee and Cha’s trend is also upward around 1920. However, Park and Kim’s trend does not exhibit any clear direction around 1920. Given that the growth period of the birth decade 1910–19 is covered by 1910–1930, the timing of the increase in height inequality corresponds to that in skill premium in major cities in Korea, as estimated by two of these three studies. However, caution is required because income inequality and skill premium do not always move together. Nevertheless, this finding suggests that the increase in wage inequality was not limited to wage earners in a small number of cities, but rather, may have been pervasive nationally.
More evidence suggests that the upward trend in inequality is plausible. Recall that the Kuznets curve is an empirical regularity (without the causality implied for this study). Thus, some signs of economic growth over time are expected. For instance, factory labour productivity in colonial Korea started to pick up in earnest in the 1920s and increased until the 1940s (Kim & Park, Reference Kim and Park2008). The trend in GDP per capita for 1911–1943, as estimated by Cha and Kim (Reference Cha and Kim2012), was also upward with little interruption, suggesting that economic growth took place during this period. At this point, one could object that the proposed argument regarding the beginning of industrialization is inconsistent with the stagnant trend in height. As the famous Antebellum Puzzle demonstrates (Komlos, Reference Komlos1996), the beginning of industrialization does not need to coincide with an increase in height; height can decrease during the period.
The trend in height inequality and signs of economic growth provides further evidence supporting cliometricians in their heated debate with nationalist historians; the presented evidence does not apply to the entire colonial period, but it is relevant to the early period (Rhee, Reference Rhee2014). Because the earliest year for the skill premium traces back only to 1906, these studies of the skill premium could not elucidate a period of some length before colonization. As a result, they could not appropriately respond to nationalist historians’ counterfactual assertion that Japanese rule was bad for Korea’s economic growth. However, these data, which started with the birth decade 1890–99, can help us respond to this assertion. If the assertion were correct, some signs of an increase in height inequality would be apparent, as the Kuznets curve dictates. However, the CV was already low for inmates who were born in the birth decade 1890–99 and grew during 1890–1910 (i.e. before colonization). The figure increased slightly for inmates who were born in the birth decade 1900–09 and grew between 1900–1920 (i.e. those who partially experienced colonization). Finally, the figure increased rapidly for inmates who were born in the birth decade 1910–19 and grew during 1910–1930 (i.e. those who fully experienced colonization). This trend suggests that the econometricians’ argument is more convincing. Other data sources can be used for the robustness of the results. The CVs from the height data in the Jeonju elementary school and the Korea Medical Insurance Corporation show a similar increasing pattern during the 1910s to 1930s (detailed results available upon request).
Concluding remarks
This study analysed prison records to estimate height inequality for Koreans born between 1890 and 1919. The main finding is that height inequality gradually increased from 3.32 to 3.35 and then jumped to 3.50. To the extent that height inequality is related to income inequality, the finding suggests that income inequality increased notably for those born during 1910–1919, compared with those born earlier. Some studies of the skill premium agree with this trend. Moreover, the empirical regularity in the Kuznets curve implies that the increase in height inequality is a sign of economic growth. This inference supports the argument that primitive economic take-off might have taken place during the early colonial period. Furthermore, this debate between cliometricians and nationalist historians does not concern only the Korean context. It needs to be understood within the context of the large body of the literature on the role of colonization in economic growth in later periods (Acemoglu & Robinson, Reference Acemoglu and Robinson2012). Thus, this study is relevant to other ex-colonies.
The driving force for height inequality may have also been associated with economic growth, namely, it ultimately drove both height inequality and economic growth. Acemoglu and Robinson’s (Reference Acemoglu and Robinson2012) idea helps in this regard. They stressed the role of ‘good’ institutions in economic growth for settler colonies. Korea was clearly a settler colony (Duus, Reference Duus1995). The promotion of migration to Korea had become an unquestioned policy by the time of the Russo–Japanese War, and in the autumn of 1908 Imperial Japan adopted an overseas migration policy in Korea and Manchuria. Furthermore, it distinguished between colonists (shokumin) and emigrants (imin); the former were considered to be those who went abroad to reclaim the wasteland with the intention that their heirs would live there permanently; the latter were considered to be those who moved away from their homeland and provided their labours to powerful capitalists. It was the former that the Japanese government wanted to migrate to Korea.
At the same time, the Japanese government tried to (often forcibly) introduce modern institutions to the Joseon Dynasty, even before formal colonization. Policies of the Joseon Dynasty were not conducive to market development. Whether intended or not, they instead hindered market development (Rhee, Reference Rhee2014). For example, the dynasty prohibited private international trade and the trade of luxury goods. The Joseon Dynasty also strictly controlled the supply of money, so brass coins were mainly minted and media for high-value trading (e.g. gold and silver coins) were not minted at all. The Joseon Dynasty also encouraged paying tax in kind. The bulkiness of the Korean currency and the collection of taxes in kind retarded monetization. Thus, even at the two great national fairs in Taegu and Kongju in February and August, most buying and selling was performed by barter. However, immediately before colonization, the Japanese government exerted pressure on the Joseon Dynasty to introduce modern institutions. The collection in 1895 of taxes in money, instead of in kind, is a good example. Upon colonization, the colonial government accelerated the process (Kim, Reference Kim2003). Tariffs between Japan and Korea were abolished for most goods. As a result, the two markets were integrated, and trade between Japan and Korea rapidly grew, facilitated by the rapid expansion of infrastructure. Japanese capital also flowed into Korea. In addition, Japanese money replaced old Korean money and its circulation increased. Furthermore, a national land survey was completed by 1918, providing reliable nationwide figures on a cultivated land area or land ownership; property rights to land were also firmly established. Consequently, the land tax system was overhauled and arbitrary taxation eliminated. Under Japanese rule, Japanese laws and regulations on economic activities were applied to Koreans. These institutional changes created new opportunities and attracted many Japanese to the peninsula. By 1910, Korea was unambiguously the leading destination for Japanese migration: of the 449,227 Japanese residents overseas, 171,543 (38.2%) resided in Korea, followed by those in Taiwan (98,048, or 21.8%); in 1920, of the 1,116,639 Japanese residents overseas, 347,850 (31.2%) resided in Korea, followed by those in Taiwan (166,621 or 14.9%) (Duus, Reference Duus1995).
As with all studies, this study has a number of limitations. First, studies of individual heights of convicts often suffer severe sample bias because they over-represent specific classes of persons, and lack detailed information on socioeconomic conditions. The limitation of using height as the measure for net cumulative health is also recognized. The literature indicate that the sensitivity of height growth to nutrition or illness depends on the age at which they occur. Early childhood is particularly sensitive to environmental conditions (Steckel, Reference Steckel1983). Therefore, the final level of height reflects more on the health condition in the childhood period. Second, the linear relationship between stature and income (or income inequality) is controversial. For instance, recent research shows a Korean height trend in inverse U-shape, with its peak around the mid-1920s, which suggests that the Korean standard of living improved up to the mid-1920s before proceeding to stagnate (Choi & Schwekendiek, Reference Choi and Schwekendiek2009). It would be interesting for future studies to investigate height inequality with multiple sources with detailed information on socioeconomic background.
Last, but certainly not least, caution should be exercised when interpreting these results beyond the domain of inequality. The Japanese government did not promote institutional development in Korea in order to enhance Koreans’ welfare or jumpstart Korea’s economic growth. Instead, Japan might have intended to permanently consolidate its colonial and forced rule on the basis of its economic institutions. Hence, while the present study found evidence of initial economic spurts during the early colonial era, the findings cannot rule out the contradictory and negative nature of colonial industrialization. Therefore, this study should not be exploited to support colonialism, just as Robert Fogel’s controversial research about the profitability of US slavery should not be abused to advocate the slavery system.
Acknowledgments
The author is gratefully indebted to an anonymous reviewer for constructive criticism and valuable comments which improved the study markedly.
Funding
This work was supported by the research fund of Hanyang University (HY-2018).
Conflicts of Interest
The author has no conflicts of interest to declare.
Ethical Approval
The author asserts that all procedures contributing to this work comply with the ethical standards of the relevant national and institutional committees on human experimentation and with the Helsinki Declaration of 1975, as revised in 2008.