Introduction
Background
Our understanding of macroevolution and the accuracy of our phylogenies are only as good as our evolutionary models. Because it is tautological to use only phylogenetic results to make predictions about these models, other approaches to the reconstruction of macroevolutionary history are not only useful but necessary to improve the accuracy of our analyses.
Prominent among such approaches is the quantification of morphology over time. While geometric morphometrics has proven a powerful tool to analyze the evolution of shape variations in lower-rank taxa—usually families or below (e.g., Foote Reference Foote1989; Rohlf Reference Rohlf1998; Eble Reference Eble2000; Webster and Zelditch Reference Webster and Zelditch2011; Hopkins Reference Hopkins2017)—multivariate treatments of discrete character matrices become more informative or even inevitable when dealing with large selections of higher taxa with myriads of homologous and nonhomologous structures (e.g., Foote Reference Foote1994, Reference Foote1997; Wills et al. Reference Wills, Briggs and Fortey1994; Ciampaglio et al. Reference Ciampaglio, Kemp and McShea2001; Erwin Reference Erwin2007; Webster Reference Webster2007; Brusatte et al. Reference Brusatte, Graeme, Wang and Norell2014; Hopkins and Smith Reference Hopkins and Smith2015).
With their unmatched diversity and abundance both in the present and in the past and their serial type of body organization, arthropods constitute model organisms for such quantitative evolutionary analyses. Twenty-eight years ago, Briggs et al. (Reference Briggs, Fortey and Wills1992) produced a “phylomorphospace” of euarthropod taxa, with the objective of evaluating the asymmetry of body plan assembly in the macroevolutionary history of this group, in particular between Cambrian and extant forms. It was widely acknowledged that fossils of the Cambrian explosion characterized the sudden emergence of metazoan phyla along with a wealth of extinct forms sister to higher-level taxonomic ranks (Valentine Reference Valentine1973, Reference Valentine2004; Erwin et al. Reference Erwin, Valentine and Jablonski1997), which is why Briggs et al. (Reference Briggs, Fortey and Wills1992) were in particular responding to Gould (Reference Gould1989, Reference Gould1991), who had recommended the use of phenetic approaches in addition to cladistics to obtain the extra dimensions necessary to apprehend the breadth of morphological diversity (disparity) during the Cambrian. Although the results were first interpreted as a refutation of the claims that early euarthropod evolution reflected a radiative event as morphologically dramatic as Gould claimed (Wills et al. Reference Wills, Briggs and Fortey1994), Briggs and Fortey (Reference Briggs and Fortey2005) later conceded that their data, showing an early realization of the total euarthropod morphospace by the end of the Cambrian, suggested at least unusually fast evolutionary rates.
Lee et al. (Reference Lee, Soubrier and Edgecombe2013) found evidence for comparably high rates of evolution at the origins of extant euarthropods using both molecular and morphological data. The immediate question raised by these results, in light of the research history of the group, was that of the significance of fossils with respect to these fast-evolving branches—and more precisely, whether morphological patterns in Cambrian fossils can explain these high rates, for instance, by displaying greater disparity metrics. Owing to the radical changes in our understanding of early arthropod relationships since the data of Briggs et al. (Reference Briggs, Fortey and Wills1992) and Wills et al. (Reference Wills, Briggs and Fortey1994), a new comparative analysis using more recent datasets seemed timely.
The question of the role of fossils in explaining changes in evolutionary rates, however, is nested within macroevolutionary considerations whose implications reach far beyond the sole Cambrian explosion (Eble Reference Eble2000; Hopkins and Smith Reference Hopkins and Smith2015). The following work therefore attempts to serve more generally as a case study with a quantitative approach to the origination and individualization of body plans in an animal phylum.
Evolutionary Implications of Disparity
Because of other recent advances integrating paleontology with other fields of evolutionary biology (Niklas Reference Niklas1994; Peterson et al. Reference Peterson, Dietrich and McPeek2009; Erwin et al. Reference Erwin, Laflamme, Tweedt, Sperling, Pisani and Peterson2011; Giribet and Edgecombe Reference Giribet and Edgecombe2019), a new disparity study would be incomplete without also updating the type of hypothesis tested.
Although ecological niche filling and developmental “entrenchment” have long been regarded as distinct causes for reduced post-Cambrian patterns of disparity (Marshall Reference Marshall2006), they more necessarily explain different aspects of the same phenomenon (Erwin Reference Erwin2007). It is now clear that genetic factors had to be involved as a prerequisite to niche occupation, simply because these niches are emergent and dependent upon morphological novelties (Peterson et al. Reference Peterson, Dietrich and McPeek2009). Canalization (Waddington Reference Waddington1942) is a fundamental concept in this context. In modern terms, this process corresponds to the increased buildup of genetic regulatory networks (GRNs; see, e.g., Davidson Reference Davidson2010), which leads to the increased robustness of the more central and “entrenched” genetic pathways of phenotypic expression. Recently, it has been posited that microRNAs (miRNAs) in particular could contribute to the stabilization of the genetic network and prevent indeed the expression of more deviant phenotypes (potentially innovative with but lower heritability and long-term fitness), but also facilitate species diversification by increasing the likelihood of trait variations being conserved, and therefore selected, throughout successive generations (de Visser et al. Reference de Visser, Hermisson, Wagner, Meyers, Bagheri-Chaichian, Blanchard, Chao, Cheverud, Elena, Fontana, Gibson, Hansen, Krakauer, Lewontin, Ofria, Rice, von Dassow, Wagner and Whitlock2003; Peterson et al. Reference Peterson, Dietrich and McPeek2009).
This has direct implications for disparity patterns, insofar as this process of canalization implies upstream- to downstream-based variability during the evolution of body plans. Phenetic estimates of disparity establish relative distances based on a hierarchy of characters, and upstream characters overall should have a larger structural impact on body plans, therefore leading to a wider occupation of morphospace by early members of a given lineage, in accordance with “early burst” models (Foote Reference Foote1993; Hughes et al. Reference Hughes, Gerber and Wills2013). Thus, for instance, it is expected that the multitude of secondary variations in color, hair shape, wing venations, and so on in insects accounts for less disparity than, say, tagmatization differences in crustaceans, arguably ancestral to the strong anatomical stabilization of the hexapod body plan. Accordingly, if the Cambrian “trial and error” taxonomic pattern is related to low canalization, some fossil groups should display broader and less uniform occupations of morphospace—providing the appropriate metrics are used.
Contrary to some earlier assumptions (e.g., Gould Reference Gould1989), however, this does not mean that the boundaries of the given morphospace did not expand beyond early extinct lineages, or that fossil lineages all have a priori the same characteristics of disparity. Each extinct group should be considered separately, because (1) its extinction is not necessarily caused by a lower fitness compared to extant lineages; and (2) canalization can be a more or less stepwise, more or less gradual adaptive process, following which there is no simple distinction between extinct and extant, but different gradients across all forms involved.
This issue is commonly conveyed by the notions of “stem” and “crown” groups (Jefferies Reference Jefferies and House1979; Budd and Jensen Reference Budd and Jensen2000). While some authors chose to assign macroevolutionary properties (such as having or not having a body plan) to all stem and crown lineages based on the sole property of being respectively extinct or extant (Budd and Jensen Reference Budd and Jensen2000; Budd and Mann Reference Budd and Mann2019), cladistic stem and crown groups are arguably different from “ontological” stem and crown groups (Aria Reference Aria2019). Although this distinction is first conceptual (description of the form vs. property of the content), it also follows from the simple observation that any lineage is subject to extinction independent of intrinsic limiting factors. That is not to say, of course, that stem lineages all intrinsically possessed the survival potential of crown groups—not all extinctions are entirely accidental either—but if we are to comprehend morphological change and the emergence of clades on large timescales, survivability (and evolvability) needs to be comparatively evaluated, ideally through the quantification of macroevolutionary patterns (e.g., Gould Reference Gould1989; Foote Reference Foote1997; Erwin Reference Erwin2007; Kemp Reference Kemp2007; Brusatte et al. Reference Brusatte, Graeme, Wang and Norell2014). There possibly exists some sort of threshold below which the canalization of a body plan is always insufficient for long-term fitness within a given adaptive landscape (Niklas Reference Niklas1994), but whether stem groups consistently meet this condition is an assessment that requires testing.
Arthropods are often said to have “modular” body plans, because their segments can be seen as repeated modules that are relatively easy to add, remove, or modify in comparison to other metameric organisms. Modularity can also be seen more generally in an evolutionary context through the linkage of genes and their phenotypic expression (Wagner Reference Wagner1996; Wagner et al. Reference Wagner, Pavlicev and Cheverud2007). Modularity, as a heterogeneous network where certain components (genes) have more interactions between themselves than with the remaining others, forms patterns of mosaic evolution (e.g., Cracraft Reference Cracraft1970; Barton and Harvey Reference Barton and Harvey2000), governing major macroevolutionary phenomena such as allometry and heterochrony. Whereas canalization is the process of regulation of genome expression by buffering phenotypic variability, modularity evolves through the integration of this buffered information into coherent and semi-independent evolutionary structures—both therefore partake of the evolution of GRNs. It has been well shown in trilobites, however, that segmental phenotypic patterns associable with both canalization and modularity retained a certain plasticity and could lead to similar solutions convergently in different lineages (Hughes Reference Hughes1991, Reference Hughes2003). This highlights the fact that this functional integration of the genome is not simply a linear betterment through time and that morphological variability itself is an important evolutionary aspect for paleobiologists to consider beyond the accumulation of isolated apomorphies. Mosaic evolution has also been associated with disparity patterns on large phylogenetic scales through character covariations (e.g., Gerber and Hopkins Reference Gerber and Hopkins2011) and should in fact be one of the most prominent signals detectable in morphospaces, given that axes are determined by suites of characters having similar effects on the phenotypic distribution of morphogroups. For all these reasons, it was fundamental to also include modularity as a central explanatory concept in this study.
Methods
To assess inclusive amounts of realized morphology—that is, morphology that can be traced back to a common ancestor—instead of estimations of fillings of the total morphospace at various time intervals, a phylogeny-based multivariate description of Euarthropoda was undertaken. Because dissimilarity matrices and hence morphospace reconstructions are sensitive to missing data (Lloyd Reference Lloyd2016; C.A. personal observation), even when using algorithms trying to minimize their impact (such as, here, the function daisy from the R package cluster), a fossil-inclusive matrix (Supplementary Dataset S1) was specifically compiled that limited the number of characters codable only in extant taxa, instead implementing this signal through “backbone” constraints on the tree topology (Aria and Caron Reference Aria and Caron2017a,Reference Aria and Caronb; Vannier et al. Reference Vannier, Aria, Taylor and Caron2018). This approach, however, may create biases (e.g., toward larger disparity metrics in fossils) that call for a comparison with a dataset in which internal, developmental, and other characters unknown in fossils are present. Considering that such a dataset may suffer from reciprocal biases, favoring the spread of extant taxa, this is not a calibration, and both datasets had to be judged on the relevance of their similarities and differences in light of plausible evolutionary scenarios. The extant dataset of Lee et al. (Reference Lee, Soubrier and Edgecombe2013) was chosen here, modified from Rota-Stabelli et al. (Reference Rota-Stabelli, Campbell, Brinkmann, Edgecombe, Longhorn, Peterson, Pisani, Philippe and Telford2011), because it is exhaustive in its account of characters, but also because it was published with a computation of both molecular and evolutionary rates along phylogenetic branches that was of interest for the reconstruction of macroevolutionary patterns. The only caveat is that the molecular analysis of Lee and colleagues was based on 62 coding genes, which provides only a small window on the functional arthropod genome; this must be kept in mind in regard to the interpretation of the molecular signal presented later. The fact, however, that both datasets considered here were coded independently (i.e., separately by different researchers) increases the chance that similar patterns stem from genuine macroevolutionary properties.
For the phylogenetic analysis of the fossil-inclusive dataset, the data (105 taxa, 268 characters) were run in Mr. Bayes v. 3.2.6 × 64 (Ronquist et al. Reference Ronquist, Teslenko, van der Mark, Ayres, Darling, Hohna, Larget, Liu, Suchard and Huelsenbeck2012) following an Mkv+Γ model (Lewis Reference Lewis2001), with burn-in at 20% and four runs with four chains for 10,000,000 generations. Topological constraints for extant taxa were used based on several morphological and molecular studies, including Rota-Stabelli et al. (Reference Rota-Stabelli, Campbell, Brinkmann, Edgecombe, Longhorn, Peterson, Pisani, Philippe and Telford2011), Regier et al. (Reference Regier, Shultz, Zwick, Hussey, Ball, Wetzer, Martin and Cunningham2010), Garwood et al. (Reference Garwood, Dunlop, Selden, Spencer, Atwood, Vo and Drakopoulos2016 and relevant literature by Schultz therein), Schwentner et al. (Reference Schwentner, Combosch, Nelson and Giribet2017), and Fernandez et al. (Reference Fernandez, Edgecombe and Giribet2016) (see Supplementary Dataset S1). Priapulida was used as the outgroup. Each taxon was coded based on a summary of the available morphological information.
Dissimilarity matrices from both datasets restricted to euarthropod taxa (Supplementary Dataset S2) were translated into coordinates within multidimensional spaces using principal coordinate analyses (PCoAs), from which phylomorphospaces and representations of hypervolumes were derived, following the general procedure of previous publications (Aria and Caron Reference Aria and Caron2015; Caron and Aria Reference Caron and Aria2017). In each case, only the first four dimensions were found to significantly explain the variance in the data based on a broken-stick model (Frontier Reference Frontier1976) (Supplementary Fig. 1A,B). Because they explain together 62.95% (fossil-inclusive dataset [FID]) and 75.81% (Lee et al. [2013] dataset or extant-only dataset [EOD]) of the total variance, only the first three dimensions of the PCoA are represented hereafter; however, the fourth dimension was systematically included in the various calculations of disparity. Restricting the analyses to significant axes avoids culling dimensions based on arbitrary eigenvalue thresholds (Wills et al. Reference Wills, Briggs and Fortey1994). Morphogroups were designated based on a synthesis of taxonomy, phylogenetic results, and k-means partitions (Supplementary Fig. 1C,D).
Infragroup disparity metrics were calculated based on sums of ranges and simulated hypervolumes (based on Gaussian distributions), which are more resilient to sample size than variance. Although data simulation was inherent to the calculation of hypervolumes and the conception of the R package hypervolumes, it was essential to this study, in that it allowed for the representation of a very large sample of related species (ca. 1000), which would have been unrealistic to achieve by coding them manually in the matrix. This is comparable, and arguably more powerful, than the jackknifing method used for sums of ranges.
Additionally, intergroup metrics were derived from hypervolume calculations in the form of intercentroid distances and reverse Sørensen overlap between multidimensional hulls (Sørensen Reference Sørensen1948). To evaluate the correlation between genetic and disparity patterns, rates of morphological and molecular evolution were gathered from Lee et al. (Reference Lee, Soubrier and Edgecombe2013), either as the sum of nonterminal branches within a morphogroup (for infragroup analyses) or as intermediate branch values (for intergroup analyses) (Supplementary Dataset S3).
All analyses were performed with the statistical freeware R v. 3.5.3 (R Core Team 2019) and its following non-base packages: alphahull, ape, cluster, hypervolume, knitr, phytools, RColorBrewer, rgl, rmarkdown, scatterplot3d, vcd, vegan, vioplot, and all their dependencies.
Additional details on the methodology are given in the Supplementary Material.
Results
Phylogeny
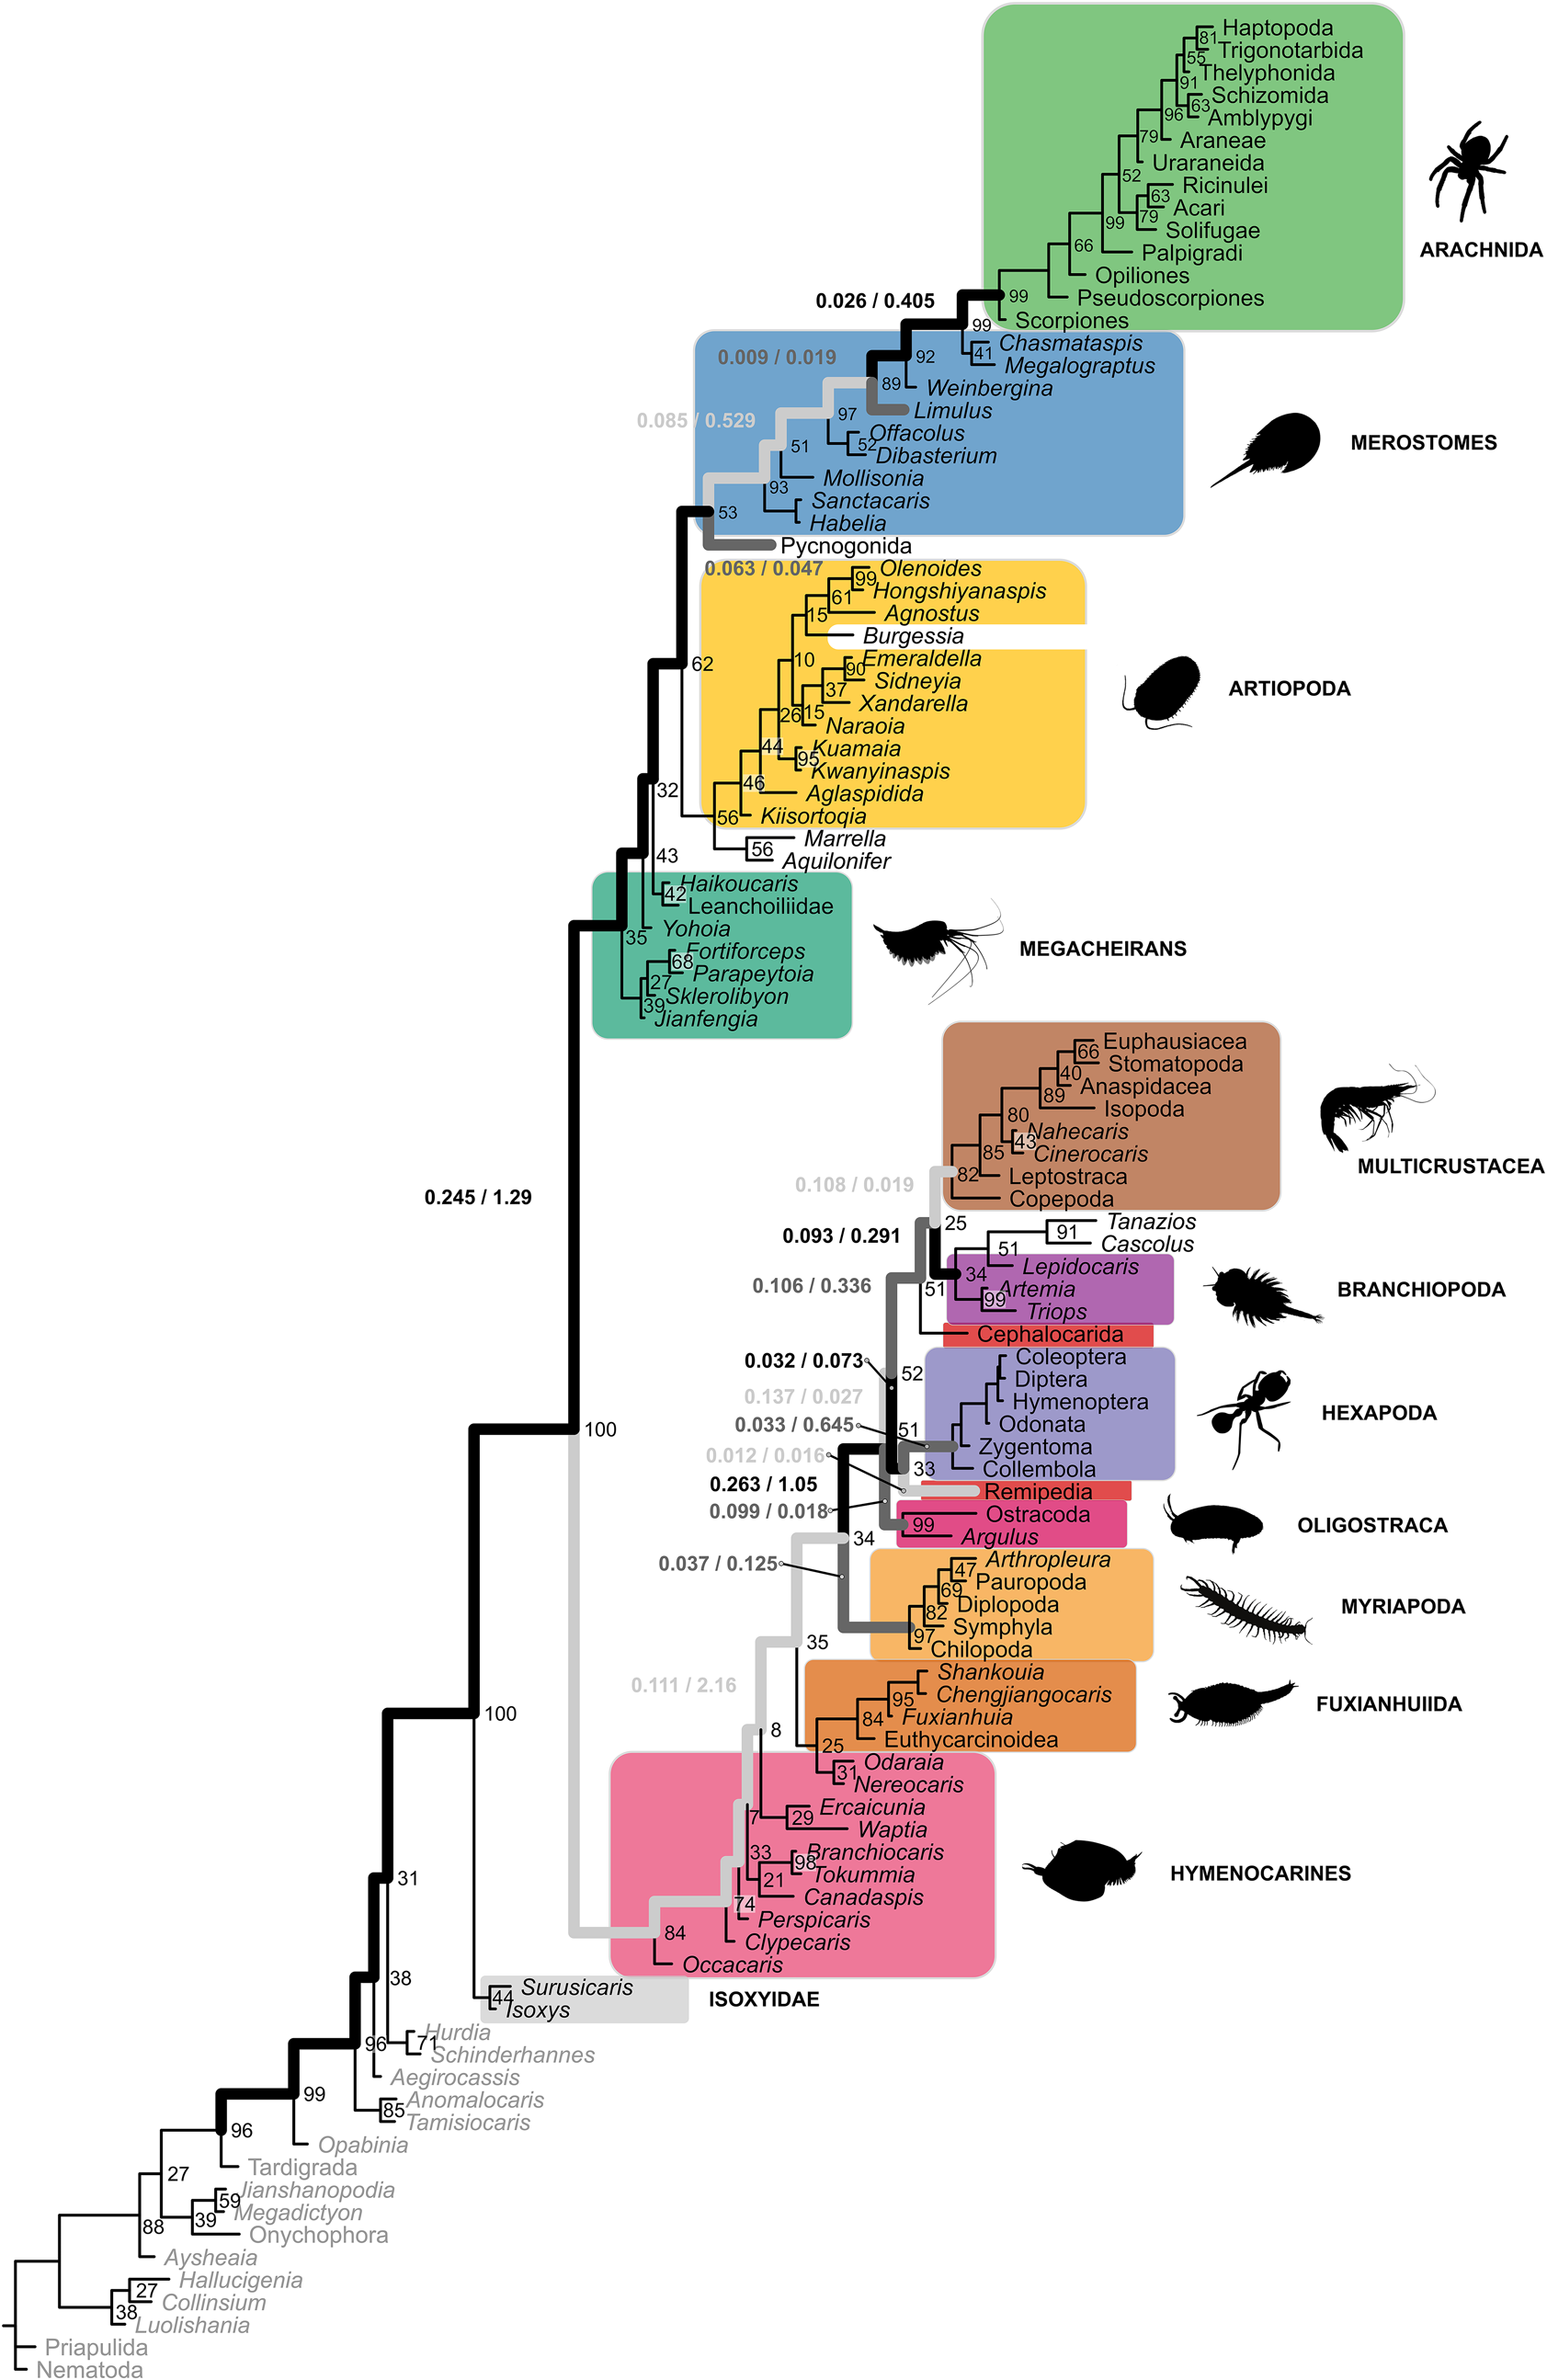
The phylogenetic topology obtained stands out by its deep splitting of total-group chelicerate and total-group mandibulate lineages (Fig. 1). Arachnomorpha is retrieved here similar to the results of Aria and Caron (Reference Aria and Caron2017b), but also forms a clade with the paraphyletic megacheirans. The total-group Mandibulata is also similar to the results of Aria and Caron (Reference Aria and Caron2017a), starting with Occacaris, and thus there is no taxon strictly representing the stem of Cenocondyla (sensu Aria Reference Aria2019) or Euarthropoda, which are here equivalent.
Phylogram of panarthropod relationships, as the maximum clade credibility tree obtained from a Bayesian analysis (Mkv+Γ model) of 105 taxa and 268 characters. Numbers on the right of nodes are posterior probabilities percentages; numbers on the left of bold branches are corresponding molecular (left) and morphological (right) rates from Lee et al. (Reference Lee, Soubrier and Edgecombe2013). Taxa not included in colored groups are considered “rogue” (i.e., with unstable phylogenetic positions) and were not taken into account in group-based analyses. Taxa in gray are non-euarthropods excluded from the analyses undertaken herein, with the exception of Isoxyidae (gray box), used as the reference outgroup. Color online.

Megacheirans, hymenocarines, and merostomes resolve as paraphyletic (Fig. 1), but their constitutive taxa remain identifiable by common body plans (Aria et al. Reference Aria, Caron and Gaines2015; Dunlop and Lamsdell Reference Dunlop and Lamsdell2016; Aria and Caron Reference Aria and Caron2017a), and it thus makes sense to analyze them as paraphyletic morphogroups. This is confirmed by their coherent clustering in morphospace (see “Morphospaces”).
Other morphogroups analyzed here are monophyletic, with the exception of xenocarids (cephalocarids and remipedes). The phylogenetic placement of these “plesiomorphic-looking” crustaceans has long been problematic. They are here retrieved as polyphyletic (Fig. 1), similar to recent phylogenomic and phylotranscriptomic studies (Oakley et al. Reference Oakley, Wolfe, Lindgren and Zaharoff2013; Schwentner et al. Reference Schwentner, Combosch, Nelson and Giribet2017), where they resolve as sister taxa to hexapods and branchiopods, but they were also found previously to form a clade (Regier et al. Reference Regier, Shultz, Zwick, Hussey, Ball, Wetzer, Martin and Cunningham2010). Because this study focuses on morphological breadth, these taxa are quantitatively analyzed together here (in the context of the purported Allotriocarida radiation), but support for their polyphyletic arrangement should be kept in mind in the interpretation of the following results.
Morphospaces
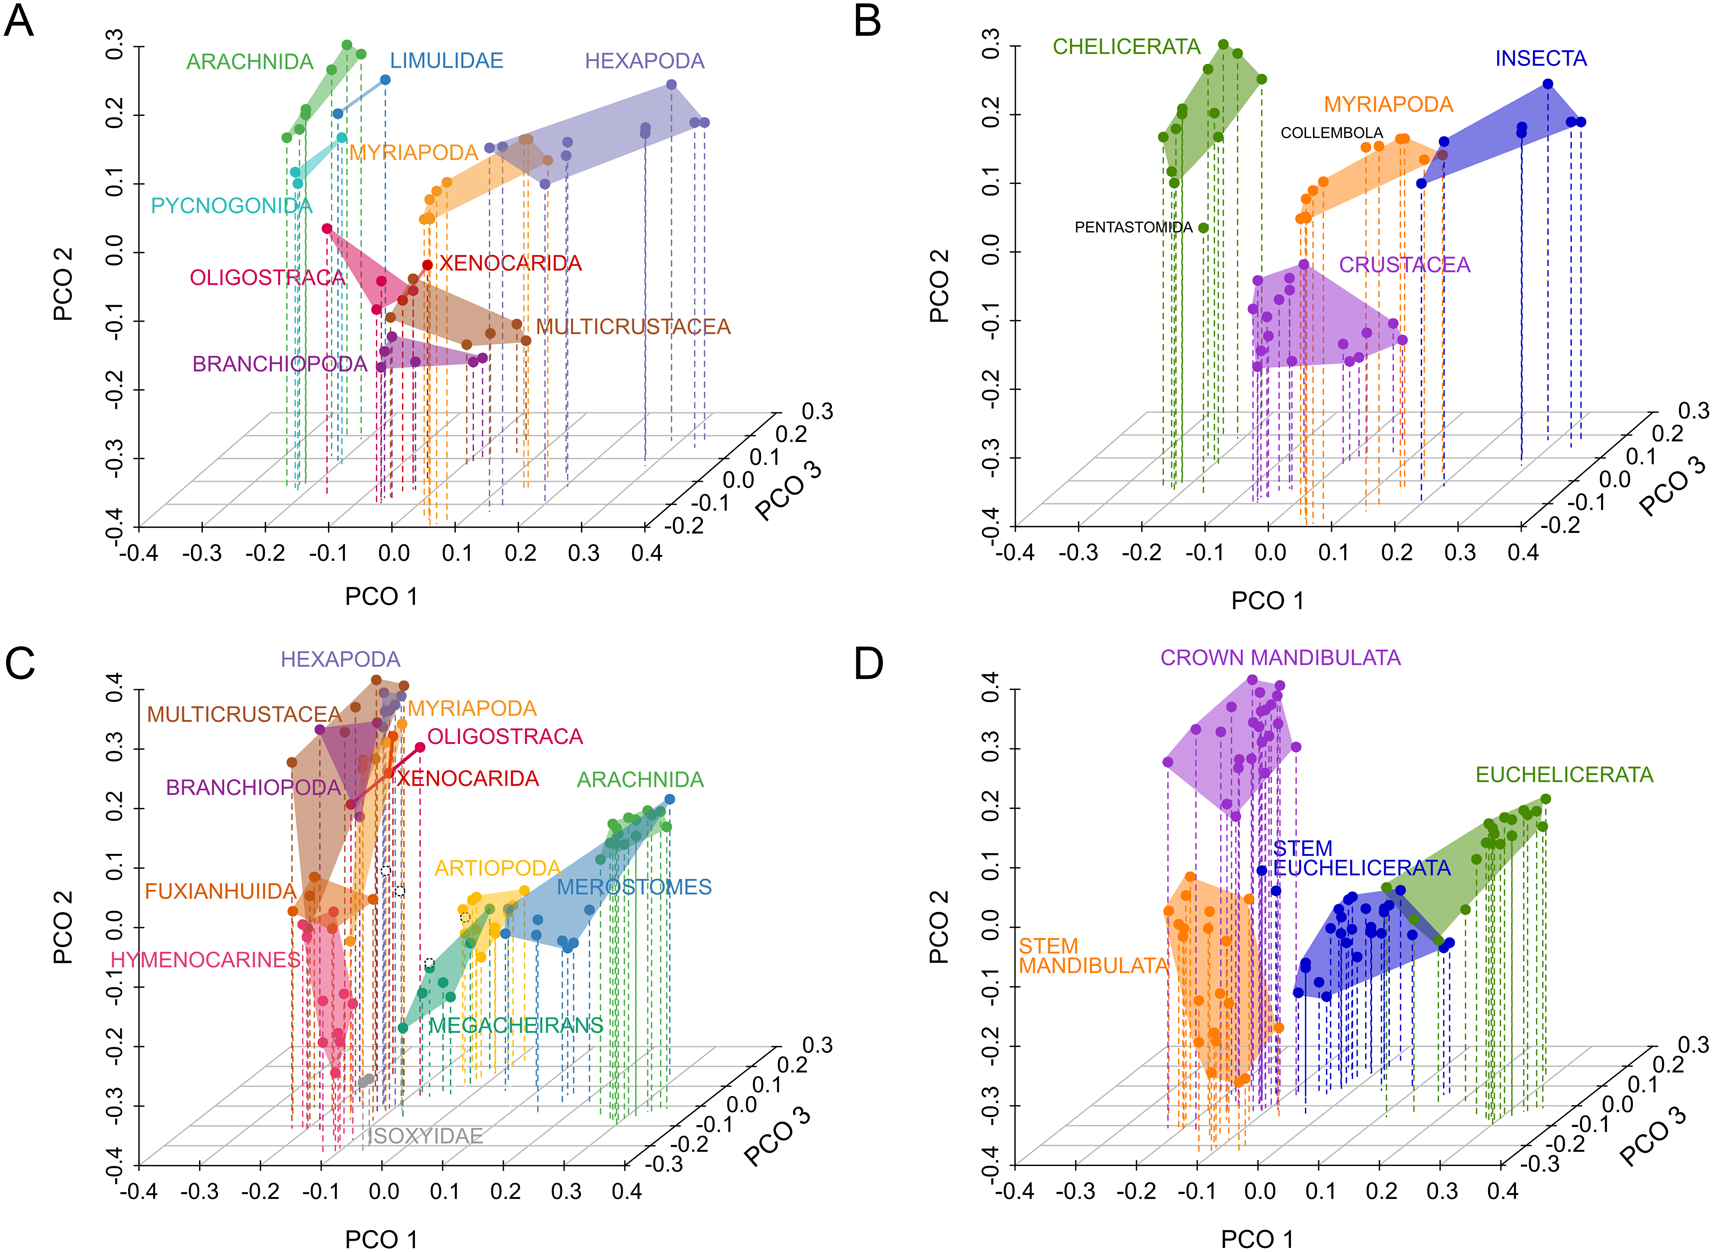
Both the EOD and FID resolve chelicerates and mandibulates in different regions of the three-dimensional morphospace (Fig. 2A,C). However, the FID more clearly resolves mandibulates as a coherent cluster than the EOD, in which an Atelocerata grouping (Myriapoda + Hexapoda) stands out within high values of axes 1 and 2. This configuration is likely the result of a strong ecological signal in the data, as shown by the position of Arachnida at the higher values of axis 2, although Limulidae and Pycnogonida are also resolved with these values, perhaps as a result of possessing uniramous walking legs. Considering the singularly strong convergence between insects and myriapods, the morphological data have in general always been in favor of Atelocerata (although not irremediably so; see Legg et al. Reference Legg, Sutton and Edgecombe2013). The EOD constitutes a particularly clear illustration of that fact.
Morphospaces of Euarthropoda represented as principal coordinate analyses (PCoAs). A,B, Extant-only data (EOD) from Lee et al. (Reference Lee, Soubrier and Edgecombe2013) (variance explained: PCO 1 = 32.10%, PCO 2 = 21.47%, PCO 3 = 14.56%). A,C, Colored groupings with α-hulls based on phylogenetic results (see Fig. 1). B,D, Colored groupings with α-hulls based on optimal k-means solutions. C,D, Fossil-inclusive data (FID) from this study (variance explained: PCO 1 = 28.43%, PCO 2 = 23.98%, PCO 3 = 10.53%). Only the first three dimensions (out of four significant) are shown.

In light of this, the FID more readily reflects the overall phylogenetic signal, representing mandibulates and chelicerates as the distal radiations of two distinct directional lineages composed of intermediate fossil groups: “total-group Mandibulata,” including fuxianhuiids and hymenocarines, and “total-group Arachnomorpha,” including an enlarged merostome group, artiopodans, and megacheirans. Nonetheless, a terrestrial/aquatic signal is also secondarily present in the FID and shared by axes 2 and 3, as shown by the position of hexapods, myriapods, and arachnids. This explains why the pool of characters for the FID produces a more homogeneous mandibulate cluster in morphospace but would still retrieve Atelocerata phylogenetically without topological constraints (result not shown). Intriguingly, the morphospace obtained with the EOD shows an almost dichotomic separation within atelocerate clusters along axis 3. Due to the high complexity of loadings (see Supplementary Dataset S4), it is difficult to identify which characters are responsible for this pattern.
The k-means partitions confirm the observed differences between the two datasets by identifying four significant clusters in the EOD representing the four “traditional” extant arthropod subphyla, namely Chelicerata, Myriapoda, Crustacea, and Insecta, with pentastomids and collembolans as outliers (Fig. 2B, Supplementary Fig. 1C). In the FID, on the other hand, the four significant groups recognized correspond almost exactly to both crown euarthropod lineages and their respective stem/basal fossil groups (Fig. 2D, Supplementary Fig. 1D).
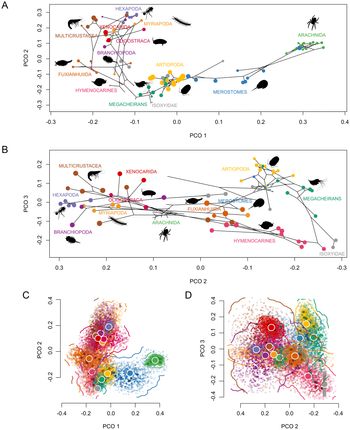
Phylomorphospaces of the FID highlight strong differences in patterns of morphospace occupation between morphogroups, and in particular “elongate” distributions of taxa in contrast to more uniform clusters (Fig. 3A,B). Among extinct morphogroups, megacheirans, merostomes, and hymenocarines all stand out as possessing stretched-out, directional morphospace occupations. Artiopodans, by contrast, show an organization similar to hexapods or arachnids, despite being an exclusively fossil group. The mandibulate cluster resolves as more complex than its chelicerate equivalent, with greater overlaps between morphogroups.
Strict and simulated occupations of the morphospace. A,B, Two-dimensional morphospace representations of the first three dimensions of the fossil-inclusive dataset (FID). C,D, Hypervolume simulations of the first three dimensions of the FID (solid dots are data points, transparent dots are random points drawn from a Gaussian kernel-density estimation, white-bordered disks are centroids, lines are contours from two-dimensional kernel-density estimation smoothing). Colors and icons as in Fig. 1.

Overall, simulated hypervolumes of the FID (Fig. 3C,D) yield morphospace patterns expected from the distribution of the original data, with notable exceptions. Although arachnids constitute a tight cluster on axes 1 and 2, they are stretched out on axis 3. The simulated hypervolume of branchiopods is also much larger than what is expected from their morphospace occupation. Hexapods display a remarkably large hypervolume in the EOD at the opposite of the very small hexapod hypervolume in the FID (Supplementary Fig. 2E,F). There is therefore a selectively strong sensitivity of hypervolume calculations to certain properties of the original data for this group.
Macroevolutionary Variables
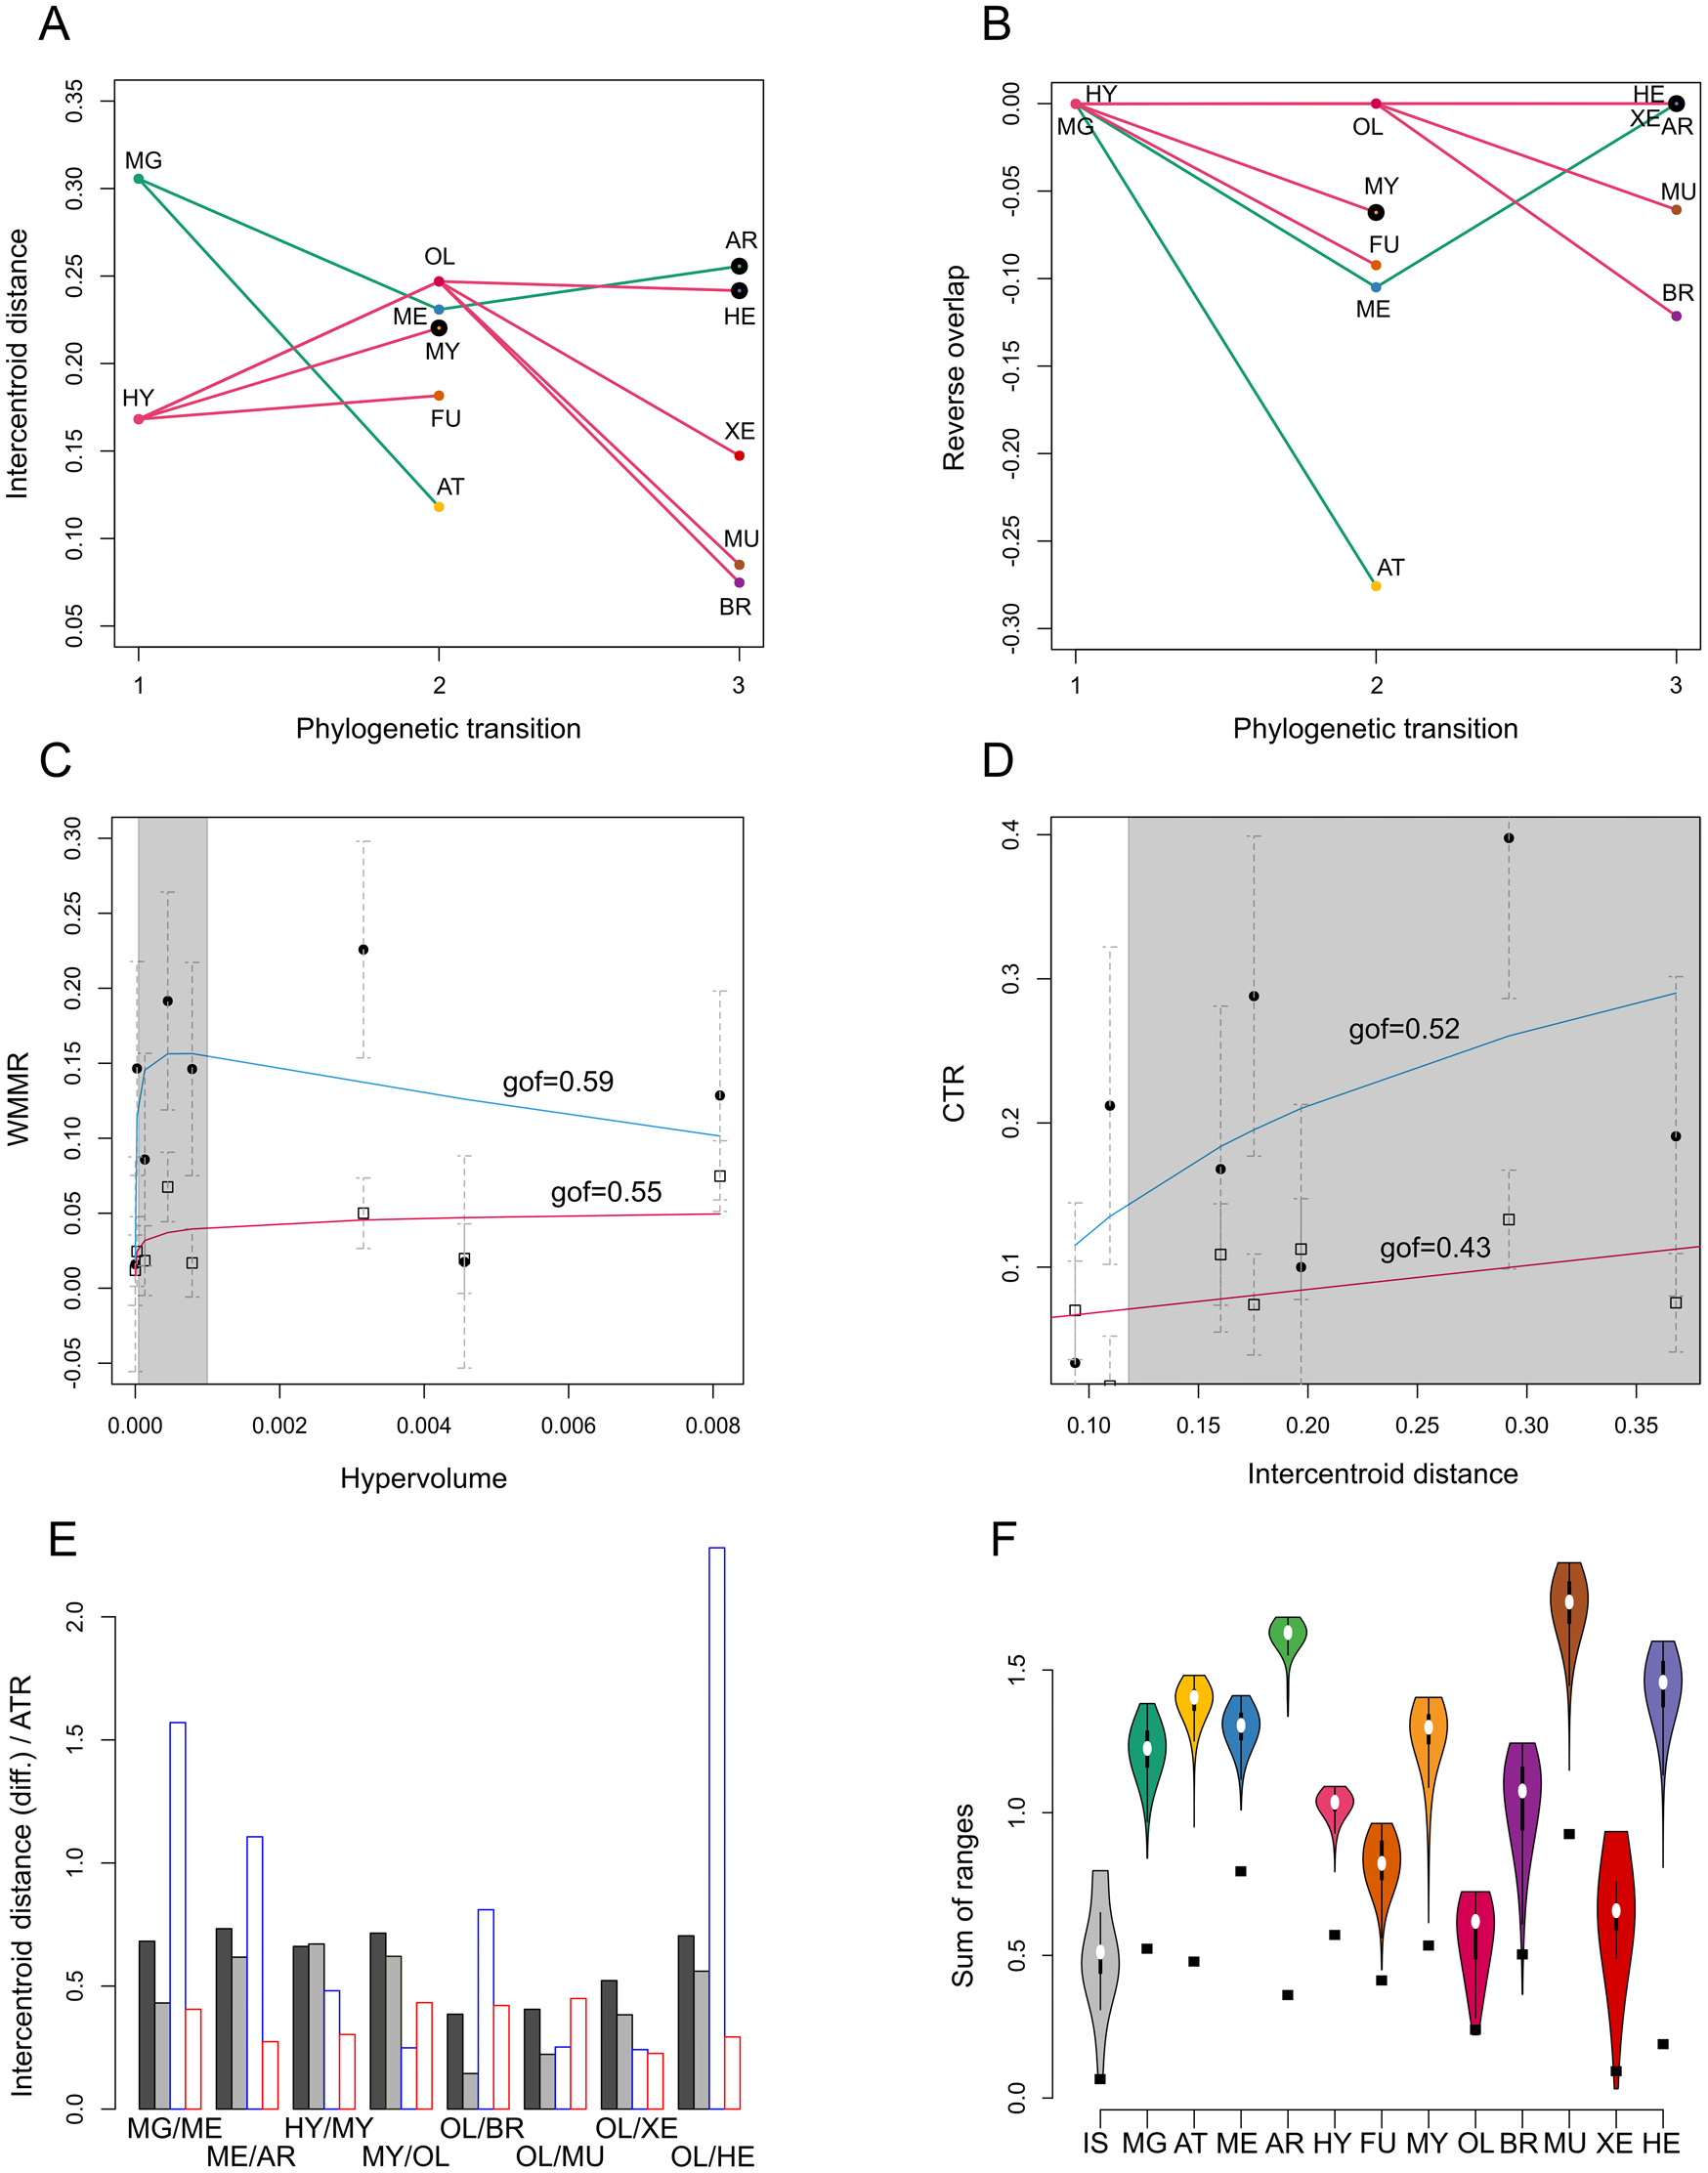
Diagrams in Figure 4A,B are meant to reflect the evolution of disparity in arthropods based on the relative distance/overlap between morphospace “clusters” (corresponding to different body plans and their respective morphological radiations). Each point represents either the centroid distance or the reverse overlap (of hypervolumes) between two phylogenetically contiguous radiative groups (“translation metrics,” see “Methods”). On the figure, the points are named after the derived group of which the relative centroid distance/overlap is calculated. Thus, for instance, Artiopoda (AT) displays low values in both cases, because their morphospace occupation is relatively small and close to their group of reference (megacheirans [MG]). These values, in particular, are lower than those of megacheirans, because, in comparison, megacheirans radiated further away than isoxyids in morphospace, and the simulated occupation of these morphogroups had little overlap.
Macroevolutionary pattern analyses describing body plan characteristics. A,B, “Translation” disparity metrics describing morphological shifts of euarthropod morphogroups at the main phylogenetic nodes of Fig. 1. A, Intercentroid distances. B, Reverse hypervolume overlaps. C,D, Correlations between disparity metrics and evolutionary rates. Dashed error bars are bootstrapped standard deviations. Solid dots and open squares represent morphological and molecular rates of euarthropod morphogroups, respectively. Blue and red curves are models fitted to morphological and molecular rates, respectively. Gray bands represent projected intervals for the corresponding metrics of extinct groups. C, Hypervolumes vs. within-morphogroup morphological rates (WMMR). Best-fit model (morphology): y ~ a*log(x) + b − d*xc, with a = 0.03, b = 0.46, c = 0.38, d = 1.34; best-fit model (molecules): y ~ a*log(x) + b, with a = 4.31 × 10⁻³, b = 7.03 × 10⁻². D, Centroid distance vs. corrected transitional rates (CTR). Best-fit model (morphology): y ~ a*log(x) + b, with a = 0.13, b = 0.42; best-fit model (molecules): y ~ ax + b, with a = 0.17, b = 0.05. E, Bar plot of centroid distances (plain bars) and evolutionary rates (open bars) for the main phylogenetic transitions. Dark and light gray bars correspond respectively to raw centroid distances and centroid distance differences; blue and red contoured bars correspond to morphological and molecular autapomorphic transitional rates (ATR), respectively. F, Violin plot of jackknifed sums of ranges for the main phylogenetic groups. Black squares are sums of ranges for the original data; white ellipses are medians. Abbreviations: AR, Arachnida; AT, Artiopoda; BR, Branchiopoda; FU, Fuxianhuiida; HE, Hexapoda; HY, hymenocarines; IS, Isoxyidae; ME, merostomes; MG, megacheirans; MU, Multicrustacea; MY, Myriapoda; OL, Oligostraca, XE, xenocarids. Color online.

When ordered phylogenetically, translation metrics (intercentroid distance and reverse hypervolume overlap; see “Methods”) therefore reveal the existence of a central macroevolutionary trend in Euarthropoda. More derived morphogroups have a tendency to radiate closer to their nearest phylogenetic neighbors, resulting in successively shorter intercentroid distances and greater overlap of hypervolumes (Fig. 4A,B). This effect applies to both total groups Arachnomorpha and Mandibulata and is also detectable in the EOD (Supplementary Fig. 1E,F).
There are nevertheless conspicuous interruptions of this trend. Myriapoda (averaging results for both metrics), Arachnida, and Hexapoda, all terrestrial taxa, are characterized by larger or at least equivalent gaps between their hypervolumes and those of their sister groups, resulting in distinctly punctuated morphological patterns. Terrestrialization is not, however, the only factor to explain stagnations or increases in morphospace distance between clusters. Fuxianhuiida and, to a greater extent, Oligostraca, which are marine taxa, also display greater translation metrics relative to their sister clusters.
Plots in Figure 4C,D represent tentative correlations between disparity metrics and evolutionary rate data from Lee et al. (Reference Lee, Soubrier and Edgecombe2013). Figure 4C represents infragroup evolution (via hypervolumes) and Figure 4D represents intergroup evolutionary transitions (via intercentroid distances). These relationships are of interest, because it is assumed here that a strong correlation between evolutionary rates and disparity metrics provides evidence for a direct, structural genetic basis behind broad changes in morphological variation; and otherwise that more complex regulatory mechanisms were involved, with conservation of the same general phenotypic potential.
Although residuals are large and goodnesses of fit are relatively low (as expected from the few data points available, the phylogenetic uncertainty affecting certain morphogroups, as well as the unrepresentend internal and intermediate variations), it is important to note that both morphological and molecular data provide similar logarithmic-based functions when fitting curves, suggesting that the signal is nonrandom (Fig. 4C). The relationship between hypervolumes and within-morphogroup morphological rates would in fact be best explained by a logarithmic model with a negative polynomial component. The speed of morphological evolution therefore appears to increase/decrease very rapidly for very small hypervolumes, but to very slowly increase/decrease for medium to large hypervolumes. Hence, smaller and denser morphogroups would be more prone to drastic shifts in internal morphological rates. A similar result obtained between hypervolume and molecular rates shows that rates reach a plateau with higher hypervolumes (Supplementary Fig. 1G). When plotted onto the same graph, Cambrian morphogroups occupy a restricted range of comparatively small hypervolumes and would therefore correspond from medium to high internal molecular and morphological rates of evolution (Fig. 4C).
The relationship between intercentroid distances and corrected transitional morphological rates also generally follows a logarithmic trend (Fig. 4D). Inter-morphogroup rates would therefore tend to increase as gaps between these clusters increase but would eventually reach a plateau. This is consistent with the fact that morphospace distance generally increases with the amount of morphological change, cumulating into a likely saturation of the rates that are biologically viable. The relationship is approximated by a linear regression in the case of molecular rates (Supplementary Fig. 1H). In this case, Cambrian morphogroups display a very large variance of intercentroid distances, except for the smallest values, and could therefore encompass a broad spectrum of transitional evolutionary rates (Fig. 4D).
Raw intercentroid distances and intercentroid distance differences (as in Fig. 4A) are poor descriptors of either morphological or molecular autapomorphic transition rates (Fig. 4E), which suggests a decoupling between these variables. Molecular and morphological rates appear themselves uncorrelated. The origins of certain morphogroups, such as merostomes, arachnids, or hexapods, are characterized by dramatic bursts of transitional morphological rates, while molecular rates vary little in comparison.
Sums of ranges are counterintuitively the highest for the groups with smaller occupations of the morphospace (Fig. 4F). However, (1) the jackknifed data purposely alter the observed distributions based on the raw data and can expand some of the morphogroups (as seen also with hypervolumes), and (2) some morphogroups overstretched along one axis of the morphospace may still provide smaller total ranges than more homogeneous groups with comparable spread on all four significant axes. The result is a correspondence between jackknifed sums of ranges and morphogroups with the a priori most well-constrained and uniform anatomies (with high sums of ranges, e.g., for trilobites, arachnids, and hexapods) (Fig. 4F, Supplementary Fig. 2A,B). Oligostracans, branchiopods, and xenocarids are all derived morphogroups, but their constitutive taxa also show major internal morphological differences (e.g., remipedes are in general very distinct morphoanatomically from cephalocarids, as are anostrocans from notostracans), which causes more heterogeneous occupations of the morphospace. Jackknifed variances of ranges mirror and corroborate these results, showing that taxa with lower sums of ranges also tend to have greater range discrepancies between the different axes—at least in the FID (Supplementary Fig. 2C,D).
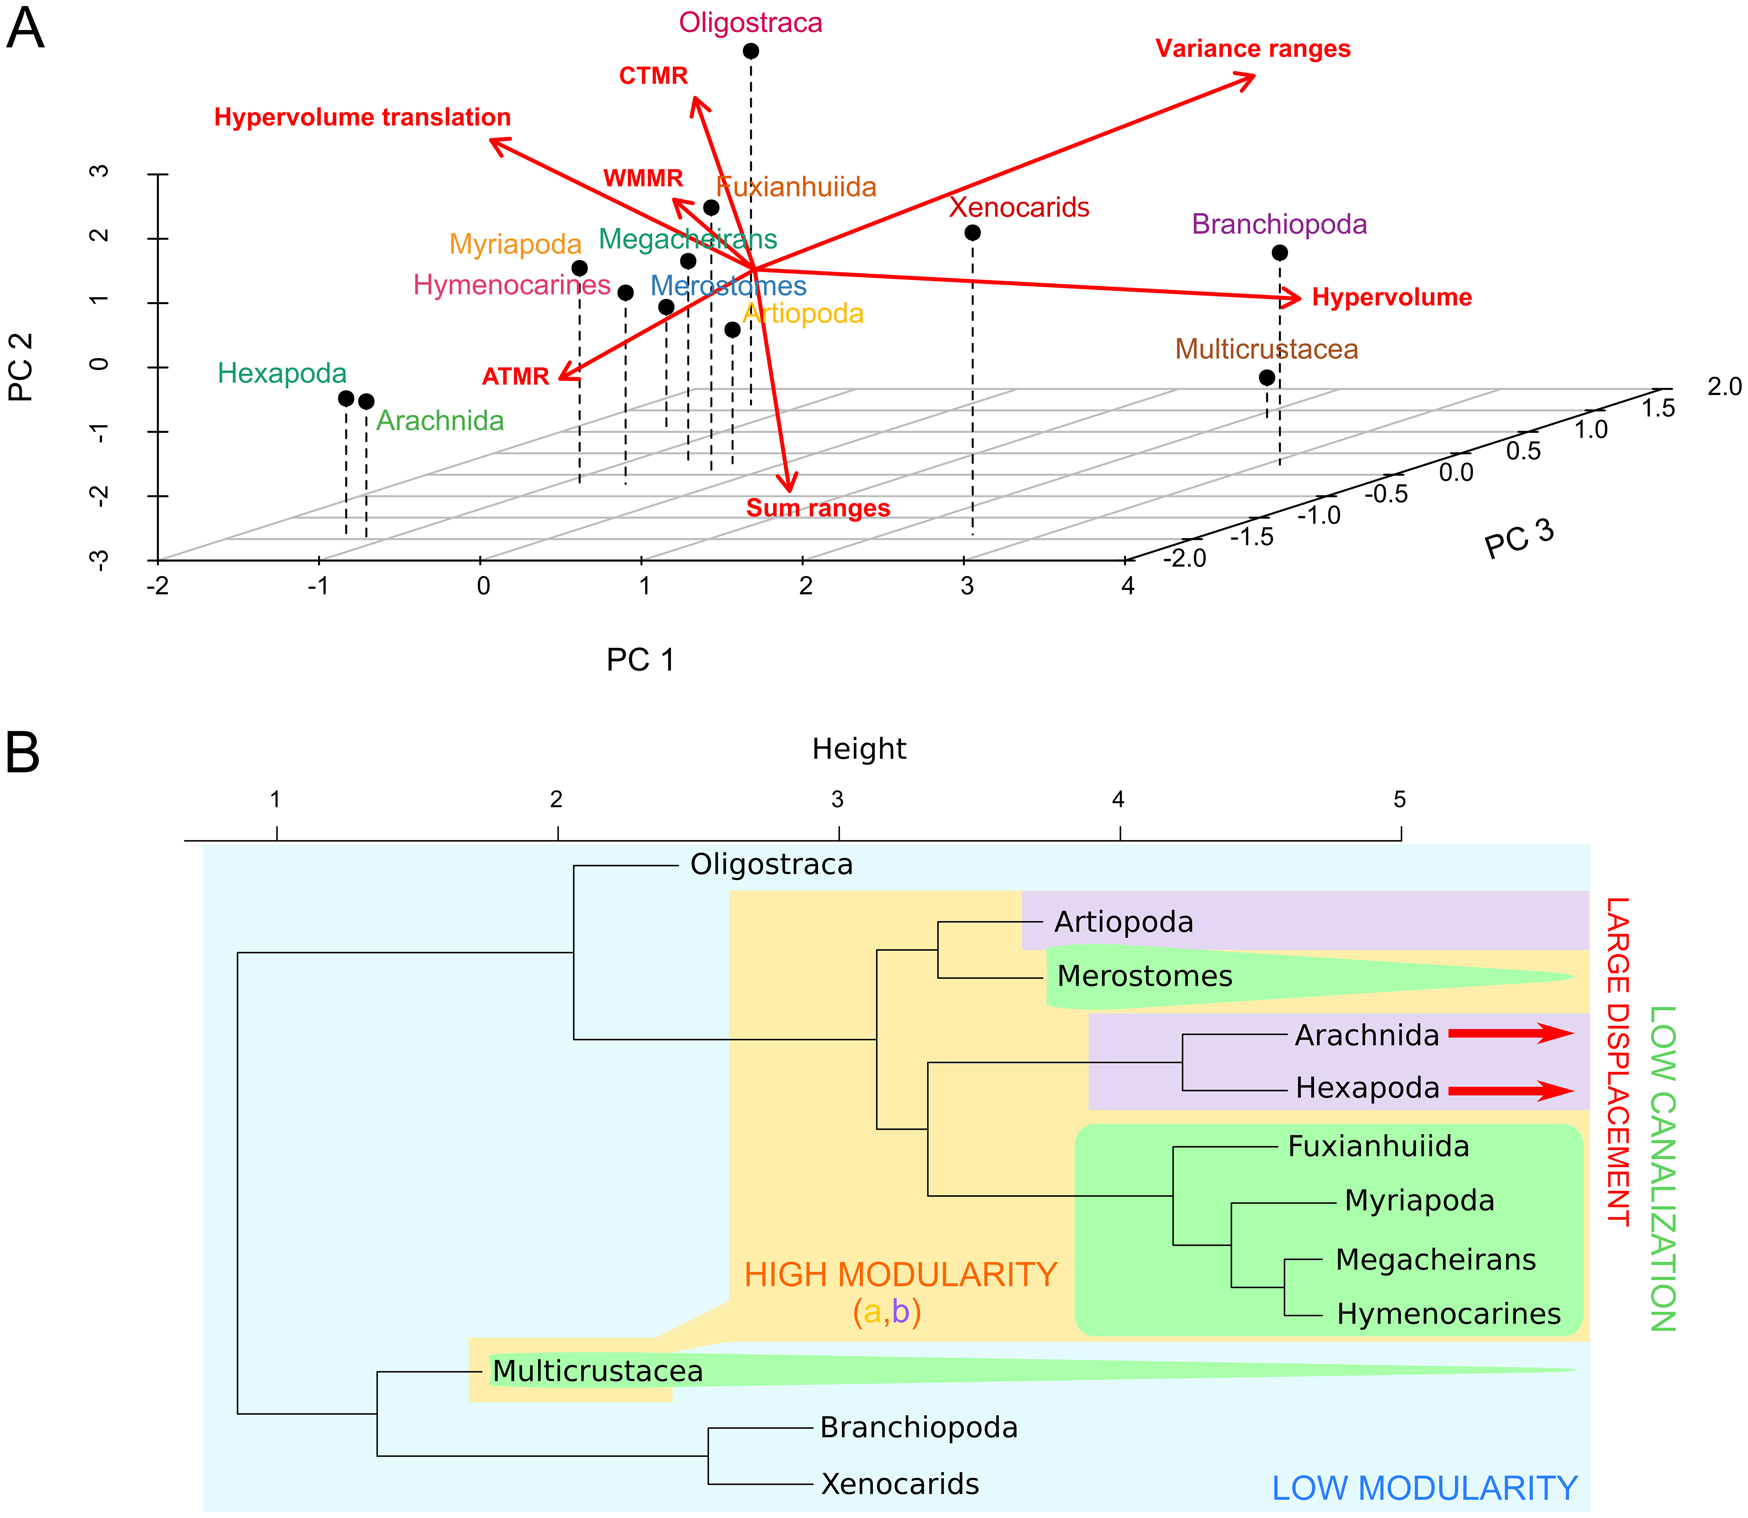
Figure 5 represents syntheses of the information provided by these different evolutionary variables as a principal component analysis (PCA) and unweighted pair group method with arithmetic mean (UPGMA), a type of hierarchical clustering (see also Supplementary Text and Supplementary Fig. 3). Using the variety of disparity metrics presented earlier as variables, morphogroup affinities are no longer reconstructed based on the phenotypic data, but on the macroevolutionary properties of their body plans. It is therefore the dissimilarity matrix of these variables that is analyzed via PCA. The UPGMA clustering uses the same dissimilarity matrix, but interprets it instead by calculating pairwise distances between the different taxa. Figure 5A,B represents two different ways of looking at the significance of these variables for the considered taxa.
Classification of morphogroups based on macroevolutionary proxies. A, Principal component analysis (PCA) of the main phylogenetic groups as explained by six macroevolutionary proxies discussed in this study (see Table 1). Variance explained: PC 1 = 42.55%, PC 2 = 27.61%, PC 3 = 17.11%. B, Unweighted pair group method with arithmetic mean clustering (UPGMA) of the data used in A, with main euarthropod morphogroups discriminated by type of morphological integration and constraints. High modularity is decomposed into a broad (a) group (yellow) and a more restricted (b) group (purple) with fewer independently evolving traits. Colors as in Fig. 1. Abbreviations: ATMR, autapomorphic transitional morphological rates; CTMR, corrected transitional morphological rates; WMMR, within-morphogroup morphological rates. Color online.

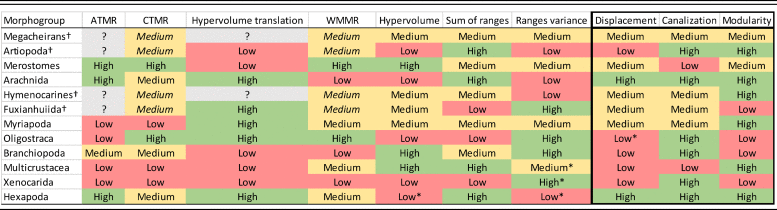
Qualitative estimates for the macroevolutionary variables quantified in this study and interpreted significance for major body plan characteristics. Italicized values are extrapolated from fitted evolutionary models (see Supplementary Text and Supplementary Dataset S3). Abbreviations and symbols: ATMR, autapomorphic transitional morphological rates; CTMR, corrected transitional morphological rates; WMMR, within-morphogroup morphological rates; *Asterisks mark the preferred value, considered less biased, when there were discrepancies between the extant-only data (EOD) and fossil-inclusive dataset (FID); †Extinct. Color online.

As anticipated earlier, sums and variances of ranges in the PCA resolve as semi-antagonistic variables, explaining variance on both axes 1 and 2 (Fig. 5A). Hypervolumes partially follow these metrics but are more influential over axis 3. Translation metrics and rates have explanatory power on axes 1 and 3, similar to internal morphological rates. Crustaceans are conspicuously driven away from the central cluster formed by other morphogroups, and spread out. Hexapods and arachnids form a clear subgroup located on the lower values of axes 2 and 3. Artiopodans and merostomes also fall on the lower end of axis 2. Myriapods, hymenocarines, megacheirans, and fuxianhuiids form a relatively tight cluster around the center of the plot. The WPGMA clustering closely reflects these results (Fig. 5B).
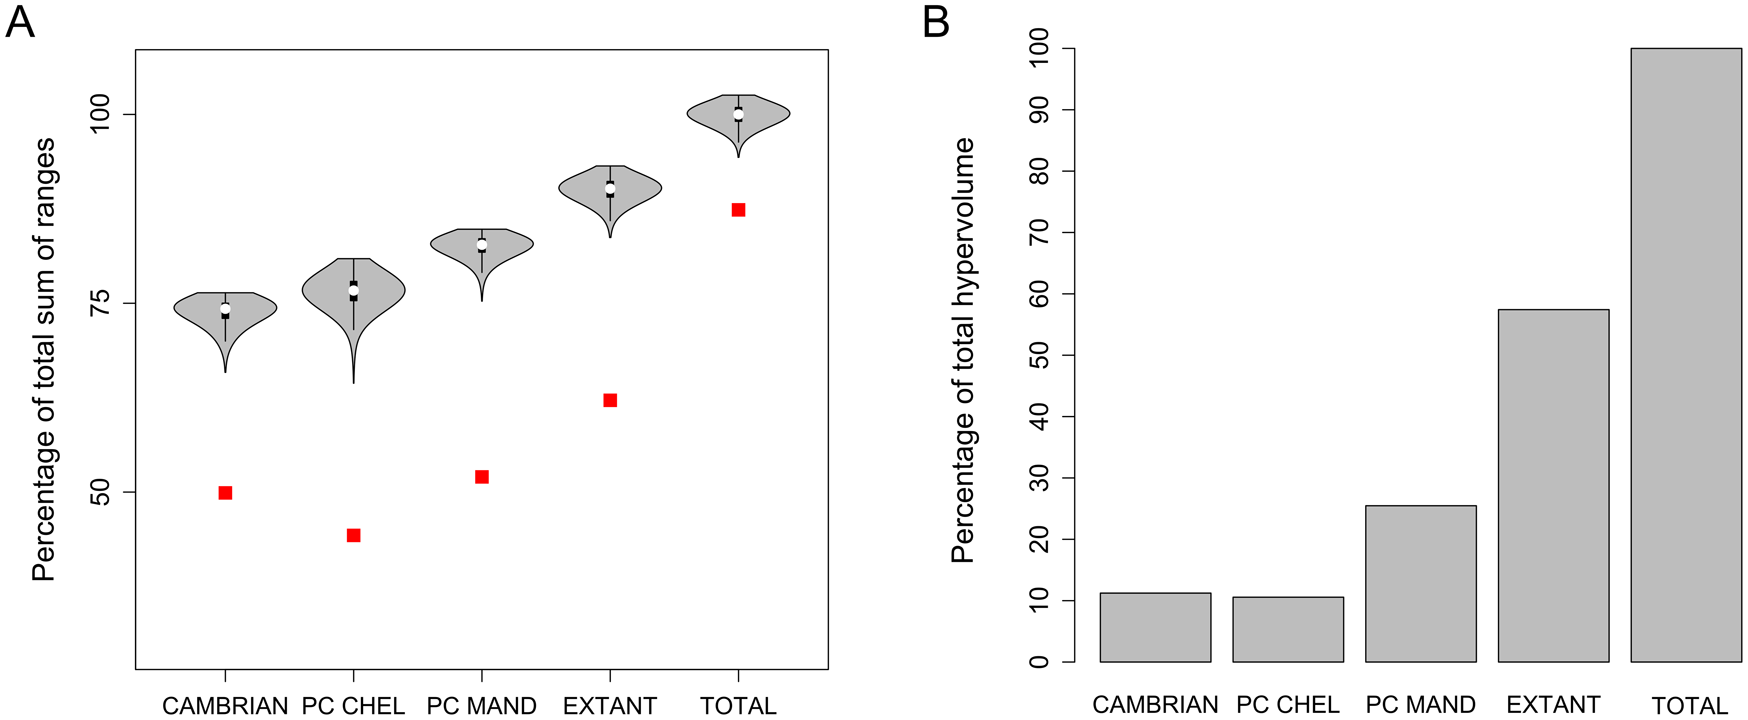
Comparing hypervolumes and sums of ranges, disparity values between Cambrian and extant taxa reveal a similar general pattern but also significant proportional differences (Fig. 6). Cambrian taxa taken altogether represent 73.91% (or 57.11% without jackknifing) and 12.13% of the total sum of ranges and hypervolume, respectively (Fig. 6A). This is to be compared with 82.56% (or 59.53% without jackknifing) and 26.55% for extant mandibulates, and 76.54% (or 50.67% without jackknifing) and 11.46% for extant chelicerates (these metrics are overlapping in morphospace and values of different groups are therefore nonadditive) (Fig. 6B).
Evolution of morphospace occupation. Comparative morphospace occupation between Cambrian, post-Cambrian, and extant euarthropods. A, Violin plots of sums of ranges. Squares (red) represent the original data (without resampling). B, Bar plot of hypervolumes. Abbreviations: PC CHEL, post-Cambrian chelicerates; PC MAND, post-Cambrian mandibulates. Color online.

Interpretations
Although both datasets investigated here—the EOD and FID—were coded independently, their respective results closely converge for most analyses, despite clustering differences due to the presence or absence of fossils (Fig. 2A–D, Supplementary Figs. 1, 2; see also Supplementary Text). This gives strong credibility to the evolutionary significance of these patterns and to the values obtained for fossil taxa, independently of other factors of bias inherent to the paleontological record. A notable exception is the spread of hexapods, minimal in the FID but on the contrary very large for the EOD. Given their curiously dichotomous distribution on axis 3 of the EOD (Fig. 2A,B), there are reasons to think that their hypervolume is overestimated in this case, although the subset of characters responsible for this pattern is difficult to identify (Supplementary Dataset S4). It is noteworthy that this separation does not clearly isolate insects or pterygotes from other hexapods, because the placement of Callibaetis (mayfly) on one hand and Machilidae (bristletail) + Lepismatidae (silverfish) on the other hand is inverted with respect to the expected clustering (Supplementary Fig. 4). The following discussion is therefore based on a synthesis of both datasets, with a necessary focus on the FID, given the peculiar interest of this study in the role of fossil morphogroups in the evolution of body plans.
The distinct difference between the elongate distribution pattern of paraphyletic basal morphogroups such as merostomes and hymenocarines and the more homogeneous spread of derived clusters, such as arachnids and hexapods, denotes a change in evolutionary mode (Fig. 3). Larger morphological distances separate taxa in these basal groups, but these changes are also very directional, limited to one or two axes. Because the morphospace axes are defined by subsets of explanatory variables with a common influence on the ordination, and because these variables are morphological characters, it is reasonable to equate these character groups to evolutionary modules (which are characterized by a complex system of interdependence, given that many characters have a significant impact on several axes; see Supplementary Dataset S4). This implies that the relevant basal groups would possess greater morphological variability for certain specific ensembles of characters but would remain well constrained for other developmental modules.
Variance between these modules seems to be generally higher in mandibulates (Fig. 4F, Supplementary Fig. 2C–F), which suggests a greater influence of trait covariation in the evolution of these arthropods. Oligostracans, branchiopods, and xenocarids represent the morphogroups with the greatest variance in the occupation of the different axes, which is easily explained by a combination of their relatively poor higher rank diversity and the large morphoanatomical differences between their constitutive taxa (e.g., notostracans vs. anostracans, ostracods vs. branchiurans). In these groups, greater variance, and, more importantly, the variance of this variance in the occupation of the different axes are not achieved because of a particular developmental module gaining greater variability, but because one is reshuffling sets of traits that were initially forming separate and coherent morphoanatomies. This is made clear when comparing raw and jackknifed values for these taxa across datasets (Supplementary Fig. 2C–F). In the case of xenocarids, these discrepancies must be attributed to the likely polyphyletic nature of the morphogroup. For oligostracans and branchiopods, however, the model suggests that new higher taxa would emerge from the concomitant covariation of characters within particularly broad modules—archetypical cases, then, of saltationism. Based on our current knowledge of these morphogroups, these events would be extremely rare and, contrary to stem groups, would not lead to a series of directional changes, but to isolated cases of punctuation in any direction of the morphospace, driven by strong selective pulls. It would be interesting to verify whether this property might also be illustrated by genetic, developmental, or microevolutionary data.
Because the term “modularity” is being generally used in paleontology to qualify morphoanatomies with traits (or small groups of traits) evolving independently from the others (e.g., Eble Reference Eble2000; Gerber and Hopkins Reference Gerber and Hopkins2011), wide-ranging covariations will be qualified here as cases of low modularity compared with more uniformly integrated body plans, although we could also view these situations as different types of modularity (Schlosser Reference Schlosser2002). I will reserve this approach in order to distinguish hereafter between two different expressions of high modularity.
Sums of ranges for the raw data are consistent with the observation that early morphogroups tend to have wider spreads (Fig. 4F, Supplementary Fig. 2B), showing higher values for megacheirans, merostomes, and hymenocarines—although branchiopods are an exception. Jackknifing, however, provides an almost opposite pattern according to which more derived taxa are expected to cover a greater overall range, mirroring in general jackknifed values of range variances. Because this result is also at odds with the values obtained for hypervolumes (Supplementary Fig. 2F), it would be an oversimplification to interpret it as a synthetic proxy for disparity. Rather, jackknifed sums of ranges seem to inform here specifically about group homogeneity, which, in macroevolutionary terms, would translate into a better-canalized genetic machinery and higher modularity (according to the definition given earlier).
Multicrustacea stands out as both a large and homogeneous cluster, similar to merostomes, which are also marine taxa; this pattern does not apply, however, to trilobites and their close relatives, which form a much more compact cluster. Buoyancy and other typically marine advantages compared with life on land are thus not sufficient to explain the maintained high disparity of multicrustaceans. In addition, the long distance between Nahecaris and Cinerocaris and the modern malacostracans suggests that the true extent of this group's radiation is still largely hidden within the fossil record or documented in insufficient detail across archaeostracans (Collette and Hagadorn Reference Collette and Hagadorn2010; Aria and Caron Reference Aria and Caron2017a). Perhaps more importantly, the fact that the extremely autapomorphic thecostracans (barnacles) were not included in this study (see Supplementary Text about inapplicability) also suggests the overall disparity is underestimated in this morphogroup. It could be argued that Multicrustacea should be broken down into smaller morphogroups, perhaps based on clustering results.
By contrast, translation metrics provide strong evidence that terrestrialization repeatedly constituted a major ecological shift that convergently affected morphological evolution in similar ways. Assuming that the transitions between morphogroups correspond to broad displacements of adaptive peaks (Niklas Reference Niklas1994) and that the paucity of fossil evidence for morphological intermediaries between clusters generally relates to lower fitness intervals between the more stable peaks (in more derived groups, see “Implications”), this could mean that new body plans became increasingly more viable, and better suited to survive through environmental changes in their respective niches. In the case of myriapods, arachnids, and hexapods, translations remained stable or even increased; a differential pattern that should be explained, at least partly, by the morphological stress related to events of terrestrialization.
Interestingly, a similar condition characterizes oligostracans (Fig. 4A,B). Autapomorphic transition morphological rates (ATMR; see Supplementary Text; Fig. 4E) show, however, a neat discrepancy between arachnids and hexapods on the one hand, which display remarkably high rates, and oligostracans on the other hand, for which rates are among the lowest; myriapods, in turn, display rates that are only slightly higher than those of olicostracans. By contrast, molecular rates vary little and do not show signs of correlation with morphological ones, although they are in oligostracans higher than in arachnids, myriapods, and hexapods. The causes behind increased translation distances are therefore probably different between at least arachnids/hexapods and oligostracans. It is more likely than the large translation in morphospace between oligostracans and their closest ancestral morphogroup characterizes in fact the origin of pancrustaceans as a whole. This is suggested by the contrastingly high corrected transition morphological rates (CTMR; see Supplementary Text; Table 1) for this group, because this metric incorporates the very high morphological rates separating myriapods from oligostracans.
The decoupling between autapomorphic morphological and molecular rates mentioned suggests that terrestrialization events involved dramatic reorganizations of existing genetic pathways, rather than accelerated evolution through accumulated beneficial mutations. This would be consistent with disparity patterns, insofar as terrestrial adaptations would have been mostly associated with the profound modification of existing structures and a more constrained fundamental development rather than with increased structural variability. In other words, groups with already fairly highly integrated genotypes were faced with the invasion of land and had to cope with it through a limited number of morphological trade-offs—which explains the extreme convergences between these groups.
Greater rate similarity and smaller translation metrics suggest that myriapods originated from a gradual adaptive trajectory, notably through fossil groups living at the interface between water and land—euthycarcinoids, whose spiracle-like “sternal pores” could be associated with atmospheric breathing (Edgecombe and Morgan Reference Edgecombe and Morgan1999; Vaccari et al. Reference Vaccari, Edgecombe and Escudero2004), are possible candidates (see “Implications”; see also the very recent study by Edgecombe et al. Reference Edgecombe, Strullu-Derrien, Góral, Hetherington, Thompson and Koch2020). A transitional scenario would also be expected for arachnids (through possible shore-dwelling eurypterids) and to some extent for insects (through freshwater forms?), but the data (including the available paleontological information, with its limitations) predict more drastic morphological changes for these groups. The high ATMR for merostomes may be related to the punctual evolutionary event characterizing the origin of the chelicerate cephalon (Aria and Caron Reference Aria and Caron2017b, Reference Aria and Caron2019).
A qualitative assessment of the different macroevolutionary variables and their meaning in terms of displacement, canalization, and modularity is provided in Table 1. As explained earlier, these of course cannot be treated as independent variables, but should instead be regarded as complementary and nonredundant descriptors of phenotypic evolution. The concept of “displacement” is equivalent to a macroevolutionary generalization of the “quantum evolution” of Simpson (Simpson Reference Simpson1944; Gingerich Reference Gingerich2001; see “Implications”), as adaptive zones are here defined at the supraspecific level (Niklas Reference Niklas1994). The conspicuous outcome of this synthesis is that paraphyletic basal morphogroups (megacheirans, merostomes, hymenocarines) tend to display intermediate values for body plan characteristics, whereas artiopodans and extant morphogroups (with the exception of myriapods) display more extreme values in their given spectra. An intuitive interpretation of this pattern could be that emergent body plans are in fact characterized not by the broadest disparity metrics and the highest rates, but by average values, which would thereby reflect the lack of positive or negative constraints on their evolvability (Wagner Reference Wagner1996).
In both “macroevolutionary space” (Fig. 5A) and hierarchical clustering (UPGMA; Fig. 5B), crustaceans stand out as having very disparate body plan properties compared with other morphogroups. Outside of the hyperdiverse Multicrustacea, high variances of ranges combined with low internal rates give groups “low modularity,” in that their constituting body plans are significantly different from one another, yet they remain taxonomically poor at the familial, generic, and often specific levels. Oligostraca retains high internal rates, which may be associated with the tremendous diversity of ostracods or to extreme adaptations within this group (e.g., pentastomids, not included in the FID), but could also reflect more fundamental genetic and phenotypic changes occurring within that clade by comparison with morphogroups that have low internal rates. ATMR are also low for these taxa, typifying the proximity of their radiative zones to their respective ancestral body plans, which is also reflected through their translation disparity metrics.
This is opposite to the tight grouping formed by Hexapoda and Arachnida, both characterized by low variances of ranges and high ATMR. This is interpreted as evidence for stable and integrated body plans that stabilized within an adaptive zone far from the closest ancestral morphogroup. Internal rates are also relatively low, suggesting that the spectacular radiation of these taxa is mostly due to small marginal mutations and epigenetic changes, while the core of the genome sequence has remained strongly buffered. These and the remaining morphogroups are broadly characterized by diversifications that involve modifications of more “peripheral” traits around a relatively stable core body plan. Hence, because their developmental architecture is more integrated throughout the entire body, and variations are based on traits usually independent from one another, they are said here to have “high modularity.” However, there are differences among these morphogroups in the amount of morphoanatomy subject to variability, a notion quantified by the conjunction of multiple macroevolutionary variables, mainly the array of disparity metrics. “Canalized” morphogroups are therefore those that display small hypervolumes, high sums of ranges, and low variances of ranges. According to these criteria, hexapods, arachnids, and artiopodans are the body plans that display the highest degree of canalization. As a result, a “modular” evolution a priori applies only to downstream secondary features (e.g., shape of leg or antennae, wing venation, contour of glabella), while “less canalized” morphogroups retain a greater phenotypic palette of variations. High modularity is therefore decomposed here into two types based on degrees of canalization.
Based on their body plan proxies, multicrustaceans and fuxianhuiids should resolve among the groups with respectively low and high modularity, the opposite of the UPGMA clustering result. It is likely that this result comes from the association by proximity of fuxianhuiids with myriapods, on the one hand, and multicrustaceans with xenocarids (mostly because of transition variables) on the other. This also emphasizes how the dichotomy high/low modularity is a simplification and implies that a better approach would be to map character covariations in order to identify the type and extent of morphological modules involved.
Implications
As illustrated earlier, averaging disparity metrics to obtain a single representation of disparity is not necessarily meaningful, because the formulas used by these metrics can yield patterns that reflect different evolutionary aspects for the same morphogroups. This is not a trivial observation, because a majority of disparity studies have so far used various metrics as different ways to estimate disparity considered as a whole. In the case documented here, sums of ranges and hypervolumes let us look at euarthropod evolution from two different perspectives (Fig. 7A).
Reconstructed macroevolutionary patterns of Euarthropoda. A, Extrapolated disparity curves based on the data of Briggs et al. (Reference Briggs, Fortey and Wills1992) and this study, for the total sum of ranges and hypervolume, in the context of major events affecting euarthropod evolution during the Phanerozoic. Red disks represent the calculated values of disparity obtained here (see main text and Fig. 6); dark red disks are values from Briggs et al. (Reference Briggs, Fortey and Wills1992). Gray box illustrates the explanatory macroevolutionary models proposed here: (a) displaced optimum scenario, with fitness peak (blue) moving across the adaptive landscape, while altogether increasing its maximum fitness value and decreasing the range of viable fitnesses; morphology (red) follows, moving from a broad phenotypic expression with a restricted high-fitness range of values to a more uniformly viable range of phenotypes—under the effect of more integrated genetic regulatory networks and better canalization; and (b) punctualistic events driven by major ecological transitions (such as terrestrialization) in which profound morphological changes occur quickly but are not necessarily associated with a proportional evolution of the structural genome. B, Euarthropod phylogenetic framework (see Fig. 1) with mapping of main transitions in body plan canalization and variability (simplified from Table 1 and Fig. 5). Regions of higher phenotypic variability are in blue; those of more constrained phenotypic expression are in red. Letters “a” and “b” correspond to evolutionary models in gray box in A. Arrows represent major “translation” events. White stars indicate branches with strong discrepancy between molecular and morphological rates. Multicrustaceans and myriapods are considered to have retained or reacquired substantial phenotypic variability; artiopodans are considered “mixed,” because the trilobite plan is arguably much more constrained than that of its relatives. Color online.

Sums of ranges yield an overall pattern that is closer to the findings of Briggs et al. (Reference Briggs, Fortey and Wills1992) published 27 years ago, despite considerable differences in the size and content of matrices and methodologies. These metrics show that, by the end of the Cambrian explosion, euarthropods had realized at least half of their total morphospace. There thus seems to be a very robust signal of morphological diversity using the euarthropod data, at least when considering ranges. Because they reflect the diversity of the main body plans, these curves are understandably comparable to that of a diversity curve for highest taxonomic ranks (Raup Reference Raup1972; Sepkoski Reference Sepkoski1984; Alroy Reference Alroy2010; Fig. 7A). The difference between the present results and those of Briggs et al. (Reference Briggs, Fortey and Wills1992) essentially resides in the resampling of the data, which was not used in their study; however, it arguably provides a more robust set of values, implying that the raw results are generally underestimating realized disparity (which is expected from sparse paleontological data). Recent revisions of Cambrian arthropods supporting their crown-group affinities (Aria and Caron Reference Aria and Caron2017a, Reference Aria2019) and rates of morphological evolution in trilobites (Paterson et al. Reference Paterson, Edgecombe and Lee2019) all point to even earlier and faster occurrence of the arthropod radiation, probably deep within the Terreneuvian. This implies, in light of this evidence, that more than 70% of the disparity of the largest animal phylum was realized in less than 20 Myr.
By all accounts, this is indeed an “explosive” event, especially because the fossil evidence (Daley et al. Reference Daley, Antcliffe, Drage and Pates2018) strongly advocates against molecular clock estimates still placing large parts of early metazoan evolution (including arthropods) in the pre-Cambrian (Erwin et al. Reference Erwin, Laflamme, Tweedt, Sperling, Pisani and Peterson2011; Lozano-Fernandez et al. Reference Lozano-Fernandez, Reis, Donoghue and Pisani2017) and favors instead more dramatic models of genetic evolution. However, as noted before (Briggs et al. Reference Briggs, Fortey and Wills1992; Wills et al. Reference Wills, Briggs and Fortey1994), it would be inaccurate to say that the Cambrian euarthropod morphospace exceeded that of surviving taxa—which would translate into having modern clusters contained within the Cambrian morphospace. Instead, this morphospace has been continuously expanded, and the disparity of the mandibulate subphylum, for instance, exceeds today that of Cambrian forms (Fig. 6), although this was achieved over a much longer period of time.
This is clearly illustrated by the hypervolume metric, which forces a more gradual reading of disparity augmentation over time (Fig. 7A). This is because, mathematically, new taxa more easily add increments to a volume than to a range in morphospace, as increases in distances are equivalent to polynomial increases for hypervolumes (Wills et al. Reference Wills, Briggs and Fortey1994). Considering that the hypervolume occupation of extant clades is only 57.43% of the total, the hypervolume loss due to extinctions must be much greater than that observed with ranges. On the other hand, to compensate for these losses, rates of increase and background augmentation of disparity must also be higher than for ranges. I call this dynamic a “bubble effect,” as opposed to the “saturation effect” of ranges, characterized by a quicker and more resilient occupation of morphospace (Fig. 7A). This shows overall how the conceptual two-dimensional representations of disparity on cladograms with expanding or shrinking branches (Gould Reference Gould1989; Foote Reference Foote1993) can be an oversimplification, misleading our expectations of morphological patterns in evolutionary lineages. Interestingly, however, the shape of the estimated hypervolume curve also mimics those of higher-rank diversity, notably families (Raup Reference Raup1972; Sepkoski Reference Sepkoski1984), although the bursting effect of the global Ordovician biodiversification event is here substituted by terrestrialization events.
The main Phanerozoic events thought to possibly have impacted changes in the total disparity of Euarthropoda are the Cambrian explosion, terrestrialization events during the Silurian/Devonian, the Permo-Triassic (P/T) global mass extinction, and the rise of angiosperms during the second half of the Cretaceous (Fig. 7A). As expected, and shown here through disparity metrics, terrestrialization events had a major influence on morphological diversity. The hypervolume pattern, which requires a significant increase of disparity after the Cambrian to reach the extant value, suggests that adaptations to land biomes may have generated a more voluminous phenotypic diversity than the Cambrian explosion. As we have seen, however, the mechanisms that generated this disparity were quite different, based on almost antagonistic states of body plan canalization.
The P/T extinction event (or, more inclusively, the Permian series of extinction events) is correlated with the disappearance of all artiopodans (including the remaining trilobites) and nearly all merostomes sensu lato. It is less clear whether this crisis played a role in the disappearance of other remaining survivors of typically Cambrian lineages found in more recent Paleozoic rocks, including lobopodians (Haug et al. Reference Haug, Mayer, Haug and Briggs2012) and anomalocaridids (Kühl et al. Reference Kühl, Briggs and Rust2009), although this remains a possibility. In any case, the P/T mass extinction certainly represented the most dramatic loss of disparity in the history of panarthropods, and the “refilling” of the morphospace after this event must have substantially increased the total hypervolume, although no significantly new body plan emerged during the recovery. By contrast, the very high sum of ranges for extant taxa implies that the impact of the P/T event on the spread of the morphospace was relatively modest. This is mainly because the regions of morphospace occupied by artiopodans and merostomes stand within the total range reached by arachnids (Figs. 2, 3).
The end-Devonian mass extinction might have had a similar impact on the disparity of marine arthropods, albeit at a much smaller scale (Feist Reference Feist1991), while the combination of the end-Cambrian and end-Ordovician extinctions (Bambach Reference Bambach2006) of a number of stem body plans certainly accounted for a two-step slowdown and significant loss of disparity (Fig. 7A). By contrast, it is unlikely that either the rise of angiosperms or the Cretaceous/Paleogene (K/Pg) mass extinction significantly altered euarthropod disparity. The impact of the K/Pg crisis on at least insects (Labandeira Reference Labandeira2005) and chelicerates (J. Dunlop unpublished data) seems to have been limited, while the rise of angiosperms only contributed to secondarily diversify the existing body plan of insects (Labandeira and Sepkoski Reference Labandeira and Sepkoski1993). As discussed before, hypervolume values are strongly biased in favor of multicrustaceans, and the expected pattern of increase through the Mesozoic cannot be readily attributed to the sheer radiation of insects and their predators, the arachnids, during that time (Fig. 7A), even if we saw that hypervolumes could be a sensitive metric in the case of hexapods (Supplementary Fig. 2E,F).
These curves are of course tentative, for (1) it is harder to estimate changes in disparity than changes in diversity when they occur; and (2) the soft-body evidence is extremely scarce after the Cambrian/Lower Ordovician, making it difficult to appreciate the true longevity of many body plans originated during these periods, apart from a number of isolated cases (Caron et al. Reference Caron, Rudkin and Milliken2004; Kühl et al. Reference Kühl, Briggs and Rust2009; Haug et al. Reference Haug, Mayer, Haug and Briggs2012; Siveter et al. Reference Siveter, Briggs, Siveter, Sutton and Legg2018). In general, and apart from the outstanding cases of trilobites and ostracods, arthropod fossil records are typically Lagerstätte driven, which presents serious challenges for diversity estimations. Disparity estimates, nonetheless, should be a lot more robust to this collection bias, at least from the Mesozoic onward.
Very high morphological rates relative to molecular rates are found to characterize the origins of arachnids and hexapods, which suggests that these terrestrialization events involved a repurposing of existing genes rather than a faster evolution of the coding parts of their genomes. This observation is not at odds with large variations in genome size among and within insect higher taxa (Yin et al. Reference Yin, Shen, Guo, Wang, Ma, Xiao, Liu, Zhang, Liu, Zhang, Yu, Huang and Li2016; Ding et al. Reference Ding, Wang, He, Jiang and Li2017); on the contrary, this supports the hypothesis that the insect body plan is the result of a strong and efficient canalization of a much larger phenotypic potential. As a matter of fact, diversification in insects is negatively correlated to the genome size (Kraaijeveld Reference Kraaijeveld2010), which further suggests that strong canalization and genetic assimilation can lead to a loss of fundamental genetic diversity.
Given the importance of terrestrialization in these results, one may also question the absence of signal for the transition to an aerial ecology in insects, which is linked to a series of critical morphological innovations in the evolution of arthropods and metazoans as a whole. There are three lines of reasoning for this. One is methodological (see Supplementary Text), a second is conceptual, and the third is biological. In part, the absence of consensus on the structures giving rise to the wings in insects (Linz and Tomoyasu Reference Linz and Tomoyasu2018) makes it difficult to trace their homology deep within the euarthropod tree, and hence they appear as “secondary” structures in these analyses (at the same rank as teeth, or setae, or shape variations), because they cannot be associated with modifications of the shared euarthropod body plan. In part, it must be considered that the morpho-functional importance of this feature may not be equivalent to its place in development and its anatomical importance. Evidence from wing mutations in Drosophila could support this view (Carreira et al. Reference Carreira, Soto, Mensch and Fanara2011). The polygenic basis of wing variations shows that wing development is highly integrated but also easy to disrupt, and that it is relatively easy to produce nonlethal variants bearing wing aberrations. The co-option of two preexisting, separate cell lineages to form insect wings also points to a downstream process with a heavy regulatory component (Linz and Tomoyasu Reference Linz and Tomoyasu2018).
Conversely, and because some overlap with changes in preservation mode, these large “translation” events and interruptions of the canalization pattern should be examined in light of the completeness of the fossil record. In each major case of terrestrialization, evidence for transitional taxa for chelicerates, hexapods, and myriapods is scarce. However, there are reasons to think that the morphological gaps observed are greater than what may be missing in the fossil record. In the case of chelicerates, horseshoe crabs typify an ecology at the interface between sea and land, and xiphosurans likely have been present since the Ordovician (Van Roy et al. Reference Van Roy, Orr, Botting, Muir, Vinther, Lefebvre, el Hariri and Briggs2010); eurypterids are also thought to have occasionally come to shore (Braddy and Almond Reference Braddy and Almond1999). The contribution of scorpions to this issue is more complex. The aquatic ecology of fossil scorpions is disputed (Kühl et al. Reference Kühl, Bergmann, Dunlop, Garwood and Rust2012), and the likelihood of them originating from marine ancestors or from terrestrial forms returning to an aquatic lifestyle strongly depends on the validity of the Arachnopulmonata hypothesis (Sharma et al. Reference Sharma, Kaluziak, Perez-Porro, Gonzalez, Hormiga, Wheeler and Giribet2014; Klussmann-Fricke and Wirkner Reference Klussmann-Fricke and Wirkner2016). With respect to mandibulates, if euthycarcinoids were closely related to myriapods and derived from fuxianhuiid ancestors (Vannier et al. Reference Vannier, Aria, Taylor and Caron2018), subaerial ichnofossils attributed to euthycarcinoids would suggest that the punctual morphological gap separating these taxa could be genuine. Considering that the oldest traces attributed to euthycarcinoids are from the mid-to-late Cambrian (MacNaughton et al. Reference MacNaughton, Cole, Dalrymple, Braddy, Briggs and Lukie2002; Retallack Reference Retallack2008; Collette et al. Reference Collette, Hagadorn and Lacelle2010), and the oldest myriapod body fossil is about 430 million years old (Wilson and Anderson Reference Wilson and Anderson2004), the chances for a cryptic fossil group to fill this morphoanatomical gap are low. The origin of hexapods, on the other hand, potentially from an ancestor shared with remipedes (Schwentner et al. Reference Schwentner, Combosch, Nelson and Giribet2017), remains enigmatic.
Although both hymenocarines and merostomes seem to combine biological characteristics with their “stem” status, merostomes do not in fact strictly represent a stem group, because they contain the extant xiphosurans. This perfectly illustrates the caveat of using “stem” and “crown” with biological connotations. As documented also by onychophorans and tardigrades with respect to lobopodians, perhaps pycnogonids (Rudkin et al. Reference Rudkin, Cuggy, Young and Thompson2013), and other such examples across the tree of life (e.g., Friedman and Coates Reference Friedman and Coates2006; Crane Reference Crane2013), there are obvious cases of long-term survival of species-poor, often strongly autapomorphic taxa that originated from previously successful morphogroups that have gone extinct. There are possibly adaptive reasons for these taxa to be “lone survivors,” but cases of “stem” Cambrian taxa surviving long into the Paleozoic (Caron et al. Reference Caron, Rudkin and Milliken2004; Kühl et al. Reference Kühl, Briggs and Rust2009; Haug et al. Reference Haug, Mayer, Haug and Briggs2012) suggest that their presence in modern faunas is also largely a result of evolutionary contingencies. Conversely, artiopodans and especially trilobites testify to the power of such contingencies to drive into extinction even the most speciose, genetically robust, and ecologically varied groups, whose macroevolutionary characteristics are largely equivalent to those of modern megaclades, as shown here. The ultimate extinction of trilobites was but the last blow in a slow, if stepwise, decline over dozens of millions of years (Feist Reference Feist1991; Foote Reference Foote1993)—but the causes of this long demise are not clear, and it is unlikely that they are related to some inherent limitations of maximum fitness.
The most immediate conundrum when looking at the geologic history of arthropods is that of a formidable body plan stability, or stasis, despite their immense radiation, and while canalization and modularity (as defined earlier) are conceptual tools and evolutionary processes that help explain the patterns that we see, they are not, by themselves, evolutionary models. Estes and Arnold (Reference Estes and Arnold2007) found that the evolution of metazoan lineages generally followed a model of “displaced optimum” according to which phenotypes follow a single fitness peak that tends to move abruptly, but only once, between stable adaptive zones for a given lineage. The caveat, of course, is the size of what are considered lineages, which, in the original data, encompass taxa of different ranks, but mostly familial and ordinal (Gingerich Reference Gingerich2001). It should therefore not be too surprising to see several such displacements of fitness optima when looking at the entire Euarthropoda. This is what the morphospace structure suggests, with the less canalized fossil stem groups representing “steps” of phenotypic change with transitional, suboptimal fitness values. The clear directionality characterizing the distribution of megacheirans, merostomes, and hymenocarines is consistent with this interpretation. If canalization leads to the stabilization of the GRNs, clearly separated morphogroup clusters would imply that this process is fast on a macroevolutionary scale and that phenotypes are strongly driven by newly shifted adaptive peaks.
From this information, we can attempt to reconstruct the evolution of disparity and canalization in euarthropods based on the phylogenetic framework presented in Figure 1 (see euarthropod phylogenetic framework in Fig.7B). As expected (Aria Reference Aria2019), the distinction between stem and crown groups only represents a rough approximation of the evolutionary properties characterizing the structural evolution of body plans. Poorly canalized body plans identify the basal branches of the euarthropod tree, including paraphyletic Cambrian stem lineages, but also merostomes and hymenocarines, which arguably overlap stem and crown. Other regions of the tree contain morphogroups whose disparity metrics are interpreted as evidence for well-canalized morphoanatomies. Based on the results discussed earlier, artiopodans are also included in this category, although, internally, this morphogroup arguably experienced at least a twofold process of further canalization, considering that trilobites would probably stand out as having a more robust body plan than their close relatives.
In conjunction with the heterogeneous ordination of the morphospace discussed earlier, this means that most of the cladogram therefore reflects the adaptive scenario derived from Estes and Arnold (inset in Fig. 7Aa), which posits here a stepwise displacement of the adaptive peak with successive reduction of the translation distance, correlated with an increased fitness of the peak. This correlates, in turn, with a stepwise pattern of body plan emergence in which canalization stabilizes increasingly more of the expressed phenotype. This pattern is punctuated by large morphological displacements that likely correspond to dramatic shifts of the adaptive landscape (inset in Fig. 7Ab), as typified by terrestrialization events, but also, apparently, by the origin of pancrustaceans, which is more difficult to explain. Certain morphogroups, such as myriapods or multicrustaceans, internally retain a broad phenotypic variability, in spite of likely originating from ancestors with already well-canalized GRNs.
This generally supports the idea that the diversification of miRNAs and the assembly of GRNs were more decisive in the origin of metazoan body plans than the evolution of the structural genome itself (Peterson et al. Reference Peterson, Dietrich and McPeek2009; Erwin et al. Reference Erwin, Laflamme, Tweedt, Sperling, Pisani and Peterson2011). Owing to the evidence (Lee et al. Reference Lee, Soubrier and Edgecombe2013; Daley et al. Reference Daley, Antcliffe, Drage and Pates2018; Paterson et al. Reference Paterson, Edgecombe and Lee2019) that most metazoan phyla, including arthropods, were not present before the base of the Cambrian, and therefore that there was no 50 Myr lag between the origin of the arthropod genome and the diversification of arthropod body plans (Erwin et al. Reference Erwin, Laflamme, Tweedt, Sperling, Pisani and Peterson2011), structural genetic material would have diversified extremely quickly, before regulatory networks, notably through cis-regulatory mutations (Wray Reference Wray2007) and gene co-options (True and Carroll Reference True and Carroll2002), became dominant actors of phenotypic reorganization.
Conclusions
Arthropods have the most diverse morphologies of all animals, yet, and despite historical debates about their internal relationships, they can be assigned surprisingly well to a few distinct groups. Even Cambrian fossils, traditionally considered as misfits or forming a stepwise “staircase” to modern groups, are now classified into a restricted number of morphogroups. This study proposes to solve this paradox by associating morphological patterns with macroevolutionary models; namely, two moving adaptive landscapes with displaced optima (one for panchelicerates, one for total-group mandibulates; sensu Estes and Arnold Reference Estes and Arnold2007) associated with increased canalization, and occasional “quantum leaps,” mostly induced by terrestrialization events. Stem or basal crown morphogroups can represent radiations around intermediate adaptive peaks, but genetic and morphoanatomical properties define the robustness of body plans, not their survivability until the present time.
Although the environmental triggers of the Cambrian explosion are still a matter of debate (Peters and Gaines Reference Peters and Gaines2012; Chen et al. Reference Chen, Ling, Vance, Shields-Zhou, Zhu, Poulton, Och, Jiang, Li, Cremonese and Archer2015), perhaps its swiftness, now arguably constrained to the early Terreneuvian (Daley et al. Reference Daley, Antcliffe, Drage and Pates2018; Paterson et al. Reference Paterson, Edgecombe and Lee2019), should not be considered a complete mystery anymore. The evolution of arthropods, investigated quantitatively, comes to support the idea that this event corresponded to the fast buildup of the regulatory genetic machinery as a strong constraint on the overall fitness of taxa. This critical and unique event underlies the stability of body plans over the Phanerozoic and, in conjunction with adaptive landscape models, can explain the commonality of stasis patterns. There is therefore no need to posit that cladogenesis predated the Cambrian explosion (Fortey et al. Reference Fortey, Briggs and Wills1996), and the inconsistency of molecular clocks in constraining the origin of arthropods and other metazoans (Erwin et al. Reference Erwin, Laflamme, Tweedt, Sperling, Pisani and Peterson2011; Lee et al. Reference Lee, Soubrier and Edgecombe2013; Cunningham et al. Reference Cunningham, Liu, Bengtson and Donoghue2017) could be simply due to the fact that the evolutionary models used are not yet capable of reproducing the strong rate heterogeneity and complexity that characterizes the early canalization of metazoan genomes.
It was shown here how resampling can profoundly change disparity metrics, in the same way as this method can contribute to new perspectives on biodiversity curves (Alroy Reference Alroy2010). It was also shown that single or average estimates of disparity should be interpreted with caution, because each metric potentially reflects a different aspect of morphological diversity; in that sense, different disparity metrics are not simply different approximations, with their own caveats, of the same variable (Wills et al. Reference Wills, Briggs and Fortey1994; Ciampaglio et al. Reference Ciampaglio, Kemp and McShea2001). Future works should try to evaluate more precisely the evolutionary significance of each metric, implementing them, for instance, in multivariate tests as explanatory factors of evolutionary rates.
Modularity, in the general sense, is a concept naturally taking on greater importance when considering morphological evolution in light of the role of regulatory pathways on the expression of the genome. In this case also, the idea of modularity, when looking at an entire phylum, needs to be decomposed into different manifestations of decoupled phenotypic evolution. The best approach is probably to investigate the covariance of morphological characters in detail. Importantly, the upcoming challenge will be to try and link global phenotypic patterns with case studies of morphological constraints, as was done in particular for trilobites (e.g., Hughes Reference Hughes1991; Hughes Reference Hughes2003; Gerber and Hopkins Reference Gerber and Hopkins2011).
Data Availability
Data from Lee et al. (Reference Lee, Soubrier and Edgecombe2013) are used as provided by the authors. New fossil-inclusive morphological matrix and newly calculated rates and disparity metrics are provided as Supplementary Material. Full R code available upon request.
Acknowledgments
I thank J.-B. Caron, D. Briggs, M. Cadotte, S. Kvist, and L. Mahler for helpful discussions. I am also grateful to L. Revell for tips regarding the construction of the philomorphospace. N. Hughes and an anonymous referee provided perceptive, constructive comments that helped significantly improve the quality of this paper. This work was, in its initial form, part of a Ph.D. thesis submitted in 2017 and was supported by fellowships from the University of Toronto (Department of Ecology and Evolution) and J.-B. Caron's Natural Sciences and Engineering Research Council Discovery Grant (no. 341944).