

1. Introduction
It is well known that in a Walrasian economy setting, competitive equilibrium exhibits desirable properties from a social standpoint. Besides the absence of inefficiencies, stemming from the hypotheses of perfectly competitive and complete markets, there are two other consequences almost neglected in the traditional economic analysis. The first one is that the ownership of enterprises (i.e., the class of stakeholders to whom firms’ property rights are assigned) is completely irrelevant in terms of economic efficiency (e.g., Drèze, Reference Drèze1976). In a world of complete contracts like the Walrasian framework, whether workers or investors are the firms’ owners does not affect the efficiency of the optimal equilibrium allocation. The second consequence, easily obtainable from the first one, is that how firms are financed does not impact on economic efficiency (the renowned Modigliani and Miller theorem, Reference Modigliani and Miller1958). In other words, since workers’ or investors’ ownership produces no effects on efficiency, a worker-owned co-operative completely financed with debt is indistinguishable – from an efficiency viewpoint – from an investor-owned stock company completely financed with own capital.
The striking feature of this economy without imperfections is that the existence of different ‘contracts’ envisaged by the law is difficult to explain in terms of economic efficiency. To put it starkly, suppose that the Walrasian model is a good positive theory; thence, whether firms are organized in the form of a joint stock company or a partnership (and whether the joint stock company is investor-owned and the partnership worker-owned) is totally irrelevant for the efficiency properties of the equilibrium outcome. However, when one explicitly recognizes contracts incompleteness and the existence of various forms of transaction costs, previous conclusions dramatically change. According to the theoretical literature, in a world where transaction costs exist, firms’ owners do affect the equilibrium outcome, and ownership is regarded as one mean (among others) to provide incentives to different stakeholders (e.g., Hansmann, Reference Hansmann1988, Reference Hansmann1996; Holmstrom and Milgrom, Reference Holmstrom and Milgrom1994). The common idea underlying these contributions is that the observed pattern of ownership (if we exclude explicit provisions and limitations by the law) should be guided by economic principles of efficiency. Hence, ownership should be assigned to the class of stakeholders that minimizes the overall transaction costs involved in the nexus-of-contracts established by the firm. From an empirical point of view, the observed pattern of ownership seems indeed to be linked to the existence of different categories of transaction costs (e.g., Hansmann, Reference Hansmann1996, for US; Pittatore and Turati, Reference Pittatore and Turati2000, for the Italian case).
The theoretical proposition implicit in the results provided by this literature (Hansmann Reference Hansmann1988, Reference Hansmann1996; Holmstrom and Milgrom, Reference Holmstrom and Milgrom1994) is that different ‘contracts’ – by implying different owners of the firms – are characterized by different levels of transactions costs; hence, firms are characterized by different levels of economic efficiency. This theoretical proposition can be tested exploiting the literature on production and cost frontiers estimation (e.g., Lovell, Reference Lovell, Fried, Lovell and Schmidt1993, for a survey). After estimating a common frontier for all the firms operating in a certain industry, one can easily obtain average measures of economic inefficiency characterizing each ‘contract’.
Given the availability of the relevant data and the presence of different ‘contracts’, an industry that can be particularly fruitful for this kind of analysis is the banking industry. In Italy (but the situation is similar to other countries as well; see, e.g., Fonteyne, Reference Fonteyne2007, on Europe, and Altunbas et al., Reference Altunbas, Evans and Molyneux2001, for the German banking industry) at least three different types of organizations operate in the market: private commercial banks (stock banks), and two different types of co-operative banks, namely the Banche Popolari and the Banche di Credito Cooperativo. The striking difference among the three groups is the class of stakeholders to whom property rights are assigned. In Italy, these stakeholders are respectively investors, workers, and borrowers. Besides the class of owners, other differences among the three types of ‘contracts’ can be observed: for instance in terms of the transaction costs for both depositors and borrowers, of the ‘lending technology’, of the size and branching, and of the governance structure. All these elements, in principle, can influence banks’ efficiency, and can characterize each contract as a specific institution.
In this paper, I propose an empirical test of the theoretical prediction that different ‘contracts’ are characterized by different levels of efficiency using data on the Italian banking industry. After briefly reviewing the theoretical literature and considering the transaction costs relevant for the different stakeholders, I estimate a common cost frontier and compare average levels of inefficiency among the three different groups of firms active in the Italian banking market. The main result is that different ‘contracts’ are indeed characterized by different levels of overall inefficiency, and this reflects a pure organizational effect (i.e., robust also after controlling for a size effect). Hence, the different ‘contracts’ designed by the law seem to be helpful in solving an economic efficiency problem, providing economic agents different specific institutions.
The paper is linked to at least two different strands of literature. As it represents an exercise to empirically assess the validity of the theoretical approach that looks at firms as ‘incentive structures’, it falls within the empirical research in transaction costs economics (e.g., Shelanski and Klein, Reference Shelanski and Klein1995, and Masten, Reference Masten2002, for a survey; Carter and Hodgson, Reference Carter and Hodgson2006, for a critical review). However, differently from the basic empirical model that considers the organizational form as the dependent variable, here I estimate a cost frontier and look at differences in the levels of inefficiency across different types of firms. The basic idea is to consider inefficiency as a proxy measure for transaction costs typifying each organization, and to show that different organizations are indeed characterized by different levels of transactions costs.
As it is based on data about Italian banks and uses established methodologies to measure efficiency, the paper is also related to the huge research on efficiency and its determinants in banking. Berger and Mester (Reference Berger and Mester1997) provide a survey of this literature, by concentrating on the different concepts of efficiency, the different measurement techniques, and the potential correlates with efficiency scores. This paper employs the cost efficiency concept and the parametric approach to analyse the potential role of the organizational structure (mutual versus stock) as a determinant of bank efficiency. The novelty within this literature is the use of Italian data: similar exercises have been already provided, for example, by Altunbas et al. (Reference Altunbas, Evans and Molyneux2001) using German data, and by Mester (Reference Mester1993) considering the US savings and loans industry.
The remainder of the paper is structured as follows. In Section 2, I briefly discuss the theoretical literature on the modern theory of the firm as an ‘incentive structure’ within the context of the banking industries, in order to define a theoretical framework useful for the empirical analysis. Section 3 is devoted to the empirical methodology and to data description, while Section 4 discusses the results. Section 5 summarizes the main conclusions.
2. Theoretical background: social transaction costs in banking
I work here on the general theoretical approach proposed separately by Hansmann (Reference Hansmann1988, Reference Hansmann1996) and Holmstrom and Milgrom (Reference Holmstrom and Milgrom1994) that models firms as ‘incentive structures’. The basic intuition of this theoretical approach is that all stakeholders bear transaction costs when they relate to firms, both through contracts as non-owners, and through ownerships’ rights when they are the owners. Each firm in the economy can assume a number of different organizational structures, by choosing among the different ‘contracts’ envisaged by the law. An organizational structure is defined as an allocation of the firms’ property rights to a specific class of stakeholders sj. Since this allocation influences the incentives of the remaining classes, we are in a world where – following Holmstrom (Reference Holmstrom1999) – there are ‘contractual externalities’, and the Coase theorem applies.
The social transaction costs SC associated to a firm when the class sj is the class of stakeholders to whom property rights have been assigned can be defined as:
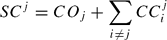
where CO are the transaction costs associated to stakeholders sj for being the owners of the firm (the costs of ownership), and CC are the transaction costs faced by the remaining si ≠ sj stakeholders for their contractual relations with the firm (the costs of contracts) when the stakeholders sj are the owners.
There are different types of costs of contracts and costs of ownership, i.e. different types of inefficiencies with respect to a frictionless world.Footnote 1 Here I follow Hansmann, who defines three main categories for both the costs of contracts and the costs of ownership. The costs deriving from the existence of ex-ante and ex-post market power and from the existence of asymmetric information represent the main costs of contracts. The costs of controlling managers (in all the firms where ownership and control are separated), the costs related to collective decision making, and the costs stemming from risk bearing are the main costs of ownership. Note that these are all categories of transaction costs well known in the economic literature. For instance, the transaction costs inherent in the existence of ex-ante market power simply resemble the inefficiency related to monopoly and other non-competitive market structures, namely higher prices and lower quantities for buyers with respect to the efficient competitive equilibrium. The existence of asymmetric information brings about transaction costs deriving from both adverse selection and moral hazard. The costs of controlling managers are well represented by all the normative solutions designed to solve the standard principal–agent problem, and to provide incentives to agents operating inside a firm. The difference with the previous literature is that all these transaction costs are now considered together in order to define the social transaction costs for all the stakeholders (i.e., the sum of all inefficiencies characterizing an organization).
When one moves from the general theoretical framework developed by Hansmann to the banking industry, it must be recognized that a unified analysis of the transaction costs related to each class of stakeholders of a bank is lacking.Footnote 2 There are, of course, numerous contributions that study the transaction costs (and the possible normative solutions) for depositors and borrowers, probably the two most important classes of stakeholders when thinking of a bank. Diamond (Reference Diamond1984) is a common reference in this case. The author shows that – given asymmetric information between lenders and borrowers – a financial intermediary (i.e., an organization that collects funds from depositors and lends these funds to entrepreneurs) has a cost advantage in monitoring and enforcing a financial contract of debt with respect to direct lending. A financial intermediary enjoys returns to scale in producing monitoring effort, and these cost savings exceed the delegation costs (i.e., the transaction costs that sustain depositors, who ‘delegate’ the bank to monitor on their behalf the contract with the entrepreneur). An interesting point in Diamond's analysis, not sufficiently stressed in the literature, is that two different models of financial intermediary are economically viable: ‘one model increases the number of agents working together within the intermediary organization as the intermediary monitors a larger number of entrepreneurs. The second model assumes that the intermediary consists of a single agent who monitors a large number of entrepreneurs with independent projects’ (see Diamond, Reference Diamond1984: 404). Even though Diamond does not recognize this explicitly, it seems possible to relate the first type of intermediary to the model of a co-operative bank, where the agents working together within the organization are simply the borrowers. For instance, Banerjee et al. (Reference Banerjee, Besley and Guinanne1994) refer to this model as an organizational structure characterized by peer monitoring among the members of the co-operative.Footnote 3 Notice that, in this case, each borrower has the incentive to monitor fellow borrowers, providing – in turn – higher incentives to repay the loan. In Hansmann's terminology, this ‘risk sharing’ model of a bank is that of an organization in which the property rights are assigned to borrowers. On the contrary, the second model of financial intermediary envisaged by Diamond is that of a typical stock bank, an organization owned by investors.
The costs of contracts
Assigning ownership to a certain class of stakeholder changes the cost of contracts for the remaining classes. Let us consider three different groups of stakeholders: providers of external finance (depositors and other investors), borrowers, and workers, which help identify the three patterns of ownership for banks operating in the Italian markets (i.e., respectively, stock-banks, Banche di Credito Cooperativo, and Banche Popolari). When depositors and other providers of funds to be invested are not the owners, they clearly face costs deriving both from the existence of market power and from the existence of asymmetric information in the use of funds. The banking literature has focused mainly on the second category, generally looking for normative solutions. For example, Diamond (Reference Diamond1984) proves that when depositors delegate monitoring to a bank, the debt contract is the optimal contractual solution. Rajan (Reference Rajan1998), surveying the incomplete contract approach to banking, suggests that fractional reserve banking was a second-best solution to protect depositors against the misappropriation of funds from the banker. The introduction of deposit insurance schemes displaced this organizational arrangement, as observed also by Rasmusen (Reference Rasmusen1988), who argues that assigning ownership to depositors is a solution that helps explain the historical evidence on the evolution of banking in the United States.
However, when depositors and other investors are the owners, they can draw on an array of normative solutions (including monitoring) to partially overcome problems of adverse selection and moral hazard. These solutions include the request for collateral, the signalling power of the personal capital of the entrepreneur directly invested in the project, and the borrower's reputation. Obviously, all these solutions are costly for borrowers; but one needs to distinguish between two broad categories of borrowers, namely large firms and small firms. These two categories are characterized by a different level of opacity of the relevant information for the banker. In particular, while information on large firms is usually available in the form of financial statements (the so-called ‘hard’ information), information on small firms is not, and must be gathered by the loan officer over the course of the relationship (the so-called ‘soft’ information). This enables large firms to collect funds also directly from the market, whilst small firms are highly dependent on internal finance and bank debt as a primary source of external finance (see, e.g., Berger and Udell, Reference Berger and Udell2002); hence, small firms bear a higher volume of transaction costs than large ones. These transaction costs are higher also if one thinks of the other normative solutions that can be used by investors and depositors to mitigate the problems of asymmetric information: small firms do not typically have real assets to be used as collateral, they are characterized by a lower level of capitalization, and they lack reputation on traditional banking markets. In all these cases, developing a relationship with a bank might represent a possibility for small firms to obtain funds. However, Angelini et al. (Reference Angelini, Di Salvo and Ferri1998) point out two different theoretical effects stemming from developing such a relationship. On the one hand, there is a virtuous effect on the price and the availability of credit, since more information becomes accessible the longer is the relationship; this contributes to decreased transaction costs for borrowers. On the other hand, small firms become ‘informationally captured’, and the bank can exploit this rent by worsening contractual conditions; this effect works in the direction of increasing the transaction costs for borrowers.
The last category of stakeholders that can contract with a bank is that of workers. However, cost of contracts seems to be relatively low for this group, since it is reasonable to think of a competitive labour market also for bank employees. On the contrary, workers are responsible for increasing costs of ownership for the owners, a category of transaction costs to which now I turn.
The costs of ownership
Beside the costs of contracts, social transaction costs include the costs of ownership. In this case, the most important differences arise between small local banks and banks with a large network of branches, a typical discrepancy between borrower-owned co-operative banks (like the Banche di Credito Cooperativo in Italy), and stock banks. Of course, the larger the organization, the more important the agency problems of controlling managers and workers, and of delegating authority within the organization when the ownership is in the hands of borrowers or investors. On the contrary, this argument loses some of its power when ownership is assigned to workers, as in the original model of Banca Popolare in Italy. However, following Hansmann, it is worth noting that if there are substantial differences among workers’ tasks (and this is more likely the larger and more layered the bank), then the costs of collective decision making could be increased. This is mostly important when banks are organized as co-operatives, due to their particular governing structure (the voting mechanism and the mechanisms for selecting new members that makes the choice highly discretionary).Footnote 4 Finally, as far as the managers are concerned, Rasmusen (Reference Rasmusen1988) recalls that assigning property rights to investors/depositors partially contributes to solve agency problems, because managers have incentives to pursue a safe investment policy in order to maintain their rents.Footnote 5
The dimension of the bank influences not only the transaction costs arising within the organization for the agency relationships, but also the ability of the bank to collect, process, and use different kinds of information. In particular, an argument put forward by Berger and Udell (Reference Berger and Udell2002) suggests that there is an organizational diseconomy of scale in activities requiring the use of ‘soft’ information. Small banks reduce agency costs in the use of this kind of information with their loan officers, by eliminating layers of management. Moreover, the banks’ president usually has very tight links to the local community, and this further helps mitigate the problems. On the contrary, large banks alleviate the agency costs by reducing the amount of relationship lending, hence reducing the delegation of authority within the organization. Indeed, Berger et al. (Reference Berger, Miller, Petersen, Rajan and Stein2001) find empirical support for this argument, by showing that large banks develop relationships that are more impersonal with their borrowers than small banks.
The size and the organization of banks are relevant also in explaining transaction costs related to collective decision making. While for investors, this category of costs is relatively small compared to other transaction costs, it can be very important for both workers and borrowers, especially when the group of owners is characterized by heterogeneous preferences. This is likely to happen in the presence of small and large borrowers, or of bank-tellers, bookkeepers, and branch managers. In all these cases, heterogeneous preferences can lead to inefficient decisions, and make the decision process really troublesome.
The social transaction costs
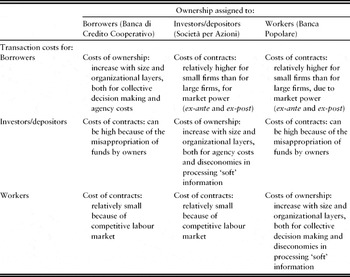
Before turning to the empirical part of the paper, I try now to put together all these suggestions from the theoretical literature to find an explanation of when the co-operative solution (and, in particular, the borrowers owned co-operative) can constitute a socially efficient incentive structure for a bank (since it minimizes the sum of all the inefficiencies related to the organization). Table 1 provides a structured map of transactions costs for different stakeholders in the presence of three different types of banks: a borrower-owned co-operative bank (i.e., the Banca di Credito Cooperativo in Italy), an investor-owned bank (i.e., a stock bank, or Società per Azioni), and a worker-owned credit co-operative (i.e., the Banca Popolare). Several considerations emerge from observing this map. First, transaction costs characterizing the three organizations are different; hence, the efficiency losses characterizing each organization are different. Second, by looking at the costs of ownership, assigning property rights to workers and borrowers is less likely the more layered is the organization, because of higher transaction costs related to collective decision making. On the contrary, the costs of ownership are problematic for investors because of agency costs, and the diseconomies in processing ‘soft’ information when the bank's size increases. Third, turning to the costs of contracts, these are usually small for workers, making their ownership almost always an inefficient solution in banking. On the contrary, considering borrowers, these costs can be extremely high for small firms, because of the need to process ‘soft’ information. And the same is true for investors/depositors, because of the possible misappropriation of funds by the owners.
Social transaction costs in banking for different allocations of property rights

When then are borrower-owned credit co-operatives an efficient institutional arrangement? In terms of transaction costs for investors, the literature suggests that small business lending is the most costly activity for banks, due to the need of collecting ‘soft’ information. The co-operative contract limits these costs by assigning ownership to borrowers, and favouring the peer monitoring among co-operative members. Given the need to collect ‘soft’ information, the organization must be small and locally based: this is guaranteed by the particular governing structure envisaged by the law, in particular by the voting mechanism and the process of selecting new members. Hence, from a theoretical point of view, the co-operative contract seems to define an optimal incentive structure for a lending activity based on ‘soft’ information among peers. Whether the volume of social transaction costs involving the co-operative contract is higher than that characterizing stock ownership is, however, not possible to define a priori. In the empirical part of the paper, to which now I turn, I provide a measure of social transaction costs by exploiting the literature on cost frontier estimation, and test:
(a) whether the three types of banks are characterized by different levels of social transaction costs (i.e., of economic efficiency);
(b) which of the three types is characterized by the lower level of social transaction costs.
3. The empirical analysis
The methodology
To empirically assess whether the co-operative bank really constitutes a different incentive structure with respect to the stock bank, and is characterized by a lower level of efficiency losses, I exploit the literature on frontiers estimation (e.g., Lovell, Reference Lovell, Fried, Lovell and Schmidt1993, for a survey). Since the basic test is whether the two ‘contracts’ are characterized by different levels of efficiency (hypothesis (a) above), I estimate a common frontier and compare the average levels of efficiency characterizing the types of banks operating in the Italian market. I assume that banks have access to a common stochastic technology in the production of banking services, represented by the following ‘extended’ production set:

where y and x represent respectively the vector of outputs and the vector of inputs; SC j are the social transaction costs related to the organization when property rights are assigned to the class of stakeholders sj;Footnote 6 ϵ represents pure random noise that picks up the impact of variables outside the control of the firm (plus potential measurement errors that could plague the data). This approach resembles Jensen and Meckling (Reference Jensen and Meckling1979), who argue that ‘the maximum attainable output of a firm is . . . not purely a matter of ‘physical’ possibilities given the technology and knowledge; the production function depends on the contracting and property-rights system within which the firm operates’.
In the empirical analysis of the banking industry, it is often argued that a common frontier approach is misleading, because it can cause the researchers to confuse technological differences with inefficiency. However, as the theoretical discussion on the firm as an incentive system should have made clear, organizational differences reflect choice variables of banking firms, and not differences in the production set. In other words, this means that having access to a common ‘extended’ production set, each bank chooses the ownership structure and the organizational structure (that together define its objective function), beyond inputs and outputs of the production process.Footnote 7 A similar argument is made by Altunbas et al. (Reference Altunbas, Evans and Molyneux2001); they state that ‘if a priori all firms are faced with the same opportunities to combine labor, physical capital and financial capital to produce outputs that are virtually identical, then the adoption of a technology that results in higher costs or lower profits is the result of a management choice’.
Here I model the banking production process described by equation (2) following the so-called ‘intermediation approach’ proposed by Sealey and Lindley (Reference Sealey and Lindley1977). I assume that banks use labour (L), physical capital (K), and deposits (D) as inputs in order to produce three outputs: loans (LO) and investments in securities (OEA) that together define the traditional activity of banks, plus financial services for customers (SER), as part of the innovative activity of commercial banks.
From the production function represented in equation (2), it is easy to derive the associated cost frontier:

where w represents the input price vector and the remaining variables are defined as before. Besides the hypothesis of a common production set, concentrating on a common cost frontier requires that the objective function of all the types of banks operating in the industry incorporate total cost minimization. While this is commonly accepted as true for stock banks (even though the separation between ownership and control can make the objectives of managers diverge from those of the owners), it is sometimes questioned in the literature for co-operative banks. An argument frequently mentioned is that while market forces are expected to discipline managers who run stock banks to minimize costs, the same does not apply to managers of co-operative banks. However, this does not need to be true, and other mechanisms (for instance, reputation) can be at work in a co-operative bank to discipline managers that usually share special connections with the local community. Moreover, as also Altunbas et al. (Reference Altunbas, Evans and Molyneux2001) note, ‘competition between banks is likely to emphasize cost minimization as an important managerial objective’; and competition intensified in the Italian banking markets during the 1990s.
I specify equation (3) as a standard translog cost frontier. The specification to be estimated can then be written as:
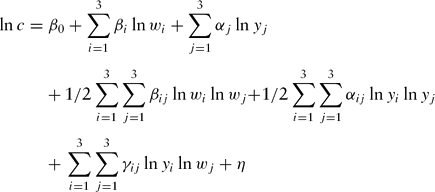
where the input price vector is w = [wL, wK, wD], the output vector is y = [LO, OEA, SER], and η is a composed error term that includes both inefficiency (the social transaction costs) and pure random noise. Homogeneity of degree one in prices requires the following restrictions on the parameters of the cost function:

whereas equality of cross partial derivatives entails αij = αji and βij = βji. As is usual in the literature, I impose both sets of restrictions in equation (4).
From equation (4), one can also derive indicators for scale and scope economies. In particular, returns to scale characterizing production can be obtained by considering global elasticity of size:
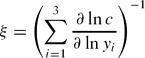
ξ > 1 (ξ < 1) implies that the bank is operating under increasing (decreasing) returns to scale; hence, the optimal production scale can be obtained by increasing (decreasing) the volume of funds intermediated.
Scope economies between output yi and yj can instead be measured by considering the definition of cost complementarities (in this sense, e.g., Ferrier and Lovell, Reference Ferrier and Lovell1990):

Scope economies (diseconomies) between output yi and yj exist whenever ζ < 0 (ζ > 0).
The data
The empirical analysis is based on a sample of more than 700 Italian banks in 1999. Data are obtained from the BilBank 2000 database managed by the Italian Association of Banks (Associazione Bancaria Italiana). It includes banks’ balance sheet information on three different types of banks, namely stock banks (Società per Azioni, SPA), and two types of co-operatives (Banche Popolari, POP, and Banche di Credito Cooperativo, BCC). The final sample includes 175 SPA, 39 POP, and 495 BCC; this reproduces pretty well the presence of each type of bank in the Italian markets.
The three types of banks are characterized by different contracts regulated in the Italian Civil Code. This, in turn, implies other differences, for instance with respect to the group of stakeholders who own the firm, size, and balance sheet structure. As for the group of stakeholders who own property rights, as already mentioned above, the literature usually recognizes that SPA are investor-owned firms, POP are worker-owned co-operatives, and BCC are borrower-owned co-operatives. Notice that these ownership structures are sustained also by the particular governing mechanisms envisaged by the law. In the typical stock bank, every share carries one vote; but, in the typical co-operative contract, every member has one vote. This reflects also the historical roots of the co-operative movement, discussed for instance by Fonteyne (Reference Fonteyne2007), to help solve a number of market imperfections. However, an important distinction has to be made between the two types of co-operatives operating in Italy: while BCC maintained their mutual nature, the latest regulation on POP strongly mitigated their mutualistic aim. On the one hand, as Presti (Reference Presti1998) puts it, the Italian Banking Law (T.U. Bancario) does not prescribe the mutualistic aim for the Banche Popolari, and does not stress those rules that are normally used in the general law either to favour it or to compress the lucrative aim. On the other hand, the mutual nature of BCC is emphasized by two provisions: (a) loans must be granted mostly (even if not only) to members (which makes the BCC a contractual arrangement very close to the theoretical model of an organization characterized by peer monitoring); (b) acceptance of new members is highly discretionary, and this contributes to sustaining a homogeneous membership (see, e.g., Angelini et al., Reference Angelini, Di Salvo and Ferri1998; Presti, Reference Presti1998).
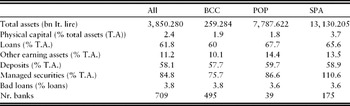
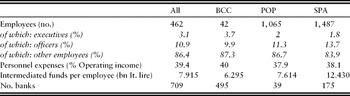
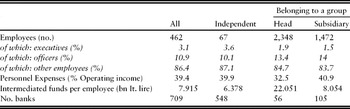
Other differences between the two types of co-operative banks and the stock banks can be spotted by looking at the data. For instance, BCC are very small compared both to POP and to SPA, either when considering total assets (Table 2a) or when considering the number of employees (Table 3a); their small dimensions emphasize their local nature. The balance sheet structure is also different: BCC employ a lower share of total assets in loans and other earning assets with respect to the other two types of banks, probably because of more prudential managerial choices that, however, are not apparently reflected in the proportion of bad loans (Table 2a).
Descriptive statistics (mean values, 1999)

Note: BCC = borrower-owned cooperative; POP = worker-owned cooperative; SPA = investor-owned bank.
Source: our calculations on BilBank data.
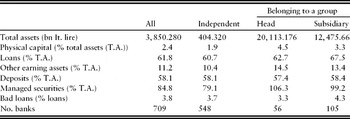
Descriptive statistics (mean values, 1999)

Source: our calculations on BilBank data.
Descriptive statistics: personnel (mean values, 1999)

Note: BCC = borrower-owned cooperative; POP = worker-owned cooperative; SPA = investor-owned bank.
Source: our calculations on BilBank data.
Descriptive statistics: personnel (mean values, 1999)

Source: our calculations on BilBank data.
A relevant difference concerns the composition of employment in the three organizations: BCC have the highest share of executives and the lowest share of officers; hence, the distance between the two extreme layers of the organization seems to be reduced in BCC (Table 3a). A huge diversity is observed also for profitability as measured by the ROE: the lowest performance is obtained by BCC with 3.27%, whereas POP obtained 9.94% and SPA 8.07%. Again, this seems to reinforce the idea that while BCC are still characterized by a mutualistic structure, POP are not.
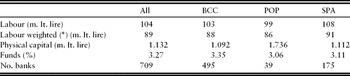
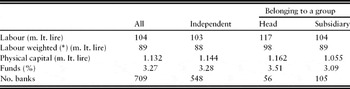
Estimation of the cost function in equation (4) requires the definition of the input price vector w = [wL, wK, wD] and the output vector y = [LO, OEA, SER]. Following the literature on banks’ efficiency, price of labour has been obtained by dividing personnel expenses by the number of employees. As the structure of employment is different among the three types of banks, I also computed a weighted price of labour by assuming that executives’ compensation is three times the basic compensation, and officers’ compensation is two times the basic one. Price of physical capital is simply the ratio between administrative expenses and the book value of fixed assets, while price of funds is the ratio between total interest expenses and the volume of funds. Mean values for input prices are collected in Table 4a: only narrow differences can be observed with respect to input prices faced by the three types of banks; one exception is represented by the higher price of physical capital for POP with respect to both BCC and SPA. As far as the outputs are concerned, LO and OEA are represented respectively by the total aggregate loans and the total aggregate securities, whereas SER are proxied by the total aggregate securities managed for clients, an off-balance sheet item that is directly related to the flow of services supplied to customers.
Descriptive statistics: input prices (mean values, 1999)

Note: BCC = borrower-owned cooperative; POP = worker-owned cooperative; SPA = investor-owned bank.
Labour = Personnel expenses/No. employees; Physical capital = administrative expenses/book value of fixed assets; Funds = total interest expenses/volume of funds.
Source: our calculations on BilBank data. (*) Considering the number of executives, officers and other employees.
Descriptive statistics: input prices (mean values, 1999)

Note: Labour = Personnel expenses/No. employees; Physical capital = administrative expenses/book value of fixed assets; Funds = total interest expenses/volume of funds.
Source: our calculations on BilBank data. (*) Considering the number of executives, officers and other employees.
4. Results
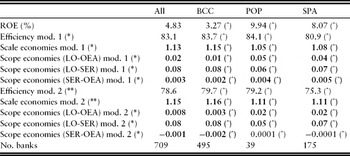
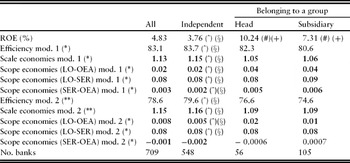
I estimate the cost function in equation (4), and I derive individual cost efficiency scores following the methodology introduced by Jondrow et al. (Reference Jondrow, Lovell, Materov and Schmidt1982).Footnote 8 These cost efficiency scores are a proxy for the social transaction costs characterizing each organization. Mean values for the efficiency scores are collected in Tables 5a–5c: model 1 considers the non-weighted price of labour, whilst model 2 considers the weighted price of labour. The correlation between the two set of estimates is 0.92; hence, results obtained from model 1 are in accordance with those obtained from model 2. BCC and POP, the two types of co-operatives banks operating in the Italian market, are more efficient than SPA (Table 5a). As BCC are independent banks, this result is also reflected in the finding that independent banks are more efficient than banks belonging to a group (Table 5b).
Profitability, efficiency, scale and scope economies (mean values, 1999)

Notes: (*) Using non-weighted price of labour.
(**) Using weighted price of labour.
(^) Indicates that group specific means (BCC, POP, SPA) are stat. diff. at the 5% lev. according to Kruskall-Wallis test.
Bold typeface for values indicates significantly different from 1 and 0 (respect. for scale econ. and scope econ.) at the 5% lev. (t-test).
LO = loans; OEA = other earning assets; SER = securities managed for clients.
Source: our calculations on BilBank data.
Profitability, efficiency, scale and scope economies (mean values, 1999)

Notes: (*) Using non-weighted price of labour. (**) Using weighted price of labour.
(^) Indicates that group specific means (INDEP., GROUP) are stat. diff. at the 5% lev. according to Mann–Whitney test.
(§) Indicates that group specific means (INDEP., GROUP) are stat. diff. at the 5% lev. according to Kolmogorov–Smirnoff test.
(#) Indicates that group specific means (HEAD, SUBS.) are stat. diff. at the 5% lev. according to Mann–Whitney test.
(+) Indicates that group specific means (HEAD, SUBS.) are stat. diff. at the 5% lev. according to Kolmogorov–Smirnoff test.
Bold typeface for values indicates significantly different from 1 and 0 (respect. for scale econ. and scope econ.) at the 5% lev. (t-test).
LO = loans; OEA = other earning assets; SER = securities managed for clients.
Source: our calculations on BilBank data.
Profitability, efficiency, scale and scope economies (mean values, 1999)

Notes: (*) Using non-weighted price of labour. (**) Using weighted price of labour.
(^) Indicates that group specific means are stat. diff. at the 5% lev. according to Kruskall–Wallis test.
Bold typeface for values indicates significantly different from 1 and 0 (respect. for scale econ. and scope econ.) at the 5% lev. (t-test).
LO = loans; OEA = other earning assets; SER = securities managed for clients.
Source: our calculations on BilBank data.
However, since no clear theoretical results are available on the relative ranking of the different ‘contracts’, the main prediction to be tested here is that different incentives structures are characterized by different transaction costs, i.e. by different levels of economic efficiency (hypothesis (a) above). I test this prediction by simply checking whether group-specific means are statistically different. Indeed, the Kruskall–Wallis test indicates that mean efficiency scores are statistically different among SPA, POP, and BCC at the 5% level of significance. Thence, different organizations seem to constitute different incentives structures in the banking market.
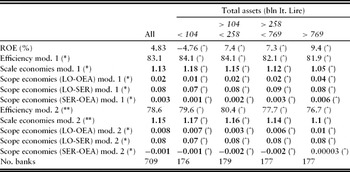
An interesting point to be made is that these differences probably stem from the ownership structure, which influences – for instance – the structure of employment, and the size of the bank. From Table 5b, one can see that efficiency score means are statistically different between independent banks and banks belonging to a group, but differences are not statistically significant between head and subsidiary banks. On the contrary, from Table 5c – that collects efficiency scores for banks classified according to their size – group-specific means are statistically different among all classes. Since relationship banking is related to the size of the organization, it would be important to understand whether the higher efficiency stems from the loan technology or is related to other factors (on this point, see the recent contribution by Berger and Udell, Reference Berger and Udell2006). Lacking the relevant data, I do not explore this issue further here.
As expected, BCC are found to operate under increasing returns to scale in both models, whereas POP and SPA can exploit only marginal economies of scale; on the contrary, scope (dis)economies are very small for all the three types of banks (Table 5a). As can be seen from Table 5c, economies of scale are clearly related to banks’ size. By coupling this last result with efficiency scores, one is then left with the conclusion that the efficiency gains from increasing bank's size are lower than the efficiency losses stemming from the agency relationships in a more layered organizational structure.
A second-stage analysis
The preceding analysis suffers from one main shortcoming: it does not take into account that results may be driven by the correlation between organizational structure and the size of banks. If smaller banks are the most efficient and choose also to organize themselves as co-operative banks, then the fact that co-operative institutions are more efficient may simply result from their size, and does not reflect any organizational advantages. Indeed, differences in size are often quoted when discussing banks’ heterogeneity. For instance, Dewatripont and Tirole (Reference Dewatripont and Tirole1994) explicitly refer to the differences between small and large banks, and not to differences in the organizational structures. These authors also point out that large banks have a different asset composition, they are more involved in off-balance sheet activities, they use more managed liabilities, and they have lower interest margins. Notice that these are some of the differences between co-operative banks and stock banks previously discussed in Section 3.2.
To test if there are pure organizational advantages stemming from the co-operative contract, one needs to show that – controlling for size – co-operative banks are more efficient than stock banks. To this aim, I then regress efficiency scores obtained with the two models against a set of covariates, including both proxies for size and organizational dummies. In particular, given the nature of the data (EFFi ≥ 0), I consider the following tobit model:

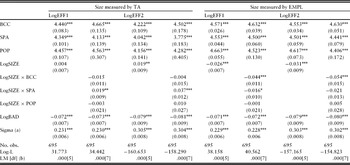
where the vector X includes controls for size, organizational structure, and the quality of credit policies, and u is a N(0, σ2) error term. Estimates of model (8) are in Table 6. The emerging picture is fairly consistent across all specifications, showing how efficiency correlates with variables in X.Footnote 9 Coefficients on organizational dummies are always significant, suggesting that – after controlling for a proxy for size – there are indeed differences related to contracts in terms of social transaction costs. This confirms previous results on the different roles played by the different contracts envisaged by the Civil Code. Quite interesting findings emerge however also for size. First, when size is proxied by the volume of total assets, I find a positive correlation with efficiency, but that is statistically significant only for stock banks (only the coefficient on the interaction term Log(Size) × SPA is positive and significant). Second, when size is proxied by the number of employees, a negative correlation with efficiency emerges, but that is statistically significant only for co-operative banks, and marginally significant for stock banks. This differential impact of the two proxies for size seems indeed to reinforce the interpretation of efficiency scores as a measure of transaction costs: as for stock banks, the result emphasizes the role of scale economies; as for co-operative banks, the finding points toward the role of agency relationships within the organization. In the former case, the result suggests that – given the choice of organizing the bank as a stock company – efficiency gains can be obtained by increasing the volume of assets intermediated. On the contrary, in the latter case – given the choice of organizing the bank as a co-operative firm – efficiency gains can be obtained by limiting the number of agency relationships within the organization. Finally, bad loans as a share of total loans do have a significant negative correlation with efficiency scores, confirming previous results in the literature that more frail banks, with poorer credit policies, also are the less efficient institutions (e.g., Wheelock and Wilson, Reference Wheelock and Wilson1995).
Second-stage analysis: the determinants of efficiency

Notes: (a) Estimated St.Dev. of disturbance term
(b) p-value and degrees of freedom of LM test for model
Note: BCC = borrower-owned cooperative; POP = worker-owned cooperative; SPA = investor-owned bank.
SIZE = total assets (TA) or number of employees (EMPL); BAD = bad loans/total loans
EFF1 = efficiency scores from Model 1 (unweighted price of labour); EFF2 = efficiency scores from Model 2 (weighted price of labour)
5. Conclusions
The basic idea outlined by the theoretical literature on the firm as an incentive structure is that the ownership of the firm – in the absence of specific provisions by the law that limit the choice – should be efficiently assigned to the class of stakeholders that minimizes the social transaction costs, i.e. the efficiency losses stemming from the presence of contractual incompleteness. Social transaction costs are defined as the sum of two components: the transaction costs stemming from a contractual relation with the firm for all the stakeholders who are not the owners, and the transaction costs arising within the firm for the class of stakeholders who are the owners. The main prediction of this literature is that different organizations (i.e., firms with different allocations of property rights) are characterized by different levels of social transaction costs, hence by different levels of economic inefficiency. Moreover, each organization plays a specific role in the economy, so that the provision of different contracts by the law pursue an efficiency aim.
In this paper, I propose a simple test of this prediction, focusing on the banking industry, where different organizations co-exist together. I use data on the Italian markets, where two types of co-operative banks – namely Banche Popolari and Banche di Credito Cooperativo – supply banking services together with stock banks. I estimate a standard translog cost frontier, with three inputs (labour, physical capital, and deposits) and three outputs (loans, investments in other earning assets, and the flow of services proxied by the volume of securities managed for clients) common to the three types of banks, and I derive cost efficiency scores. Kruskall–Wallis tests indicate that mean efficiency scores are statistically different among the three types of banks, providing empirical support to the theoretical prediction that different organizations represent different incentive structures. Moreover, co-operatives banks appear to be more efficient than stock banks. This result reflects a pure organizational advantage that is robust also after controlling for a size effect and the quality of credit policies. Hence, the efficiency gains stemming from the presence of scale economies seem to be dominated by the efficiency losses caused by the agency relationships within the bank in a more complex organization. From a theoretical point of view, a possible explanation is based on the idea that borrower-owned co-operative banks are an optimal incentive structure for a lending activity based on ‘soft’ information. However, whether relationship banking is the source of efficiency or other factors are at work is an important point that deserves further scrutiny.
Appendix: Stochastic frontiers estimates

Notes: LO = loans; OEA = other earning assets; SER = securities managed for clients.
WL = price of labour; WK = price of physical capital; WD = price of funds.
Lev. of sign.: (*) 10%, (**) 5%, (***) 1%.
(§) Std. Dev. (ineff.) / Std. Dev. (noise).
(#) R-squared from OLS estimates.