I. INTRODUCTION
Diamond-like carbon (DLC) is a metastable amorphous material comprising sp 3 and sp 2 hybridized carbon atoms with its sp 3/sp 2 bonding ratio largely dictating its mechanical properties. Reference Grill1 DLC films containing significant sp 3 bonding fractions can possess a high hardness in the range of 40–80 GPa and Young’s modulus up to ∼900 GPa, Reference Grill1,Reference Erdemir and Donnet2 thus making them attractive for tribological applications. Reference Erdemir and Donnet2 However, superhard DLC films are not always the right solution to all tribological problems because of their high propensity to brittle fracture and delamination. A trade-off between strength and toughness may necessitate the use of a relatively compliant DLC film to reduce the film-to-substrate modulus mismatch, thereby increasing the interfacial fracture toughness of the composite system. Reference Fujisawa, McKenzie, James, Woodard and Swain3 To uncover the full potential of such DLC films with high sp 2 bonding fractions in tribological applications, this work is aimed at exploring their abilities to carry a range of contact stresses.
Although the compressive stress–strain curves of materials can be obtained through uniaxial testing, the fact that the test sample must have a specific geometry and dimensions limits its applicability to thin films of a few microns at most in thickness. Nanoindentation with a spherical tip has emerged as a new technique for probing the local stress–strain response of a material. Reference Pathak and Kalidindi4 However, the existing nanoindentation stress–strain probing technique is not designed for a thin film, the mechanical response of which is influenced by the elastic constraint imposed by the underlying substrate. To extract the intrinsic indentation stress–strain curves of DLC films with high sp 2 bonding fractions as deposited on silicon substrates, this work extends the applicability of the existing technique to a film/substrate system. Given that the sp 2 phase in DLCs was previously shown to transform into the sp 3 phase upon compression to a critical stress, Reference Schwan, Ulrich, Roth, Ehrhardt, Silva, Robertson, Samlenski and Brenn5–Reference Liu, Lin, Zhou and Li8 the resulting stress–strain curves are analyzed to investigate the occurrence of the sp 2-to-sp 3 phase transition during spherical indentation and how the phase transition phenomenon contributes to the films’ stress-carrying capabilities.
II. THEORY
The concept of indentation stress–strain curves was first demonstrated by Taber Reference Tabor9 in classic hardness testing of metals by plotting the mean contact stress of indentation against the indentation strain defined as γa/R, where a is the radius of contact and R is the radius of the spherical indenter. The fitting constant γ was set to ∼0.2 by Tabor in an effort to relate the stress–strain curves due to indentation to those obtained by uniaxial testing for various metals in the plastic deformation regime. With the development of a multiple partial unloading procedure in nanoindentation, Field and Swain Reference Field and Swain10 enabled multiple stress–strain data points to be recorded in a single indentation experiment so that the deformation behavior of a material can be characterized seamlessly across the elastic, elastic–plastic transition, and plastic regimes. More recently, Kalidindi and Pathak Reference Kalidindi and Pathak11 redefined the indentation strain as
 $$\varepsilon = {4 / {\left( {3\pi } \right)\left( {{h / a}} \right)}}\quad ,$$
where h is the total indentation depth such that in the initial elastic regime, it relates to the indentation stress, σ, in a manner fully consistent with Hertz’s theory Reference Hertz, Jones and Schott12 as
 $$\sigma = {P / {\left( {\pi {a^2}} \right)}} = {E_{\rm{r}}}\varepsilon \quad ,$$
where P is the applied indentation load and E r is the reduced elastic modulus of the sample with the indenter defined as
 $${E_{\rm{r}}} = {\left( {{{1 - {\nu ^2}} \over E} + {{1 - \nu _{\rm{i}}^2} \over {{E_{\rm{i}}}}}} \right)^{ - 1}}\quad ,$$
where E and ν are the Young’s modulus and the Poisson’s ratio, respectively, of the sample and E i (= 1140 GPa) and νi (= 0.07) are those of the diamond indenter. More importantly, since the indentation deformation may be interpreted as being equivalent to compressing by h, a cylindrical domain of radius a and height (3π/4)a, this definition of indentation strain is physically more analogous to the definition of strain in uniaxial testing. Reference Kalidindi and Pathak11
In the case of a bulk sample or where a relative to the film thickness, t, is small enough to negate the influence of the elastic constraint imposed by the underlying substrate (hereafter referred to as the substrate effect), the knowledge of E allows a to be determined from the contact stiffness, S, regardless of whether the material piles up or sinks in, as Reference Oliver and Pharr13
 $$a = {S / {\left( {2\beta {E_{\rm{r}}}} \right)}}\quad ,$$
where β is a geometric constant of the indenter, which takes unity for sphere. Using a modern indentation test instrument with a continuous stiffness measurement capability, Reference Oliver and Pharr13 S can be measured continuously throughout a single test. It is thus possible from Eqs. (1), (2), and (4) to describe the indentation stress and strain of a bulk sample from the P, h, and S signals as
 $$\left( {\varepsilon ,\sigma } \right) = \left( {{4 \over {3\pi }}{h \over a},{P \over {\pi {a^2}}}} \right) = \left( {{{8{E_{\rm{r}}}} \over {3\pi }}{h \over S},{{8E_{\rm{r}}^2} \over {3\pi }}{{3P} \over {2S}}{1 \over S}} \right) = \left( {{1 \over {{E_{\rm{r}}}}}{{8E_{\rm{r}}^2} \over {3\pi }}{h \over S},{{8E_{\rm{r}}^2} \over {3{\rm{\pi }}}}{d \over S}} \right)\quad ,$$
where the term (3/2)(P/S), denoted hereafter by d, corresponds to the elastic component of the indentation depth in spherical indentation of bulk materials not only in the initial elastic regime but also in the subsequent elastic–plastic transition regime. Reference Fischer-Cripps14 Therefore, the indentation stress normalized by the reduced modulus, σ/E r (= 4/(3π)(d/a)), effectively represents the elastic indentation strain accommodated in the material.
Where the substrate effect on the film’s mechanical response is no longer negligible at larger contact radii, however, Eq. (4) does not hold. Nevertheless, this problem may be avoided by using an appropriate mathematical model of a film/substrate system that relates S to a in a closed form using the material property constants of the film sample (E, ν), substrate (E s, νs), and indenter (E i, νi) as well as the thickness of the film (t). This study adopts the Hay–Crawford model, Reference Hay and Crawford15 which was built upon the earlier models of Gao et al. Reference Gao, Chiu and Lee16 and Song and colleagues Reference Song17 and is applicable to a composite system with a modulus mismatch ratio E/E s of 0.1–10. Introducing the concept of apparent reduced elastic modulus for a film/substrate system, this model relates S to a as
 $$a = {S / {\left( {2\beta {E_{{\rm{r ‐ a}}}}} \right)}}\quad ,$$
where E r-a is the apparent reduced elastic modulus of the composite system defined as Reference Hay and Crawford15
 $${E_{{\rm{r ‐ a}}}} = {\left[ {\left( {1 - {\nu _{\rm{a}}}} \right)\left( {{{1 - {I_0}} \over {{{{E_{\rm{s}}}} \over {1 + {\nu _{\rm{s}}}}} + 0.0626{I_0}{E \over {1 + \nu }}}} + {{{I_0}} \over {{E \over {1 + \nu }}}}} \right) + {{1 - \nu _{\rm{i}}^2} \over {{E_{\rm{i}}}}}} \right]^{ - 1}}\quad ,$$
where I 0 is a weighting function due to Gao et al., Reference Gao, Chiu and Lee16 defined as
 $${I_0} = {2 \over \pi }{\tan ^{ - 1}}\left( {{t \over a}} \right) + {1 \over {2\pi \left( {1 - {\nu _{\rm{a}}}} \right)}}<$$><$$>\left[ {\left( {1 - 2{\nu _{\rm{a}}}} \right)\left( {{t \over a}} \right)\ln \left( {{{1 + {{\left( {t{\rm{/}}a} \right)}^2}} \over {{{\left( {t{\rm{/}}a} \right)}^2}}}} \right) - {{t{\rm{/}}a} \over {1 + {{\left( {t{\rm{/}}a} \right)}^2}}}} \right]\quad ,$$
and νa is the apparent Poisson’s ratio of the composite system due to Song, Reference Song17 defined as
 $${\nu _{\rm{a}}} = 1 - {{\left( {1 - {\nu _{\rm{s}}}} \right)\left( {1 - \nu } \right)} \over {1 - {I_1}{\nu _{\rm{s}}} - \left( {1 - {I_1}} \right)\nu }}\quad ,$$
where I 1 is another weighting function due to Gao et al., Reference Gao, Chiu and Lee16 defined as
 $${I_1} = {2 \over \pi }{\tan ^{ - 1}}\left( {{t \over a}} \right) + {{t{\rm{/}}a} \over \pi }\ln \left( {{{1 + {{\left( {t{\rm{/}}a} \right)}^2}} \over {{{\left( {t{\rm{/}}a} \right)}^2}}}} \right)\quad .$$
Noting that E r-a varies as a function of a, however, it is not straightforward to calculate the value of a that corresponds to a given value of S from Eq. (6). Nevertheless, since the same equation allows S to be determined for a given a, it is possible to numerically interpolate a at a given S provided that S is a monotonic function of a. Having described a as a function of S in this manner, E r-a may also be described as a function of S. The indentation stress and strain of the composite system may therefore be determined as
 $$\left( {\varepsilon ,\sigma } \right) = \left( {{1 \over {{E_{{\rm{r ‐ a}}}}}}{{8E_{{\rm{r ‐ a}}}^2} \over {3\pi }}{h \over S},{{8E_{{\rm{r ‐ a}}}^2} \over {3\pi }}{d \over S}} \right)\quad .$$
So long as the plastic zone is contained within the film by keeping h below ∼1/10th of the film thickness, σ defined in Eq. (11) may be taken to represent the mean contact stress accommodated in the film material, Reference Fischer-Cripps14 whereas ε defined in Eq. (11) represents the average indentation strain accommodated in the composite system having an effective spring constant E r-a. A substrate that is stiffer or more compliant than the film has the effect of elastically over-constraining or under-constraining the film material upon indentation, respectively. As the aim of the present exercise is to characterize the intrinsic stress–strain response of the film material, it is necessary to consider the “equivalent” indentation strain that the local volume of the film material would be subjected to in the absence of the substrate effect. Where the effective spring constant of the composite system (E r-a) and that of a virtual film-only system (E r) are both known, the elastic displacement of the virtual film-only system at a given contact radius would simply be given as h(E r-a/E r). Multiplying the indentation strain defined in Eq. (11) by the ratio E r-a/E r thus yields the “equivalent” indentation strain. The intrinsic stress–strain response of the film material may thus be determined from the three signals as
 $$\left( {\varepsilon ,\sigma } \right) = \left( {{1 \over {{E_{\rm{r}}}}}{{8E_{{\rm{r ‐ a}}}^2} \over {3\pi }}{h \over S},{{8E_{{\rm{r ‐ a}}}^2} \over {3\pi }}{d \over S}} \right)\quad .$$
For the relation σ = E rε holds in the initial elastic regime, Eq. (12) dictates that the d–h curve may be described by the relation d = h up to the onset of yield in the film material even if the substrate effect is present. The point of transition from the initial linear response (d = h) to the subsequent nonlinear response of the d–h curve thus represents the yield point.
III. MATERIALS
A. Preparation of DLC thin films
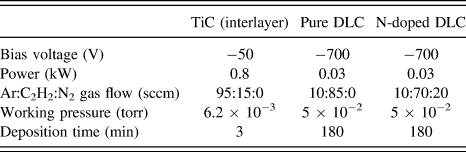
DLC films with and without nitrogen doping were synthesized on polished, prime-grade single crystalline silicon (100) wafer substrates (660–690 μm thickness, LG Siltron Inc., Gumi, Gyeongsangbuk, Korea) using a hybrid PVD + CVD coating system operated under the base pressure of 2 × 10⁻⁵ torr at 300 °C. The incorporation of nitrogen in a DLC film has the effect of decreasing the sp 3/sp 2 bonding ratio, hence the degree of graphitization of the material. Reference Lenardi, Baker, Briois, Nobili, Piseri and Gissler18 Prior to film deposition, a thin TiC interlayer was deposited on the substrate from a titanium target in Ar + C2H2 atmosphere using the high-power impulse magnetron sputtering technique to ensure adequate film adhesion. A pure or nitrogen-doped DLC film was deposited on the interlayer in Ar + C2H2 gas mixture by the DC plasma-enhanced chemical vapor deposition technique. The detailed deposition conditions are given in Table I.
Deposition conditions used for TiC, pure DLC, and nitrogen-doped DLC.

The thicknesses of the pure and N-doped DLC films were t = 1.45 μm and t = 1.16 μm, respectively, inclusive of the interlayer. The interlayer thickness was kept at ∼3% of the total film thickness to ensure that the bilayer system may be modeled effectively as a single layer system. To reduce the surface roughness, both films were polished over a 20 × 20-μm square region by raster scanning a spherical diamond probe of ∼150 nm tip radius at a contact force of ∼50 μN for a total of 20 passes using the in situ scanning probe microscopy imaging capability of the TI 950 TriboIndenter® (Hysitron, Inc., Eden Prairie, MN). Due to the surface preconditioning treatment, the peak-to-valley and RMS roughness values of either film were reduced by a factor of ∼2/3 to ∼15 nm and ∼2 nm, respectively. Reference Fujisawa, Zhang, Lee and Kim19
B. Mechanical properties
The Young’s moduli of the pure and N-doped DLC films were previously derived from nanoindentation with a Berkovich diamond indenter to be E = 76.3 GPa and E = 73.1 GPa, respectively, using a new data analysis method that accounts for the surface roughness and substrate effects simultaneously. Reference Fujisawa, Zhang, Lee and Kim19 The nitrogen doping as specified in Table I thus had an effect of reducing the Young’s modulus of the DLC by ∼4%. In both the previous and present studies, the Poisson’s ratios of the pure and N-doped DLC films were assumed to be ν = 0.22. Reference Cho, Lee, Eun, Hahn and Ko20 For the Young’s modulus and Poisson’s ratio of the silicon substrate, E s = 170 GPa and νs = 0.25 Reference Saha and Nix21 were used. From the same nanoindentation data analysis results obtained with the same Berkovich tip, Reference Fujisawa, Zhang, Lee and Kim19 the indentation hardness, H, of these films were determined as the applied load divided by the projected area of contact obtained by the analysis procedure at the indentation depth corresponding to 1/10th of the respective film thicknesses to be 12.5 GPa (as the average of n = 11 tests) and 11.7 GPa (n = 12), respectively. The H value of fused quartz was determined with the same Berkovich indenter to be ∼10.6 GPa (as the average of the mean H values of n = 8 tests over the depth range from 116 nm to 145 nm, corresponding to 1/10th the thicknesses of the N-doped and pure DLC films, respectively).
IV. METHODS
A. Residual stress characterization
The compressive residual stresses of the pure and N-doped DLC films were measured using a laser-based curvature measurement technique (Residual stress tester, J&L Tech, Co., Ltd., Ansan, Gyeonggi, Korea) on the silicon substrates coated with the respective films cut into a rectangular shape with dimensions roughly of ∼25 × ∼5 mm. A bare substrate, cut from another silicon wafer in the same batch into an identical rectangular shape, was measured to obtain the radius of curvature of the substrate in its original state. The radius of curvature, R coated, of each coated substrate was determined as the average of five replicate measurements over a scan length of 20 mm in the longitudinal direction assuming axis-symmetry of wafer curvature change due to film deposition. The radius of curvature of the bare substrate was determined as the average of three replicate measurements over the same longitudinal scan length assuming axis-symmetry of curvature of the (prime-grade) wafer in its original state. The residual stress was calculated using the Stoney formula Reference Stoney22 of the form
 $$\sigma = {{t_{\rm{s}}^2{E_{\rm{s}}}} \over {6{t_{\rm{s}}}\left( {1 - {\nu _{\rm{s}}}} \right)}}\left( {{1 \over {{R_{{\rm{coated}}}}}} - {1 \over {{R_{{\rm{bare}}}}}}} \right)\quad ,$$
where t s (= 675 μm) and R bare (= 333 m) are the thickness and radius of curvature of the uncoated silicon substrate, respectively.
B. X-ray photoelectron spectroscopy
The chemical bonding status and nitrogen contents of the pure and N-doped DLC films were analyzed by X-ray photoelectron spectroscopy (XPS) (Theta probe AR-XPS, Thermo Fischer Scientific Inc., Waltham, MA) equipped with a monochromatic Al Kα X-ray source (1486.6 eV) and a low energy electron flood gun for charge compensation. An Ar+ ion beam with an energy of 4 keV was used to etch the sample surface for 180 s to remove the contamination layer. The obtained XPS spectra were referenced to the core-level peak of adventitious carbon (C 1s) located at 284.6 eV. Using Voigt function fitting, the C 1s spectra of the pure DLC film were deconvoluted into three subpeaks at 284.5 eV, 285.3 eV, and 286.2 eV that are associated with the sp 2 C–C, sp 3 C–C, and C–O bonds, respectively, while those of the N-doped DLC film were deconvoluted into four subpeaks comprising one additional peak at 287.3 eV associated with the C–N bond. Reference Zhou, Ke, Li, Zou and Wang23 The sp 3/sp 2 bonding ratio of either film was determined as the area ratio of the two peaks at 285.3 eV (sp 3 C–C) and 284.5 eV (sp 2 C–C). Reference Qiang, Zhang, Zhou and Zhang24
C. Nanoindentation
All indentation tests were performed using the nanoDMA® III dynamic indentation module (Hysitron, Inc., Eden Prairie, MN) incorporated in the TI 950 TriboIndenter. All tests were conducted at room temperature using a sphero-conical diamond indenter with a tip radius of ∼170 nm and half-opening angle of ∼50° (see Sec. V.D for descriptions of how these values were determined). The dynamic indentation module enabled the continuous measurement of contact stiffness by superimposing a small oscillatory load at the default excitation frequency of 200 Hz on the quasi-static load, controlled to increase progressively at the load-rate over load ratio
 $\left( {\dot{P}{\rm{/}}P} \right)$
of ∼0.15 s−1. The oscillation load amplitude was increased progressively with increasing quasi-static component of the load while keeping its ratio to the square root of the quasi-static load at ∼1.3. The relatively high
 $\dot{P}{\rm{/}}P$
of ∼0.15 s−1 was used to ensure that the thermal drift correction applied to the displacement signal was reliable for a material that is not expected to exhibit viscoelastic behavior.
The zero point in indentation load was determined as the load recorded while the indenter was out of contact by lifting the indenter tip from the sample surface prior to indentation loading. On the basis that the indentation depth in the initial elastic regime of spherical indentation equals d, Reference Fischer-Cripps14 a relation of the form h – h 0 = d, where h 0 is a constant, was fitted to the initial linear portion of the d–h plot using the least-squares method so that the effective zero point in indentation depth could be determined as h = h 0. Reference Kalidindi and Pathak11
The contact stiffness measured continuously in the dynamic mode of indentation testing always shows a significantly lower signal-to-noise ratio than those of the load and displacement, thus making the indentation stress–strain curves determined via Eq. (12) or Eq. (5) considerably noisy. The use of an averaging technique to smooth a signal inherently involves the risk of distorting the signal. This study uses a mathematical function of the form
 $$f\left( h \right) = {C_0} + {C_1}h + {C_2}{h^{1{\rm{/}}2}} + {C_3}{h^{1{\rm{/}}4}} + \cdots + {C_9}{h^{1{\rm{/}}256}}\quad ,$$
where C 0, C 1, C 2, … C 9 are fitting constants to be determined by the least-squares method, to express the S and d signals as S = f(h) and d = f(h), respectively, so that the indentation stress–strain curve of a material in thin-film or bulk form can be extracted through Eq. (12) or Eq. (5), respectively.
V. RESULTS AND DISCUSSION
A. Residual stress
The mean compressive residual stresses ± standard deviations of the pure and N-doped DLC films were 192 ± 9 MPa (n = 5) and 146 ± 13 MPa (n = 5), respectively. The compressive internal stress in the DLC material was thus reduced by 24% due to nitrogen doping. Although the presence of a residual stress is known to alter the indentation stress–strain response of the material in the elastic–plastic transition regime, Reference Swadener, Taljat and Pharr25 the residual stress magnitude of either film was too small (<2% of its H value) to affect its indentation stress–stress curve profile to a measurable degree.
B. Chemical bonding status
The XPS spectra of the pure and N-doped DLC films (not shown) revealed peaks corresponding to C 1s and O 1s. The small peak of O 1s could have resulted from a trace amount of oxygen impurity introduced into the film during deposition. Deconvolution of the C 1s spectra into the three or four subpeaks as described in Sec. IV.B confirmed the presence of the sp 2 C–C, sp 3 C–C and C–O bonds in both the pure and N-doped DLC films. The sp 3/sp 2 bonding ratios of the pure and N-doped DLC films were determined to be ∼0.382 and ∼0.221, respectively; hence the sp 2 bonding fractions of the two DLC films were calculated to be ∼72% and ∼82%, respectively. The XPS spectra of the N-doped DLC film also exhibited a peak corresponding to N 1s. Deconvolution of the N 1s spectra into three subpeaks at 398.6 eV, 400.1 eV, and 402.1 eV revealed the presence of N atoms bonded to sp 3-bonded C atoms, N atoms bonded to sp 2-bonded C atoms, and the N–O bond, respectively. Reference Zhou, Ke, Li, Zou and Wang23 The nitrogen content in the N-doped DLC film was 4.4 at.%.
C. Mathematical expression of dynamic indentation signals
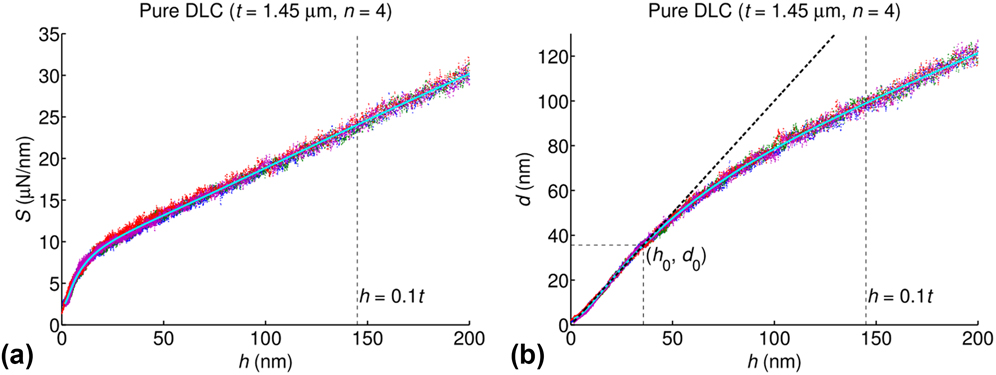
The S–h and d–h curves of the pure DLC film obtained at n = 4 measurement locations are plotted together in Figs. 1(a) and 1(b), respectively. The S–h and d–h curves of the N-doped DLC film and those of bulk fused quartz were obtained at n = 5 locations (not shown). The relations S = f(h) and d = f(h) were fitted to the respective data of all tests of each sample in the h range up to 250 nm by the least-squares method. The good fit of S = f(h) to the experimental data of Fig. 1(a) in the h range from 1.5 to 200 nm demonstrates its ability to describe the S–h curve. On the basis of the fully elastic response expected at small indentation depths, the initial linear portion of the d–h curve was approximated by the relation d = h, shown as the thick dashed line in Fig. 1(b), with the subsequent nonlinear curve portion approximated by d = f(h), shown as the solid line. The coordinate point (h 0, d 0) in the figure marks where the linear relation (d = h) intersects the nonlinear relation (d = f(h)) at the highest point in d. The good fit of d = f(h) to the experimental data of Fig. 1(b) in the h range from h 0 to 200 nm confirms its ability to describe the d–h curve.
(a) Contact stiffness (S) versus indentation depth (h) and (b) elastic indentation depth (d) versus indentation depth (h) curves of the pure DLC film obtained at n = 4 test locations, with the solid line showing the relation S = f(h) or d = f(h) fitted to the respective data of all tests.

D. Indenter shape profile
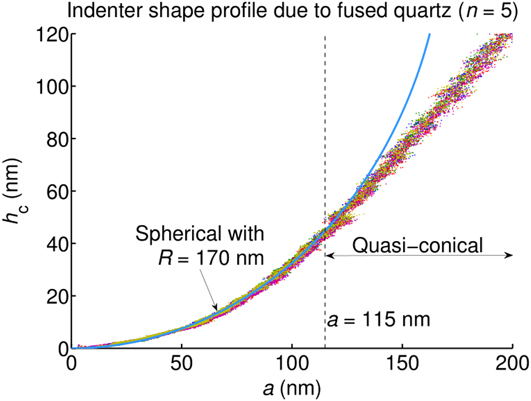
The two-dimensional shape profile of the sphero-conical diamond indenter was determined by the procedure described elsewhere Reference Fujisawa, Zhang, Lee and Kim19 using fused quartz as a reference material of known E (= 72 GPa) and ν (= 0.17). The indenter shape profile determined from the n = 5 tests performed on fused quartz is shown in Fig. 2, which reveals that the indenter tip was spherical only up to ∼115 nm in contact radius (a ≤ 115 nm) and that the indenter section beyond this contact radius (a ≥ 115 nm) was rather conical or quasi-conical. The indenter tip radius was determined to be ∼170 nm by fitting a spherical profile to the two-dimensional shape profile of the indenter shown in the figure. The half-opening angle of the indenter was estimated to be ∼50° from the conical portion of the shape profile below 200 nm in contact radius.
Indenter shape profile visualized in the contact depth (h c) versus contact radius (a) curves of n = 5 tests of fused quartz, with the solid line indicating a sphere of 170 nm radius.

E. Initiation of substrate plasticity
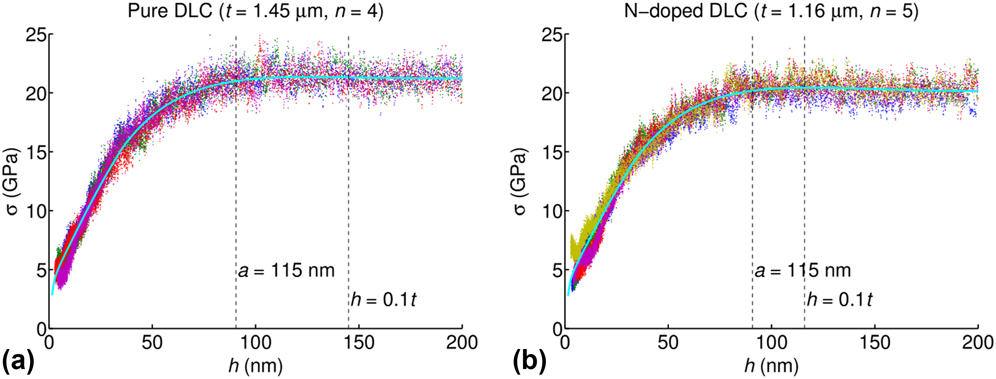
The indentation stress values at all data points of all tests of the pure and N-doped DLC films, calculated using Eq. (12), are plotted against the corresponding indentation depths in Figs. 3(a) and 3(b), respectively. The solid line in either figure is the indentation stress–strain or σ–h curve obtained through Eq. (12) using the mathematically expressed S and d as a function of h. From these figures, the indentation stress of either pure or N-doped DLC film (corrected for the substrate effect) increased progressively with indentation depth to reach the respective peak value of ∼21 GPa or ∼20 GPa past h ≈ 90 nm, and remained almost constant thereafter until h = 0.1t. Since the indentation depth of ∼90 nm corresponds to the contact radius of ∼115 nm, the indentation strain beyond this depth must have been dictated by the quasi-conical section of the indenter (Fig. 2). Given that the contact strain due to a conical indenter scales with the tangent of the complimentary angle between the original sample surface and the indenter flank, Reference Tabor9 the indentation strain must not have changed significantly past h ≈ 90 nm. This explains why the corresponding indentation stress remained almost constant in the h range from ∼90 nm to 0.1t. With further increase of indentation depth past h = 0.1t, the indentation stress of either film decreased from its peak value by a measurable amount. The slight decrease of indentation stress despite little change in “effective” indentation strain may be attributed, not to the exhaustion of the stress-carrying capacity of the film material, but to the plastic deformation of the silicon substrate, likely to have initiated as the indentation depth exceeded ∼1/10th of the film thickness. Reference Saha and Nix21 In fact, the amount of pressure needed for diamond cubic Si-I to transform to a metallic Si-II phase (11–12 GPa Reference Hu, Merkle, Menoni and Spain26 ) is much lower than the peak indentation stress of either film/substrate system.
Indentation stress (σ), corrected for substrate effect, versus indentation depth (h) for the (a) pure DLC film and (b) nitrogen-doped DLC film, with the solid line showing the relationship based on the mathematically expressed S and d as a function of h (h ≤ 200 nm).

F. Substrate effect
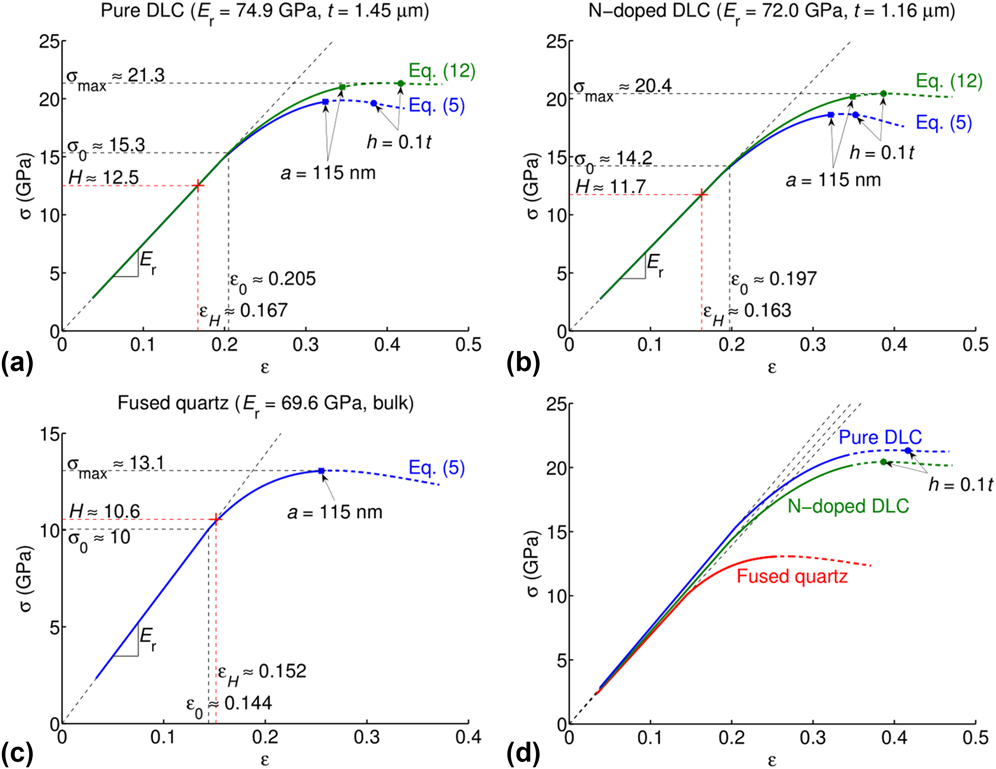
The indentation stress–strain (σ–ε) curves of the pure and N-doped DLC films with or without taking into account the substrate effect, as determined with Eq. (12) or Eq. (5), respectively, and the σ–ε curve of bulk fused quartz, as determined with Eq. (5), using S and d expressed mathematically as a functions of h, are shown in Figs. 4(a)–4(c), respectively. The substrate-independent σ–ε curves of both films and the σ–ε curve of fused quartz are plotted together in Fig. 4(d) to facilitate comparison. It is noted that the use of Eq. (12) or Eq. (5) to determine the indentation strain in the contact radius range above ∼115 nm is not justified because either equation assumes the indenter shape to be spherical, whereas the actual indenter shape beyond this contact radius was quasi-conical, as established in Sec. V.D. Therefore, the “effective” indentation strain values above a ≈ 115 nm would have been smaller than the calculated ones, thereby distorting the latter portion of the σ–ε curve shown as the thick dashed line in the horizontal direction. The difference between the σ–ε curve profiles due to Eqs. (5) and (12), observed in Figs. 4(a) and 4(b), visually demonstrates the extent to which the substrate affects the ability of Eq. (1) to define the indentation strain for a composite system as well as that of Eq. (4) to determine the contact radius. Since the coordinate point (ε0, σ0), corresponding to (h 0, d 0), marks the onset of yield in the film material, the silicon substrate being more than twice as stiff as that of either film would have caused both ε0 and σ0 to be underestimated by ∼4% for the pure DLC film and by ∼5% for the N-doped DLC film. Past the yield point, the substrate effect was progressively amplified with increasing indentation strain as expected. The substrate effect was significantly more pronounced for the N-doped DLC film (t = 1.16 μm) than for the pure DLC film (t = 1.45 μm) primarily because the former film was 20% thinner than the latter.
Indentation stress–strain (σ–ε) curves of the (a) pure DLC film, (b) nitrogen-doped DLC film, and (c) fused quartz, as determined with Eq. (12) or Eq. (5) using the mathematically expressed S and d as a function of h (h ≤ 200 nm). The σ–ε curves of both films (corrected for substrate effect) and fused quartz are plotted together in (d) to facilitate comparison.

G. Stress–strain response
Figures 4(a) and 4(b) show that the substrate-independent σ values of the pure and N-doped DLC films at the onset of yield (i.e., σ = σ0) were higher than the respective H values by more than 20%. On the contrary, the σ–ε curve of bulk fused quartz, shown in Fig. 4(c), reveals its σ0 value to be lower than its H value by ∼5%. This leads to a realization that, whereas fused quartz yielded upon indentation with a Berkovich indenter, both the pure and N-doped DLCs did deform solely elastically upon indentation by the same indenter despite the fact that the H and E values and the H/E ratios, known to indicate the elastic strain to failure, Reference Leyland and Matthrew27 of the three samples were similar. In this study, the H value of each sample was determined as the applied load divided not by the projected area of the residual indent but by the projected contact area obtained at the indentation depth corresponding to 1/10th of the film thickness using the nanoindentation data analysis procedure that takes into account the surface roughness and substrate effects. Reference Fujisawa, Zhang, Lee and Kim19 The mean contact pressure with a Berkovich tip determined in this manner may serve as a true measure of the resistance to plastic deformation at a specific contact strain only if the material shows little elastic recovery. Reference Fischer-Cripps14 Where there is substantial elastic recovery, such as in DLCs, the mean contact pressure represents the resistance of the material to combined elastic and plastic deformations. Reference Fischer-Cripps14,Reference Sakai28 Therefore, the hardness of such materials should be determined with the projected area of the residual indent. Due to the difficulty in accurately determining the projected area of a minute indent left on the sample surface, however, it is rather common practice to determine H using the projected contact area obtained in nanoindentation. Either one of the two DLC films and fused quartz having significantly different mechanical properties exhibited similar H/E ratios merely as a result of adapting this practice in determining H. The ε0 values of the DLCs (∼0.201) were greater than that of fused quartz (∼0.144) by ∼40%, hence the significantly superior ability of the DLCs to resist initial yielding. Where the material surface is elastically contacted by a spherical indenter, the principal shear stress is a maximum at ∼0.47 times the mean contact pressure at a depth of approximately one-half the contact radius below the surface. Reference Fischer-Cripps14 Since plasticity is initiated in the material when the maximum shear stress reaches half the yield strength (σy) of the material by Tresca’s criterion, that is, when the mean contact pressure reaches 1.07σy, the knowledge of the mean contact pressure at the onset of yield (σ0) enables the yield strength of the material to be evaluated as σy = σ0/1.07. Reference Tabor9,Reference Fischer-Cripps14,Reference Johnson29 The σy values of the pure and N-doped DLCs and fused quartz were thus evaluated to be ∼14.3 GPa, ∼13.3 GPa, and ∼9.4 GPa, respectively.
Past the yield point, the indentation stress increased nonlinearly with indentation strain for both DLCs and fused quartz. The indentation stress is related to the uniaxial yield strength, σy, of the material as σ = Cσy, where C is the constraint factor that increases from 1.07 at the onset of yield until full plasticity is reached. Such an increase in constraint factor reflects the confining nature of the indentation stress field in the elastic–plastic transition regime. Reference Tabor9,Reference Field and Swain10,Reference Johnson29–Reference Park and Pharr32 Hence, the progressive increase of indentation stress with strain observed past the yield point could have been merely due to an increase of the constraint factor. Whether each of these materials strain-hardened thus remains unknown from these results alone.
Since amorphous SiO2 is known to irreversibly densify upon static compression in a diamond cell to pressures exceeding ∼10 GPa, Reference Meade and Jeanloz33 the yielding of fused quartz commencing at σy ≈ 9.4 GPa is associated with the irreversible densification of the material. Room-temperature compression of graphite uniaxially or in a diamond anvil cell was shown to initiate the transformation of sp 2-bonded carbon into sp 3-bonded carbon at 12–14 GPa based on a decrease in electrical conductivity and optical reflectivity and an increase in optical transmittance. Reference Bundy, Bassett, Weathers, Hemley, Mao and Goncharov34 Subsequent decompression from this pressure range was found to yield graphite, implying that this phase transition is reversible. Reference Bundy, Bassett, Weathers, Hemley, Mao and Goncharov34 Simulated indentation testing of graphite with a spherical tip of 2.5 nm radius by molecular dynamics revealed the commencement of the sp 2-to-sp 3 phase transition at ∼12 GPa and the formation of interlayer sp 3 bonds with further penetration, which is reversible upon unloading if the compressive stress is below ∼70 GPa. Reference Guo, Zhu, Yu, Woo, Zhang and Dai35 The sp 2-to-sp 3 phase transition was shown also to occur in DLC films during deposition (at room temperature) when the growth-induced compressive residual stress acquired in the film reaches a critical value of 13–14 GPa. Reference Schwan, Ulrich, Roth, Ehrhardt, Silva, Robertson, Samlenski and Brenn5–Reference Lu and Komvopoulos7 The room-temperature phase transition was found also to take place in DLC nanopillars of 227–674 nm in diameter and 240 GPa in Young’s modulus when compressed uniaxially to a critical stress of ≥16.6 GPa, with pillars smaller than ∼400 nm requiring higher critical pressures up to ∼22 GPa due to a size effect. Reference Liu, Lin, Zhou and Li8 The significantly higher critical stress values (17–22 GPa) observed with the DLC nanopillars may be attributed to the nature of a uniaxial stress field that forces the entire material volume to reach the phase transition pressure at the same time. Whereas the multiaxial stress field in the case of indentation allows a local volume of the material to reach the critical pressure earlier than elsewhere in the material volume, thereby initiating the phase transition process more readily than in the case of uniaxial compression. A significant stress–strain hysteresis and large plastic deformation exhibited by every DLC nanopillar studied Reference Liu, Lin, Zhou and Li8 suggest that the sp 2-to-sp 3 phase transition in amorphous carbon comprising pre-existing sp 3 bonds is at least partly irreversible. Based on these previous findings, the yielding of either DLC film commencing at σy ≈ 13–14 GPa is attributed to the sp 2-to-sp 3 phase transition involving material densification.
The maximum possible indentation stresses bearable by the pure and N-doped DLC films could not be determined in this work because the indenter tip radius was too large to be able to apply sufficiently high contact strains without initiating substrate plasticity. Nevertheless, Figs. 4(a) and 4(b) show that the peak indentation stresses of these films were ∼21 and ∼20 GPa, respectively, which are greater than their respective H or the mean contact pressure values with the Berkovich tip by ∼70%. Since the local elastic modulus of the phase-transformed material beneath the indenter could have been greater than elsewhere, the actual contact radius and indentation stress values past the elastic limit could have been smaller and larger, respectively, than the computed ones, whereas the maximum indentation stress bearable by fused quartz (∼13.1 GPa) was greater than its H value (∼10.6 GPa) only by ∼24%. Since densification involves phase transition for DLCs but not for fused SiO2, the remarkably superior stress-carrying capacities of the DLC films, as shown in Fig. 4(d), may be attributed to the transformation of sp 2-bonded carbon into significantly harder sp 3-bonded carbon.
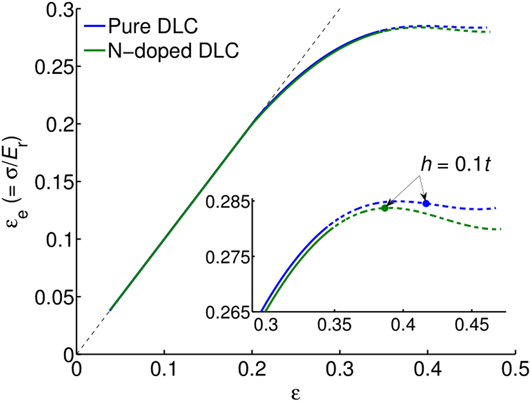
The substrate-independent indentation stress normalized by the reduced modulus, σ/E r, is plotted against the substrate-independent indentation strain for the pure and N-doped DLC films in Fig. 5. Since σ/E r represents the elastic component of the total indentation strain accommodated in the film material, σ/E r is denoted hereafter by εe. In this figure, the εe–ε curve profile of the N-doped DLC film was almost identical to that of the pure DLC film in the ε range up to ∼0.39 and began to deviate downwards thereafter. The downward deviation of the εe–ε curve for the N-doped DLC film is attributed to the fact that Eq. (12) does not account for the effect of substrate plasticity that must have prevailed first in the silicon substrate beneath the thinner film as the indentation depth exceeded ∼1/10th of its film thickness past ε ≈ 0.39. The nearly identical εe–ε curve profiles of the two DLC films with different sp 2 contents indicate that indentation strain rather than indentation stress dictates the sp 2-to-sp 3 phase transition in the dual-phase material comprising pre-existing sp 3 bonds.
Elastic indentation strain versus total indentation strain (εe–ε) curves of pure and nitrogen-doped DLC films, with the latter portions of both curves enlarged in the inset.

H. Load–displacement response
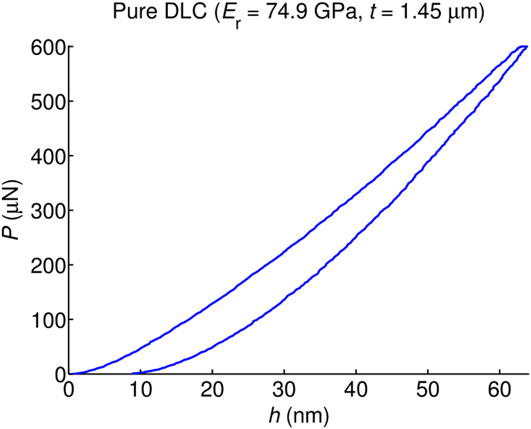
Supplementary indentation testing was performed on the pure and N-doped DLC films to examine the reversibility of the sp 2-to-sp 3 phase transition in both DLCs as well as their ductility. The film surface was loaded quasi-statically with the same indenter past the elastic limit up to h ≈ 64 nm, that is, well prior to the initiation of substrate plasticity, before subsequent unloading. Because the load–displacement curves of both films were found to be similar, only the result of the pure DLC film is shown in Fig. 6. Both films revealed a load-depth hysteresis and a residual depth of ∼8 nm, as well as a large elastic recovery inherent to DLCs. Thus, the sp 2-to-sp 3 phase transition that occurs in amorphous carbon (with pre-existing sp 3 bonds) appears to be an energy-dissipating process, that is, at least partly irreversible although whether the phase transition is the sole cause of the energy dissipation is yet to be studied.
Load–displacement (P–h) curve of the pure DLC film with a 1-s load-hold period at the peak load, showing a hysteresis, large elastic recovery, and residual depth of ∼8 nm.

VI. CONCLUSIONS
We have developed a method for extracting the indentation stress–strain curves of thin films, which takes into account the influence of the elastic constraint imposed by the underlying substrate. The resulting stress–strain curves revealed that DLC films with a relatively low Young’s moduli of ∼73 GPa and ∼76 GPa commence yielding at ∼13 GPa and ∼14 GPa, respectively. These yield strength values agree with the critical pressure necessary to initiate the transformation of sp 2-bonded carbon into significantly harder sp 3-bonded carbon, indicating that the yielding of the films is associated with the sp 2-to-sp 3 phase transition involving material densification. On the basis that the two DLC films with varied sp 2 contents exhibited identical elastic strain versus total strain curves, indentation strain rather than indentation stress appears to dictate the sp 2-to-sp 3 phase transition in amorphous carbon comprising pre-existing sp 3 bonds. Since both films loaded past the elastic limit showed a load-depth hysteresis and a residual indentation depth, this phase transition appears to be an energy-dissipating process that is at least partly irreversible. The ability of a DLC film with a high sp 2 bonding fraction to accommodate a progressively increasing contact stress with strain beyond the yield point while dissipating part of the strain energy accumulated in the system through the phase transition, as revealed in this work, implies a unique mechanism of the brittle material for passively mitigating contact deformation and fracture in tribological applications. This particular finding is important to the materials and tribology research communities as it helps better understand why DLCs outperform other types of hard coatings in tribological applications.
ACKNOWLEDGMENTS
This study was supported by Global Frontier Program through the Global Frontier Hybrid Interface Materials (GFHIM) of the National Research Foundation of Korea (NRF) funded by the Ministry of Science, ICT & Future Planning (2013M3A6B1078873 and 2013M3A6B1078874). The authors also acknowledge support from Hysitron, Inc. on the state-of-the-art TI 950 TriboIndenter® nanomechanical test instrument used for this work.