The crucial stage at which the democratic representation of citizens’ preferences can go wrong is at the ballot box. If citizens do not elect candidates who match their preference for a particular political outcome, governments are unlikely to be responsive, and political representation could end up being mismatched. For a dominant perspective in political theory, however, this fear has been regarded as irrelevant, as it builds on the idea that all citizens know exactly what kind of policies they would like to see implemented. Those who are opposed to minimum wages, who want increased taxation for higher incomes and who are in favor of gay marriage would simply vote for candidates or parties with political platforms that aim to implement these goals. In political science, spatial theories of voting and empirical tests thereof promote the idea that policy distance is indeed an essential factor in citizens’ voting decisions.Footnote 1
But what if ordinary voters are not equipped with policy views that easily permit them to select matching representatives? Critiques have long asserted that such a model of democratic representation is based on an unrealistic portrayal of citizens’ policy views. Researchers stress that citizens base their political behavior on unstructured beliefs and attitudes rather than well-defined preferences over political outcomes. From Converse’s early ‘non-attitude model’,Footnote 2 through studies of preference formation,Footnote 3 to the impact of ideological thinking,Footnote 4 the bottom line of this area of research is that it doubts whether well-defined preference is a sensible assumption for explaining voters’ behavior. Instead, it is argued that citizens differ in the degree of consistency in their policy views: some citizens express opinions that are more constrained by underlying political dimensions than others. While it is often presupposed that this hinders citizens’ ability to find matching representatives, political science has acquired relatively little theoretical insight into the mechanisms of how this affects voting.
In this article, I offer an extension to spatial voting that integrates a behavioral conceptualization of policy views and propose to model inconsistent, unconstrained preferences as a belief over different policy platforms. Those beliefs can signify that citizens might be uncertain about their ideal political outcome, building on the idea that ‘people do not know how much they will like an outcome if and when it does occur’.Footnote 5 I argue that this conceptualization also makes allowance for varying consistency in preferences. As some citizens’ beliefs are less strongly constrained, policy preferences will also be less strongly aligned with political dimensions.
Studying how this influences voting shows that citizens with loosely structured beliefs will put considerably less weight on policy distance when deciding between candidates. For citizens with preferences that do not align with the ideological expectations, and who attempt to learn about the utility-difference between two candidates, policy platforms would prove less informative. This is because, for citizens, the information contained in the candidates’ platforms depends on their own policy beliefs. Therefore, citizens with wide beliefs will put considerably less weight on policy distance when learning about utility differences between candidates.
An empirical test confirms the moderating effect of inconsistency on spatial voting and its importance for electoral representation. In the 2008 US presidential elections, I find that for respondents with a higher inconsistency in self-placement on the liberal–conservative scale, policy distance is less important for explaining voting decisions. This finding supports the implications from the model and calls into question the degree to which the assumption that all voters possess the same structured preferences is a reasonable starting point for understanding representative democracies. There is considerable heterogeneity in citizens’ ability to choose politicians who best represent their interests based on policy platforms, which means that certain parts of the electorate are expected to be, on average, less closely represented than those parts that organize their opinions along ideological dimensions.
ABSTRACTING CITIZENS’ PREFERENCES IN TERMS OF POLICY PLATFORMS
Since Downs’s seminal contribution,Footnote 6 spatial voting theories have analyzed voting behavior based on the premise that citizens hold well-defined policy preferences about political outcomes. In the original formulation, political outcomes are described by policy platforms that are ordered along a liberal–conservative ideological dimension, and their platforms perfectly capture all citizens’ preferences. Building on this idea, spatial voting theories make the implicit homogeneity assumption that two voters with the same ideal policy platform possess the same policy views.Footnote 7 The same ideological platforms that organize parties’ and candidates’ programs are thus assumed to perfectly approximate voters’ policy preferences.
This assumption contrasts with results from studies on public opinion and mass belief systems. Authors of these studies take for granted that citizens most seldom ‘express consistently liberal, conservative, or centrist positions on government policy’.Footnote 8 The sociological model of belief systems is built on the idea that political attitudes ‘are organized into coherent structures by political elites for consumption by the public’.Footnote 9 This implies that political platforms do not exist along ideological dimensions per se, but are created by political elites to structure the political process. Citizens adapt these structures to varying degrees. This perspective is most famously associated with Phillip Converse’s chapter, ‘The nature of belief systems in mass publics’.Footnote 10 Based on the analysis of survey responses, he argued that ‘large portions of an electorate do not have meaningful beliefs even on the issues that have formed the basis for intense political controversy among elites for substantial periods of time’.Footnote 11 Instead, citizens most often hold unstructured and inconsistent preferences about political issues.Footnote 12 Overall, this school of thought claims that there is considerable heterogeneity between citizens. Although for some citizens ideal policy platforms may be a reliable abstraction of their opinions, for others they are not.Footnote 13
This article explores the electoral consequences of this conceptualization. The greatest worry for democratic theory is a general public whose political preferences do not equip them to elect representative leaders, because ‘without preferences [..] democratic theory – at least in its most liberal guise – loses its starting point’.Footnote 14 But what matters for representative democracy is not that some citizens show signs of potential inconsistency, but how this could affect the election of representatives. Although electoral researchers often pursue a political-sophistication argumentation, according to which sophisticated citizens with a more reliable understanding of the political space are also more likely to employ policy voting rationalities,Footnote 15 this does not provide theoretical answers to the key concerns inherent in these models: to what extent can voters with preferences that do not coincide with the spatial voting model make valid policy-orientated voting decisions? Contemporary spatial voting theories cannot address the concerns raised by behavioral researchers, as they assume that all citizens hold the same structure regarding policy preferences. To address this shortcoming, the next section outlines an extension to spatial voting theory to model variation in citizens’ preference structures, permitting the analysis of the electoral consequences of varying consistency.
A SPATIAL REPRESENTATION OF CITIZENS’ POLICY BELIEFS
Both formal theories of spatial voting, as well as behavioral researchers, agree that political elites structure their communication in terms of ideological policy platforms. However, in the behavioral conceptualizations discussed above, citizens differ in their ability to abstract their policy views in terms of these platforms. This perspective implies that citizens differ in how strongly ideology constrains their policy preferences. The origin of the theoretical argument presented here is to conceptualize this constraint in terms of variation in citizens’ policy beliefs about their ideal political platform.
Policy beliefs can be integrated into the general utility framework of spatial voting. Instead of supposing that citizens’ preferences are homogeneously approximated by policy platforms, researchers can assume that citizens are – to a specific degree – uncertain which platform is in their own best interest. This uncertainty about the ideal platform can be embodied in terms of voter-specific belief distributions. The idea that preferences regarding outcomes are uncertain is well integrated into general choice theory.Footnote 16
The belief distribution about the different policy platforms is specified in terms of a voter’s state of mind
 ${\rm \Theta }_{i} $
. The specification extends models of spatial voting as, for example, discussed by Jessee,Footnote
17
in which each voter has a fixed ideal point on a one-dimensional spectrum.Footnote
18
Instead it is assumed that voter
 $i$
’s policy belief follows a normal distribution, defined along a one-dimensional policy space.
 $$\Theta _{i} \,\sim\,N(x_{i} ,\sigma _{{\Theta _{i} }}^{2} )$$
This distribution represents the idea that each voter has a mean belief about her ideal policy platform (x
i
), but is uncertain whether her most-preferred position might be slightly to the left or right of it. The extent of uncertainty depends on the variance in beliefs (
 $\sigma _{{{\rm \Theta }_{i} }}^{2} $
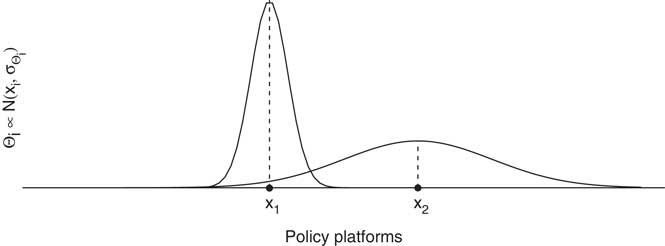
). With increasing belief variance, voters become less certain about their ideal policy outcome. Figure 1 exemplifies the beliefs of two different voters with different mean beliefs. The first voter’s mean belief x
1 is to the left of voter two’s mean belief x
2. The voters also differ in their belief variance. While the first voter is quite certain that her platform yields the most beneficial outcome, the second voter has a wider belief variance and therefore is clearly less certain that a specific platform is in her best interest.
A spatial representation of citizens’ policy beliefs Note: the figure shows policy beliefs of two voters about their ideal policy platform. The voters differ in their mean belief
 $x_{i} $
, but also in their belief variance
 $\sigma _{{{\rm \Theta }_{i} }}^{2} $
. The second voter holds a wider belief variance, compared to the first, and is thereby less certain about the ideal policy platform.
For the argumentation, it is central that the belief variance can be linked to the consistency of policy preferences. The starting point is the assertion that policy beliefs are related to preferences, attitudes and opinions for concrete policy proposals – for example, whether a respondent is opposed to or in favor of gay marriage. Within the spatial voting literature, this link is commonly conceptualized in terms of item response models or factor analytical models.Footnote 19 Basically, a widening of policy belief variance loosens the systematic relationship between ideological platforms and policy preferences, making the latter appear less consistent. For instance, the inconsistency that a self-indicated ideologically liberal voter is in favor of gay marriage but opposed to abortion rights is an irregularity that is often insufficiently explained by variance-constant measurement error, but can straightforwardly be attributed to varying belief variances.Footnote 20 Belief variance adds an additional source of randomness to answering patterns on different policy issues – and an increasing variance causes them to be inconsistent with political platforms.Footnote 21 This line of thought is picked up in the empirical section to derive an operationalization of inconsistency that reflects the theoretical conceptualization of policy beliefs and verifies the theoretical connection between the two.
In contrast to this approach, models of spatial voting rely on the assumption that beliefs about policy platforms are fixed. The implicit assumption is that all voters have the same types of constraints, which – from an adaptive utility perspective – means they would all be equally certain with respect to which platform best represents their interests. Formally, in these theories, voters’ beliefs are fixed to a specific value
 ${\rm \Theta }_{i} {\equals}x_{i} $
, where x
i
represents the most preferred policy platform.Footnote
22
Essentially, this assumption permits spatial theorists to simplify citizens’ overall preferences via their ideal platform. One virtue of this conceptualization is that the standard spatial preference model is nested within the spatial representation of policy beliefs: assuming that all voters possess a belief variance of zero recovers the standard model. The key difference is that the extension allows us to relax the fixed preference assumption and thereby generates leverage to study the consequences of varying inconsistency on voting behavior.
THE INFLUENCE OF POLICY BELIEFS ON VOTING DECISIONS
Policy beliefs can be included in the spatial model of probabilistic voting,Footnote 23 allowing us to analyze the consequences of varying inconsistency for voting decisions. In the following section, I analyze a voter’s decision between two candidates. A voter’s evaluation of a candidate is usually expressed in terms of expected utility and additional unobserved factors. A voter will vote for the first candidate if her overall utility is larger for this candidate, and for the second candidate if the utility is larger for this candidate. This overall utility will be determined by the expected utility and additional, randomly distributed, factors.Footnote 24
Of theoretical concern, then, is how voters form their expected utility based on the candidate’s communicated platform. In spatial voting, utility is derived from the closeness of a candidate’s policy platform to a voter. Each voter receives utility given her policy beliefs about the closeness of a candidate’s platform. In order to model the closeness of a candidate’s platform, I employ a quadratic loss function.Footnote 25 Utility in this specification is a random variable, as a voter’s preferences over the platforms follow the policy beliefs, rather than fixed ideal platforms. Put differently, voters are uncertain about the utility they will receive from a candidate because they are uncertain which platform they most prefer.Footnote 26
An approach that highlights the interaction between candidates and voters might suppose that candidates send certain information about themselves and voters process these signals to learn what they can expect from the candidates.Footnote 27 This learning model focuses on how the communicated policy platforms alter difference in expected utility. The expections from this model are relatively straightforward: for voters with wider policy belief variance, information contained in platform signals is less informative than for voters with consistent policy beliefs. This holds because the information contained in the candidate’s signal depends on the degree of uncertainty a voter possesses about her ideal platform. Expected utility is less strongly affected by policy distance for voters with a wide policy belief variance who are uncertain about their ideal policy platform compared to those with a low belief variance. Formally, this idea can be derived from a Bayesian updating model about the difference in expected utility.Footnote 28 The condensed idea is that voters start off with a prior belief about the utility difference between the candidates and employ the candidate platform signals to learn about this utility difference. The expected utility from the posteriori beliefs results in choice probabilities:
 $$Pr\left[ {V_{{i1}} \,\gt\,V_{{i2}} } \right]\,{\equals}\,\Phi \left[ {{\minus}w_{i} \beta \left[ {(x_{i} {\minus}C_{1} )^{2} {\minus}(x_{i} {\minus}C_{2} )^{2} } \right]} \right],$$
where the derived weight w
i
depends on a voter’s variance in policy beliefs
 $\sigma _{{{\rm \Theta }_{i} }}^{2} $
and thereby on the inconsistency in policy preferences.Footnote
29
The resulting voting probabilities deviate from homogeneous effect models in the literature. If the belief variance increases, the weight on policy distance decreases. It shows that the voting probabilities are less strongly affected when comparing voters with same mean positions but different belief variances. The marginal effect of distance on expected utility decreases with higher levels of variance. In the most extreme case, policy distance has no effect at all, because the platform signals are not informative to these voters.Footnote
30
To sum up, the analysis of a learning model results in the hypothesis that the importance of policy distance is affected by policy inconsistency: policy distance should be more important for voters with consistent policy preferences, and less important for those with inconsistent preferences. The next section outlines an empirical test that closely follows the conceptualization of the theoretical model.
A POLICY-WEIGHTED MODEL FOR SPATIAL VOTING DECISIONS
The US presidential election of 4 November 2008 constitutes an ideal case in which to obtain estimates for the outlined model. The expectations are derived for a situation in which two candidates compete for votes by signaling their policy platforms, and those platform signals are equally well observed by the electorate. The vast amount of campaign spending and media coverage in presidential elections make this a plausible assumption.Footnote 31 I mostly rely on Wave 10 of the 2008–2009 American National Election Panel Study, as the interviews were conducted in the weeks prior to the election.Footnote 32
The expectations can be tested using an empirical specification similar to the theoretical model. According to this model, respondents should put different weights on policy distance when forming the expected utility difference between two candidates. The specific weight that each respondent assigns to policy distance is a function of the variance in policy beliefs. This function can be approximated to be linear, which naturally results in an interaction effect model to test for the mediating effect. The direct effect represents the effect of policy distance for voters with zero belief variance, and an interaction term estimates if respondents with increasing belief variance put less, more or equal weight on policy when forming expected utility. Thus, under the theoretical model, one would expect a negative interaction effect parameter. The empirical specification is completed by further adding an intercept, a set of socio-demographic and political controls, and a direct effect of inconsistency. Given that vote choice is a binary indicator if a respondent intends to vote for the first or second candidate, and the difference in unobserved factors is assumed to be standardized normal, the model results in a standard probit specification.Footnote 33 The next section describes the operationalization of respondents’ inconsistency, candidates’ policy platforms, respondents’ policy beliefs, voting intentions and a set of controls in more detail.
MEASUREMENT OF INCONSISTENCY AND POLICY PLATFORMS IN THE AMERICAN NATIONAL ELECTION STUDIES 2008
To estimate the outlined model, reliable measurements of voters’ policy beliefs and candidate platforms are needed. The basis of the measurements is a battery of eight policy questions included in the American National Election Studies (ANES) 2008, concerning gay marriage, taxation, health care, terrorism and immigration.Footnote 34 Respondents are first asked whether they favor, are opposed to, or neither favor nor oppose a certain preposition – for example, ‘Do you favor or oppose illegal immigrants becoming citizens?’ Afterwards they are asked about the strength of their expressed attitudes on a three-point scale (‘a great deal’, ‘moderately’, ‘a little’). This creates seven-point scales that represent voters’ preferences for the different policy proposals.
Voters’ mean policy beliefs are estimated using a one-dimensional factor model.Footnote 35 Based on these answering patterns, factor loadings are extracted based on an explanatory factor analysis. The one-dimensional factor model has reasonable fit (RMSE of 0.09) and the factor loadings correlate highly with self-placements in this wave.Footnote 36 Additionally, voters are asked to locate the presidential candidates on the same seven-point scales. Using the factor loadings from the model, these placements can be employed to project candidates on the same dimension.Footnote 37 I use this to construct two measurements of difference in quadratic policy distance: the policy distance to the mean perceived political platform and the individual perceived political platform.Footnote 38
Crucial to the empirical analysis is the measurement of the policy belief variance that is linked to inconsistent policy preferences. In order to directly test the theoretical expectations, the analysis opts for a close connection between the theoretical specification and the empirical measurement of inconsistency.Footnote 39 The starting point is the connection between policy preferences and ideological orientation as discussed in the theory section. Given that respondents’ attitudes towards the specific proposals can be expressed as a linear function of their beliefs about policy platforms, increased belief variance should result in more randomness when relating answering patterns for concrete policy proposals to policy platforms. This is because it adds an additional stochastic element to the model. Formally, after considering the mean platform, the variance in responses to the policy proposal is not only a function of measurement error, but also of the belief variance. Based on this, it is possible to derive an estimator that approximates the belief variance as the average sum of squared residuals when regressing the mean platform belief on the attitude towards the policy proposal. Following this, I estimate separate regressions of a respondent’s average liberal–conservative self-placement on the battery of policy issues. Based on the regression residuals for each individual I then calculate the average sum of squared errors and use them to measure variation in consistency with underlying platforms.Footnote 40
The inconsistency measurement can generally be understood as the average deviation from the ideologically expected answering pattern. This mimics the original conceptualization found in Converse’s chapter,Footnote 41 in which ideological belief systems are argued to impose a structure that generates certain expectations about policy views.Footnote 42 The set of expectations here is approximated using different regressions, confirming, for example, that self-indicated ideological liberal respondents is expected to be in favor of gay marriage and high income taxation. Strongly deviating from this rule creates an inconsistency that is then reflected in the estimator. A liberal respondent who confirms with both expectations has a smaller average residual than a liberal respondent who is unexpectedly opposed to high income taxation. In this, the measurement creates variation between respondents who align their attitudes fairly closely to their ideological platform and those who reveal inconsistent policy preferences. The analysis further includes a set of controls in the full specification: a respondent’s party identification, age, gender, race (African-American), education, home ownership and income. All are based on fairly common survey questions from the ANES.Footnote 43
MAIN RESULTS: THE DECREASING IMPORTANCE OF POLICY DISTANCE
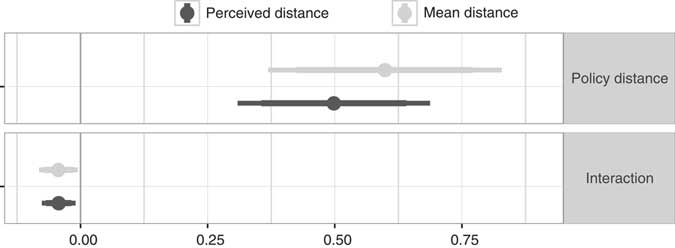
The estimates for the direct effect of policy distance and the interaction effect are plotted in Figure 2. The model relies once on the negative quadratic distance to the mean candidate platform, and once on the perceived candidate platform. In both cases, the estimate of the direct effect is positive, implying that the closer a respondent is to Obama than to McCain, the higher the respondent’s chances of voting for Obama. The estimate of the interaction effect that affects the weight voters put on policy distance is negative. Both parameter estimates are statistically distinguishable from zero, as the 95 per cent confidence intervals do not include zero.Footnote 44
Parameter estimates for policy-weighted model using perceived (black) and mean distance (grey) to candidate platform Note: the figure shows point estimates as well as 95 per cent and 99 per cent confidence intervals for the direct effect of policy distance and interaction effect with inconsistency.

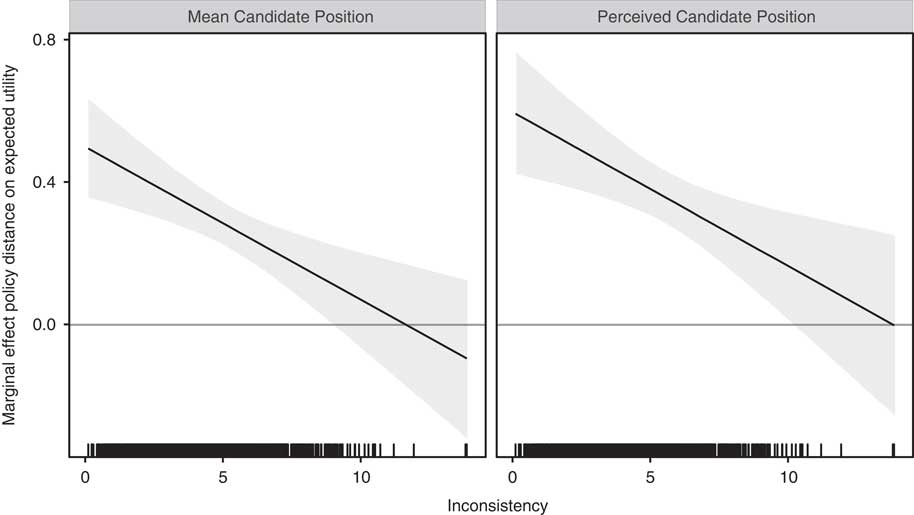
The parameter estimates imply a decreasing marginal effect of policy distance on expected utility with increasing inconsistency. Figure 3 shows the marginal effect on expected utility calculated from both models. For both, the marginal effect decreases from around 0.5/0.6 to below zero. The resulting empirical pattern is in line with the expectations from the learning model and recovers an important implication of this model. Policy distance affects the voting decisions of (almost) all voters. The marginal effect fails to reach signifcance only for the 2 per cent of respondents with the weakest constraint. Thus distance to candidate’s signaled platform is informative to all, but the results clearly highlight that it is less informative for voters who do not structure their preferences in line with ideological platforms. Those citizens put less weight on policy distance when deciding which candidate generates higher expected utility.
Marginal effect of policy distance on difference in expected utility for varying levels of inconsistency Note: the left panel shows the marginal effect for mean candidate positions, the right panel for perceived candidate distance. The lines on the x-axis show the distribution of inconsistency in the sample.
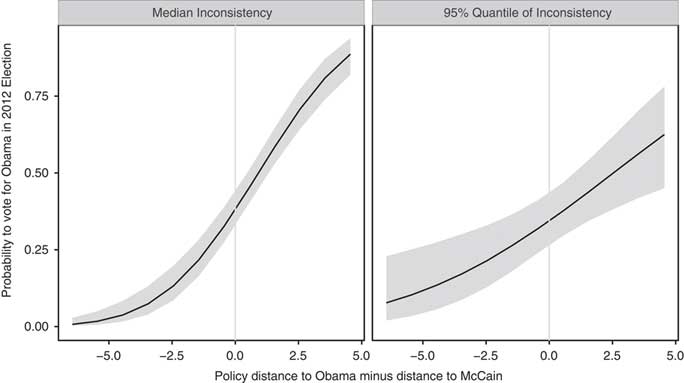
Although this confirms the expectation regarding the decreasing marginal effect on expected utility, the extent to which this also influences the marginal effect of policy distance on voting intention needs further investigation.Footnote 45 This effect becomes apparent when comparing the voting probabilities of a median inconsistency respondent with a respondent from the 95 per cent quantile of inconsistency. Figure 4 shows the simulated predicted probabilities at different values of policy distances.Footnote 46 While policy distance has a strong effect for a respondent with medium consistency, this effect is weaker for a respondent with strong inconsistency. It is important to note that the effect of policy distance at the 95 per cent quantile is still present, as the probability of voting for Obama still increases from 0.4 (with the same distance to both Obama and McCain) to over 0.75 (for voters who are close to Obama and furthest away from McCain’s platform). This again supports the implication that policy distance affects the voting decisions of all citizens, but less so for those with inconsistent policy preferences. I conduct a series of robustness checks, and find support that the main results hold with other measurements, are robust when taking into account measurement uncertainty in inconsistency, and are further evident when applied to another set of policy issues for voting decisions in the 2012 presidential elections.Footnote 47
Probability to vote for Obama by policy distance to obama minus distance to McCain simulated from mean platform model Note: the left panel shows the voting probabilities for a respondent with consistent policy preferences (value correspondent to the median value in the sample). The right panel shows the voting probabilities for respondent with inconsistent policy preferences (value correspondent to the 95 per cent quantile in the sample).
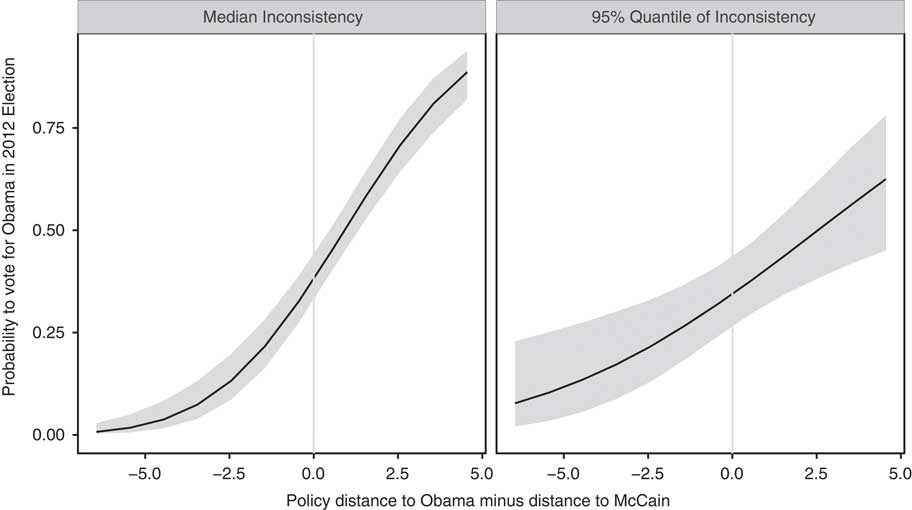
Taken together, the evidence presented in this analysis supports the expectation from the learning perspective. Voters with inconsistent, unconstrained policy preferences put less weight on policy distance. The theoretical foundation tells us something important about the mechanisms of this relationship. Rather than understanding voting decisions as the static formation of expected utilities, voters seem to use platform signals to learn about the expected benefit of their decisions for themselves. For some parts of the electorate, the signals are meaningful and helpful in choosing candidates; for others they are not. This has far-reaching implications for political representation, as will be discussed below.
IMPLICATIONS: EXPECTED REPRESENTATIONAL CLOSENESS
The systematically varying effect of policy distance influences the representation of citizens’ political interests. If citizens with inconsistent policy preferences rely less on policy platforms when deciding which candidate to vote for, they can be expected to be further away from their representatives. The variation in representational closeness can be depicted in terms of the expected distance to the candidate for whom a citizen intends to vote.Footnote 48
Figure 5 shows the expected representational closeness for the 2008 presidential election. The figure plots the simulated sampling distribution of the average expected distance for different levels of inconsistency.Footnote 49 Respondents with consistent policy preferences (10 per cent percentile of inconsistency measurement) are expected to be closer to the candidate they intend to vote for compared to voters with inconsistent policy preferences (90 per cent percentile of inconsistency measurement). Voters at median values are found in between the two. The values are meaningful on the original scale. A zero indicates that voters are expected to share the same platform as the candidate they intend to vote for. Of course, given that candidates only offer one platform and voter positions diverge from this, on average, voters will be expected to be at some distance from their representative. Still, voters with consistent policy preferences are expected to be relatively close to their representative (average of −0.45 on scale with range around 3.5). For voters with inconsistent preferences, this increase of around 35 per cent highlights the looser connection to their representatives.
Average expected distance for varying degrees of inconsistency Note: the x-axis shows the expected distance to a respondent's representative. Values of zero imply that a voter is expected to share the same position with the candidate she intends to vote for. Decreasing values indicate a stronger expected distance.
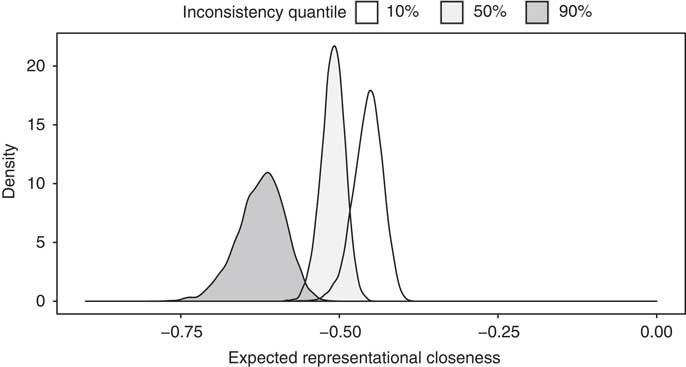
The analysis underscores the importance of the theoretical extensions to spatial voting models for our understanding of political representation. Parts of the electorate that do not structure their policy preferences in terms of the underlying dimensions of politics are expected to be less closely represented.
DISCUSSION
Citizens with views on different issues that are not organized in liberal vs. conservative terms rely less on distance when deciding which candidate to vote for, compared to citizens with well-defined policy preferences. This article offers a comprehensive theoretical explanation for this hypothesis. The way that citizens form expected utility about political programs depends on each citizen’s own policy belief regarding what political outcomes they would like to see. Because these beliefs exhibit varying constraints, candidates’ communicated platforms are informative to a different degree to citizens. This means that in learning about their representative match, citizens place different levels of emphasis on policy considerations. The empirical results on the basis of the 2008 presidential elections underscore that this extension to spatial models of vote choice has important implications for political representation. While citizens who structure their preferences in line with the underlying dimension of politics are expected to find closely matching candidates, citizens who do not are expected to be further away from their representatives.
While previous empirical studies tested a related political sophistication hypothesis about heterogeneity in spatial voting decisions,Footnote 50 in which less informed or aware voters rely less on policy distance, this article is the first to put these suppositions on a solid theoretical basis. The argumentation highlights that those prior findings might work through differences in ideological structures that are potentially interrelated with political awareness and the motivation to acquire necessary political information. The theoretical model then investigates a concrete mechanism through which those concepts affect voters’ decision making. The ongoing interaction between candidates and voters, and how voters learn what they can expect from different candidates, is argued to be one key to understanding heterogeneity in a voter’s decision calculus. In this, the theoretical model extends on prior empirical studies on the matter, but also imposes a perspective on how those models can be integrated into widely applied spatial models of vote choice.
The theoretical formulation also clearly speaks to directional theories of spatial voting that tried to integrate doubts about citizens’ ideological competence into a general policy-based voting theory. Directional theories of vote choice argue that citizens have a less concrete notion of policy preferences than the classic model assumes. The basic claim is that citizens’ preferences are actually directional: they prefer parties that are on their side of the ideological spectrum and those that take on more intense positions.Footnote 51 Essentially, directional models make the same homogeneity assumption as the classic models do, but formulate them in the ‘opposite’ direction: all individuals possess a vague directional policy preference. This is in contrast to the homogeneity assumption in the classic model, in which all citizens possess the same consistency in policy preferences. The developed spatial representation of citizen’s policy beliefs offers a powerful theory to uncover empirically evident – but under-theorized – ‘heterogeneous decision rules’.Footnote 52
There is a well-known assertion in the literature that two broad ideological dimensions structure political conflict – economic and cultural.Footnote 53 To acknowledge these findings, the policy belief conceptualization can be extended to multiple dimensions by defining multivariate belief distributions. This task will involve further conceptual clarifications and offer an enriched representation of the ideological structure of the general public. For instance, the supposition that the electorate holds defined positions on cultural but not on economic issues, and how this matters, can be approached with this extension. Developing a more fine-grained two-dimensional inconsistency measurement might also be important for capturing central heterogeneity. In its current form, the inconsistency measurement picks up two groups of respondents: those who posses weak, essentially random, attitudes and those who have a crystallized mix of strong liberal and strong conservative attitudes. While Appendix Section E.4 shows that this does not affect the results in the main text, a two-dimensional extension could potentiality differentiate between those two groups, providing a more accurate estimate of the moderating effect.
In general, the argumentation attempts to alleviate tensions between opposing positions in political science research by showing that political behaviorists’ sentiments about spatial theorists’ depictions of policy preferences can be integrated using an extension of the theory. The model extension grants spatial theorists the leverage to study political concepts that were hitherto only integrated into models of political behavior. Up-to-date findings from political psychology and public opinion are seldom integrated into spatial voting models, as these models build on a strong axiomatic assumption that voters have exogenous and fixed preferences. This assumption, for example, makes it impossible to study how preferences change over time and can be influenced by environmental circumstances. For many political scientists the important part of the political process is why citizens hold specific beliefs in the first place, and how they can be influenced.Footnote 54 Further research can build on the model’s reciprocal interaction between voters and parties including persuasion and campaigning.
Returning to the starting point, we should ask what all of this implies for democratic representation. If ordinary voters are not equipped with rigorous policy preferences, does this distort the simple model of representative democracy? The findings indicate that it does to a certain degree. For citizens who do not live up to the axiomatic preference portrayal adopted in simple models of representation, the ideal of equal political representation is somewhat hampered. Those parts of the electorate will find it considerably harder to identify ideologically similiar politicians. The theoretical considerations, however, reveal the conditions under which voters are able to use policy platforms to make informed, considered decisions and find matching representatives. If all citizens have policy beliefs with only a small belief variance (which implies that they can exactly identify their ideal policy platform), the model presented shows convergence with the classic perspective: voters will find it easy to find the closest match. This implies that citizens need to be able to learn about their expected benefit from different policy platforms.