Implications
For cattle on pasture in temperate regions, it is largely unknown (a) if heat-related discomfort occurs frequent enough and is severe enough to require preventative measures, and (b) if shade is adequate to prevent heat-related discomfort. This study monitored behavioural indicators of thermal discomfort in Holstein dairy cows and Belgian Blue beef cows during three summers, in Belgium. The findings suggest that hot summer conditions cause thermal discomfort as evidenced by an increase in shade use, respiration rate and panting. Shade provided by trees and shade cloth hung between them reduced the degree of thermal discomfort.
Introduction
In most temperate regions, beef and dairy cattle are kept on pasture for at least part of the year, especially during the summer. Pasturing has some important benefits for cattle health and welfare, but it also poses disadvantages and risks, including exposure to adverse weather conditions (van den Pol-van Dasselaar, Reference van den Pol-van Dasselaar2005).
In subtropical regions, heat stress (behavioural and physiological effects of hot ambient conditions) has been thoroughly documented to negatively impact the health, welfare and productivity of unsheltered cattle. Shade provision is known to alleviate many signs of heat stress, as reviewed by, for example, Armstrong (Reference Armstrong1994). In temperate regions, however, fewer studies have been done on the need for and effectiveness of shade (reviewed by Van laer et al., Reference Van laer, Moons, Sonck and Tuyttens2014). Recent research (e.g. Hammami et al., Reference Hammami, Bormann, M’hamdi, Montaldo and Gengler2013) has shown that traditional climatic indices and associated threshold values to define heat stress are outdated and too general to evaluate heat stress in cows currently kept in temperate areas. Observations based on new heat stress thresholds for traditional heat stress indices show that summer climatic conditions occasionally do fall outside highly productive cattle’s thermoneutral zone, even in temperate areas, such as Belgium (Van laer et al., Reference Van laer, Moons, Sonck and Tuyttens2014).
In Holstein dairy cows, the most common dairy breed used in temperate regions, genetic selection has doubled the milk yield per cow in the last 40 years (Oltenacu and Broom, Reference Oltenacu and Broom2010). Such a high production level requires a high metabolic rate, which results in considerable metabolic heat production (Fuquay, Reference Fuquay1981; Kadzere et al., Reference Kadzere, Murphy, Silanikove and Maltz2002), which makes it difficult for the cow to dissipate its body heat under hot ambient conditions. The double-muscled Belgian Blue breed (the dominant breed in the Belgian beef industry) is assumed to be more susceptible to heat stress than most other beef breeds (Halipre, Reference Halipre1973), owing to reduced oxygen transport efficiency (Lekeux et al., Reference Lekeux, Amory, Desmecht, Gustin, Linden and Rollin2009) and reduced pulmonary and cardiac function (Gustin et al., Reference Gustin, Bakima, Art, Lekeux, Lomba and van de Woestijne1988; Amory et al., Reference Amory, Rollin, Desmecht, Linden and Lekeux1992). This is caused by the relatively small volume of heart and lungs (in comparison with the body volume) and the aberrant myostatin gene (Grobet et al., Reference Grobet, Poncelet, Royo, Brouwers, Pirottin, Michaux, Ménissier, Zanotti, Dunner and Georges1998). Research on heat stress in Belgian Blue beef cattle is limited, however, to field studies on the sheltering behaviour of Belgian pastoral beef cattle (Rosselle et al., Reference Rosselle, Permentier, Verbeke, Driessen and Geers2013).
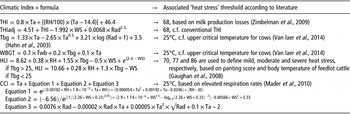
Two main strategies are used to assess the need for protection against heat stress: weather-based or animal-based measures. The panting score (PS) is an example of the latter and is based on visual evaluation of the presence and degree of two important heat stress signs in cattle, panting and drooling (Mader et al., Reference Mader, Davis and Brown-Brandl2006 and Reference Mader, Johnson and Gaughan2010; Schütz et al. Reference Schütz, Cox and Tucker2014). The score varies between 0 (no panting or drooling) and 4.5 (extreme panting and drooling). Meat & Livestock Australia advises cattle keepers to cease all handling and movement of cattle as soon as 10% of cattle have a PS of 2 or above (http://www.mla.com.au/files/02daccf7-a8ef-4c2e-9288-9d5900e40fa9/heatload-in-feedlot-cattle.pdf). Proactive planning of cattle handling and management based on weather-predictions, requires antecedent validation of climatic heat stress indices and associated heat stress thresholds (Table 1). Not all heat stress thresholds have been validated based on animal-based measures, but the more recent climatic indices, such as the heat load index (HLI; Gaughan et al., Reference Gaughan, Mader, Holt and Lisle2008), an adjusted version of the temperature humidity index (Mader et al., Reference Mader, Davis and Brown-Brandl2006) and the comprehensive climatic index (Mader et al., Reference Mader, Johnson and Gaughan2010) do have validated heat stress thresholds (Table 1). In addition, Gaughan et al. (Reference Gaughan, Mader, Holt, Sullivan and Hahn2010b) compared the tolerance to increasing HLI values, based on increasing PS, for several (n=17 total) Bos indicus, Bos taurus and B. indicus×B. taurus feedlot steers, during summertime in Australia, which is characterised by a warm climate. However, heat tolerance of cattle (even within the same breed) may also vary according to their degree of adaptation, which is different when the cattle are kept in warm v. temperate climate. Furthermore, the tolerance to increasing HLI values has not yet been evaluated, for Holstein dairy cows (very common in temperate climate) and Belgian Blue beef cows (very common in Belgium), based on increasing PS.
Overview of climatic indices used in cattle research to quantify the effects of hot summer conditions

THI=temperature humidity index; THIadj=adjusted version of the temperature humidity index; Tbg=black globe temperature in °C; WBGT=wet bulb globe temperature in °C; HLI=heat load index; CCI=comprehensive climate index in °C; Ta=air temperature in °C; Rad=solar radiation in W/m2; RH=% air humidity; WS=wind speed in m/s; Twb=wet bulb temperature in °C.
To address the above-mentioned lack of knowledge, an experiment was carried out over the course of three summers, to evaluate the need for and the effectiveness of shade as protection against hot summer conditions, as quantified by the HLI, specifically for Holstein dairy cattle and Belgian Blue beef cattle on pasture in a temperate region (Flanders, Belgium). Effects of hot summer conditions and shade on the body temperature, energy metabolism and productivity of the Holstein dairy cows in this experiment, are described in a separate publication. The current paper focusses on:
-
1) the assessment of the degree of thermal discomfort caused by the summer conditions for the Holstein dairy cows and Belgian Blue beef cows on pasture, as indicated by elevated respiration rates (RR) and PS;
-
2) the evaluation of the effectiveness of shade, by relating voluntary use of shade (by the two cattle types) to climatic conditions and by studying the effect of shade on RR and PS.
Material and methods
Timing and location of the study
The study took place during three subsequent summers (2011, 2012 and 2013; Table 2) and was approved by the Animal Ethics Committee of the Institute for Agricultural and Fisheries Research (ILVO) (application no. 2011/151 and 2011/151bis). The experiment took place at ILVO’s experimental farm (latitude 50°59'1"N, longitude 3°46"49"E). Holstein dairy cows were rotationally kept on four (in 2011) or two (in 2012 and 2013) different pastures. The Belgian Blue beef cows were kept on two adjacent pastures (in 2011, 2012 and 2013). Each pasture was neighboured by a shaded area surrounded by an electric fence. This shaded area could be accessed from either of the two adjacent pastures through a 3 to 5-m wide passage. The shade was provided by young trees and shade cloth (shading percentage=80%) spanned between them (more details are given in Supplementary Figure S1). The two shaded areas for dairy cattle (625 m2 each) were used by maximum 60 dairy cows on the adjacent pastures, thus they offered at least 10.5 m2 of shade per cow. The shaded area for the Belgian Blue beef cows was 900 m2, and was used by a maximum of 15 cows and nine calves. Therefore, it offered at least 37.5 m2 of shade per cow or calf.
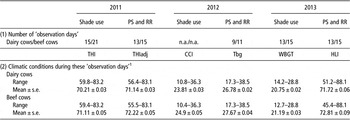
Overview of (1) the number of days on which shade use, PS, and RR were observed, and (2) the climatic conditions on these ‘observation days’Footnote 1

PS=panting score; RR=respiration rate; n.a.=not applicable, because shade was not available; THI=temperature humidity index; THIadj=adjusted version of the temperature humidity index; CCI=comprehensive climate index in °C; Tbg=black globe temperature in °C; HLI=heat load index; WBGT=wet bulb globe temperature in °C.
1 Range and mean (±s.e.) during observation hours are given for the pooled data from 2011, 2012 and 2013.
Animals and management
The number of lactating Holstein-Friesian dairy cows used in this experiment varied between 60 and 110 due to dry cows leaving the herd and recently calved cows and heifers and cows nearing parturition being added. Cows and heifers were 199.3±100.6 (mean±s.d.) days in milk, parity ranged between 0 and 7 (mean±s.d.: 2.2±1.3) and the mean daily milk production was 27.7±7.1 l/day (mean±s.d.). All cows were milked twice daily (starting around 0530 h and starting around 1530 h) and received half of the daily portion of concentrate during each milking. After milking they were fed the daily mixed ration of mainly corn silage (49% to 76%, 60% on average) and prewilted grass silage (9% to 29%, 21% on average), supplemented with a protein source (soybean meal or protected soybean meal) and wheat or corn cobb mix. In addition, during some periods the ration was completed with pressed beet pulp (0% to 25%, 9% on average) and/or by-products from bio-ethanol or starch industry. This mixed ration was provided in feed troughs located in a loose housing stable (in 2011 and 2012) or in an open-air passage to pasture (in 2013) located behind the milking parlour. During the entire study period, the dairy cows were kept on pasture where they could graze ad libitum, except for during milking.
A herd of 30 Belgian Blue beef cows was used in this experiment. These cows were between 0 and 209 days in milk (mean±s.d.: 60.1±61.2), parity ranged between 1 and 4 (mean±s.d.: 1.6±0.8) and age varied between 2 and 7.2 years (mean±s.d.: 3.4±1.1). Their suckling calves were kept with the cows, on pasture, from 2 weeks of age until weaning (16 weeks) in 2011 (n=18) and 2012 (n=15). In 2013 no calves were kept with the cows. In the current publication, we only report on our observations on adult cattle (dairy and beef cattle), not on the calves.
Only at the end of each summer (starting at the end of August, in the 3 years), the beef cattle received some additional grass silage and/or maize silage, because the grass availability on their pastures was deemed to be low. The feed was provided in a mobile feed bunk in a non-shaded part of the pastures and at a time that did not coincide with the monitoring of cattle’s use of shade. During the entire study period, cows and calves stayed on pasture permanently, except during the monthly veterinary check-ups (pregnancy detection and weighing), during artificial insemination (no bull was kept on pasture for safety reasons) and during the week of weaning.
In 2011 and 2012, water was provided at several (minimum two per allotment) watering points (large open troughs and additional individual drinkers) spread across the non-shaded parts of the pasture. In 2013, an additional large open water trough was placed inside each shaded area.
Experimental treatments
During the summers of 2011 and 2013, the dairy herd was divided into two treatment groups. By randomly assigning the members of ‘matched’ pairs of cows to either treatment, the dairy treatment groups were as comparable as possible with regard to traits known to affect susceptibility to heat stress (i.e. productivity, parity, age and percentage of black coat). Similarly, the herd of 30 Belgian Blue beef cows was divided into two treatment groups. Again, random assignment of ‘matched’ pairs of cows to either treatment, made the treatment groups as comparable as possible in terms of the distribution of parity, age, weight, percentage of black coat and, in 2011 and 2012, in terms of the number of suckling calves. During the summers of 2011 and 2013, in each herd one group (the S treatment) could always access the shaded area, whereas the other group (the NS treatment) never had access to shade when kept on pasture. In order to exclude potential confounding effects of allotment to either of the two or four (in case of dairy cattle in 2011) pastures available per cattle breed (e.g. pasture productivity or composition, location of drinking troughs, etc.) on the cows’ behaviour or productivity, NS and S groups were regularly (for dairy cows daily, for beef cows weekly) switched between allotments (Supplementary Figure S1). During the summer of 2012, both herds (dairy and beef) were kept on the same pastures as in 2011 and 2013, but none of the animals had access to shade (the NS treatment). The same animal observations were made as in 2011 and 2013 and these data were pooled with those from the NS treatment in 2011 and 2013 to investigate the effect of climatic conditions as such on the RR and PS.
Climatic data
A custom-built Campbell Scientific BWS200 weather station (Campbell Scientific Inc., Logan, UT, USA) located in open pasture, within 500 m of all pastures used in the trial, recorded the average air temperature, air humidity, solar radiation and wind speed every 15 min. Based on these measurements, 15-min values of six climatic indices were calculated (Table 1).
In order to evaluate the effect of shade on microclimate, additional measurements of black globe temperature (Tbg) were conducted, using Testo 400’s Wet Bulb Globe Temperature probe (Testo AG Inc., Lenzkirch, Germany), under shade and outside of shade. During eight measurement sessions, on 7 days for which the weather forecast predicted daily maximum temperatures ⩾25°C, Tbg was measured at 1.5-m height, under shade and in open area nearby, for each of the shaded areas. Three measurement sessions took place between 1000 and 1230 h, two sessions between 1200 and 1430 h and three sessions between 1330 and 1600 h. During each measurement session, three instantaneous measurements were taken inside and outside of each shaded area. The measurements outside of shade were taken on three locations 20 to 50 m away from each shaded area.
Animal observations
Use of shade
The use of shade by the individual animals from the S treatment was monitored between 1000 h and the time of evening milking (~1500 h) for dairy cows, and between 1000 h and late afternoon (ranging between 1500 and 1800 h) for beef cows, on several days (Table 2) during the summers of 2011 and 2013, to include a range of climatic conditions between thermoneutral and hot. An unmanned camera (Sony HDR-CX220E, Sony Europe LTD, Zaventem, Belgium) filmed the cow’s passage to and from the shaded area.
A cow was considered to have entered the shaded area when, coming from the unshaded pasture, she passed the 3 to 5-m wide opening in the electric fence with the four hooves. Similarly, a cow was considered to have left the shaded area when she passed the opening in the electric fence in the opposite direction, with four hooves.
Based on the time recordings of each individual cow’s ‘entering’ and ‘leaving’ events, individual use of the shaded area was determined per cow by one/zero recording at 15-min intervals. This means that for each 15-min interval, each cow was classified as having used shade (the shaded area) or not. Individual cows were identified from the video footage by numbers painted on their flanks using oil-based heat detection tail paint (Tell Tail; FIL, Mount Maunganui, New Zealand) in 2011 and based on the individual coat pattern in 2013.
RR and PS
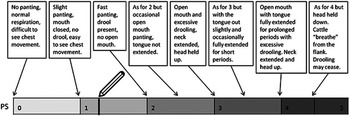
The RR and PS were monitored, for dairy and beef cows with and without access to shade, during the same time periods as for the monitoring of shade use (see above) and for almost all days on which shade use (of S cows) was recorded (2011 and 2013) and on 12 other thermoneutral and hot days in 2012 (Table 2). In the beef herd (30 cows), each animal (S and NS) was sampled once per hour. In 2011 and 2013, the observer switched between the S and NS group every half hour. In the larger dairy herd (minimum 60 cows, maximum 110 cows), it was not possible to sample each animal every hour. Instead, in 2012, the observer aimed to sample 60 cows (all NS) during each hourly scan. In reality, 56 cows were sampled on average (s.d.=7, minimum=33, maximum=76). Which cows were sampled, was determined semi-randomly, based on their proximity and visibility to the observer. In 2011 and 2013, the observer aimed to sample 30 cows during every hourly scan in each treatment group, switching between the S and NS group every half hour. In the S group, the observer sampled as many animals in shade as possible. In the NS group, sampled cows were selected semi-randomly, based on their proximity and visibility to the observer. The RR was determined by timing five respirations (flank movements) and converting this to the number of breaths per minute (BPM). PS was scored on a tagged visual analogue scale, labelled with the descriptors of Gaughan et al. (Reference Gaughan, Mader, Holt and Lisle2008) (Figure 1), and as in Tuyttens et al. (Reference Tuyttens, de Graaf, Heerkens, Jacobs, Nalon, Ott, Stadig, Van Laer and Ampe2014). Over the course of the three summers, one permanent observer and five different additional observers scored RR and PS. All additional observers were trained by the permanent observer, based on repeated scoring of at least 20 different movies (in randomized order) of cattle with varying RR and PS, until there was sufficient agreement between the permanent and additional observer (<10% deviance in RR and PS).
The tagged visual analogue scale labelled with descriptors to determine cattle PS. PS=panting scores.

Data analysis
Effect of shade on microclimate
The difference in Tbg measured in open area and under shade was modelled using a mixed model ANOVA (proc mixed in SAS 9.3). Measurement session and shade area were included as random intercept effects.
Use of shade
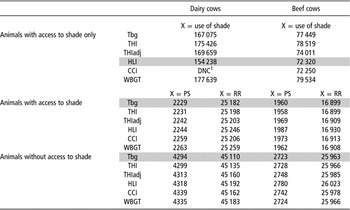
Per cow type (separately for dairy cows and beef cows), for the animals from the S treatment we examined the effect of hot conditions, as quantified by the six abovementioned climatic indices, on the use of shade (per 15 min, binomially distributed) by means of a mixed model logistic regression (proc glimmix in SAS 9.4), which modelled the probability of use of shade as a function of the climatic index under focus and its interaction with the effect of year (2011 or 2013). These models all included a random factor to correct for repeated measurements per cow. For both cow types, all climatic indices had a highly significant (P<0.0001) positive effect on the probability of shade use, but the HLI yielded the best fit, that is, the lowest corrected Pseudo-AICC (corrected Akaike Information Criterium) value (Table 3). Consequently, we only report on shade use as a function of HLI. The logistic regression models yield the probability of shade use as an outcome variable. This probability can be interpreted as the probability that an individual cow will use shade at a given HLI value, which is essentially the same as the proportion of the group that can be expected to use shade at a given HLI value. We interpret a shade use probability ⩾10% as an indication of thermal discomfort outside shade.
Pseudo-AICC value for the different models (with different climatic indices) tested for the use of shade, PS and RR

PS=panting score; RR=respiration rate; THI=temperature humidity index; THIadj=adjusted version of the temperature humidity index; CCI=comprehensive climate index in °C; Tbg=black globe temperature in °C; HLI=heat load index; WBGT=wet bulb globe temperature in °C.
The climatic index that yielded the lowest Pseudo-AICC (corrected Akaike Information Criterion) value was considered the best explaining index and is shaded.
1 DNC: model did not converge.
RR and PS
Per cow type, the effect of hot summer conditions (as quantified by the six climatic indices) on RR and PS of animals from the NS treatment (including pooled data from 2012, 2011 and 2013) was investigated by means of six mixed linear regressions (proc mixed in SAS 9.4), each of which modelled the RR and PS as a function of the climatic index under focus. For the cows from the S treatment, the effect of hot summer conditions and use of shade on RR and PS was investigated by means of a mixed linear regression, which modelled the RR and PS as a function of (1) the climatic index under focus, (2) the effect of using shade (1 if the observed cow was in shade, 0 if the observed cow was not in shade at the moment of observation) and the interaction between (1) and (2). These mixed models all included a random factor to correct for repeated measurements per cow per day. The models with Tbg consistently yielded the lowest Pseudo-AICC value and thus the best fit (Table 3). Thus, we only report on RR and PS as functions of Tbg.
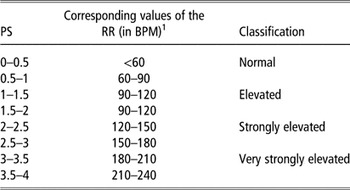
The subsequent analyses used data pooled over the three summers, S and NS treatment, but only from hours during which the average value of Tbg ⩾30°C (because the shade use model as a function of Tbg predicted a shade use probability of ⩾10% when Tbg ⩾30°C). Per hourly scan with Tbg ⩾30°C, and per cow type, we determined the percentage of observations where the PS <1 (normal), 1 to 2 (elevated) and ⩾2 (strongly elevated), for cows under and outside of shade. Per cow type, we used three separate linear mixed models (proc mixed in SAS 9.4) to compare these prevalence percentages between cows in the shaded area and outside of it. The same approach was used to compare the prevalence of normal, elevated and strongly elevated RR values, between animals in the shade and outside of it. The threshold values for the RR categories (per animal type) were based on the correlation between PS and RR scored in the same observation (Table 4). The mixed models all included a random factor to correct for repeated measurements per day. The data were sufficiently normally distributed, based on histograms and qq-plots of the residuals.
Definition of RR categories corresponding to PS categories

RR=respiration rate; PS=panting scores; BPM=breaths per minute.
1 Based on the relationship (per animal type) between PS and RR, which was always relatively strong and quite alike; when no shade was used, RR=35+50×PS (R 2=0.61) for dairy cows and RR=40+49×PS (R 2=0.71) for beef cows; when shade was used, RR=32+57×PS (R 2=0.53) for dairy cows and RR=31+50×PS (R 2=0.52) for beef cows.
Results
Effect of shade on microclimate
Shade lowered Tbg by 3.8°C (P=0.004). The mean (±s.e.) Tbg was 25.7±2.3°C under shade and 29.6±2.3°C outside of shade.
Use of shade
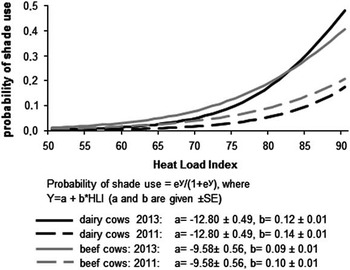
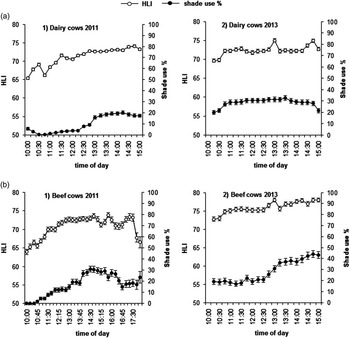
The responses of dairy cows and beef cows to HLI differed between 2011 and 2013. In 2013 the probability of shade use increased more steeply with increasing HLI than in 2011 (Figure 2). In 2011, shade use probability reached ⩾10% at an HLI of 85 for dairy cows and 81 for beef cows (Figure 2). In 2013, the shade use probability reached ⩾10% at an HLI of 75 for dairy cows and 72 for beef cows (Figure 2). These models provide realistic results, as shown by their comparison with the raw data (Figure 3). The mean percentage of shade use increased along with the mean value for HLI per time of day, for dairy cows (Figure 3a) and beef cows (Figure 3b). In both cases, the HLI increased gradually from 1000 to 1500 h. For dairy cows in 2011, the use of shade also increased gradually from 1000 h onwards, to reach a maximum around 20% at about 1330 h (Figure 3a1). In 2013, the increase in both HLI and shade use over the course of the day was less steep. For beef cows in 2011, between 1000 and 1500 h, shade use increased along with increasing HLI, to reach about 30% at 1500 h. After 1500 h average shade use decreased along with the decreasing HLI. In 2013, the increase in beef cows’ use of shade increased along with increasing HLI as well, to reach about 45% at 1500 h.
Predicted use of shade by dairy and beef cows, according to the logistic mixed models as a function of the HLI. HLI=heat load index.

Mean percentage of shade use, that is, the mean of all observed cows (individual values=0 or 1), including all days, and the mean value for the HLI (averaged over all observation days) plotted against the time of day, per 15 min, for dairy cows in 2011 (a1) and 2013 (a2) and for beef cows in 2011 (b1) and 2013 (b2). HLI=heat load index.

RR and PS
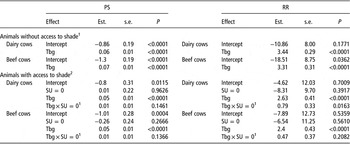
For NS animals, RR and PS increased with increasing Tbg, for both cattle types (both P<0.0001; Table 5). The RR of dairy cows and beef cows increased similarly with increasing Tbg (Table 5). With increasing Tbg, PS increased less steeply for dairy cows than for beef cows (Table 5). For S animals, RR and PS of both dairy and beef cows also increased with increasing Tbg (both P<0.0001; Table 5). The use of shade, however, did not influence the relation between Tbg and PS, for both cow types (Table 5). For beef cows, the use of shade did not significantly influence the relationship between Tbg and RR (Table 5). For dairy cows, the RR increased more steeply for animals outside shade than for animals in the shade (P=0.016, Table 5). At the highest observed values of Tbg (40°C), shade reduced the average RR by 23 BPM (from 123±5 to 100±5 BPM; P<0.0001) for dairy cows.
Estimations of the effect of the Tbg, shade use and their interaction on the PS and RR

Tbg=black globe temperature; PS=panting scores; RR=respiration rate; Est.=estimate of the effect; SU=0=effect of not using shade.
1 For these animals, PS and RR were modelled as a function of Tbg only.
2 For these animals, PS and RR were modelled as a function of Tbg and use of shade.
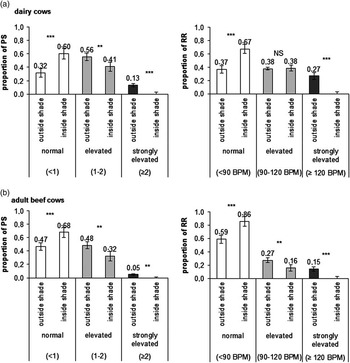
When all data (2011, 2012 and 2013, from NS and S) were pooled, we determined that for dairy and beef cows observations of BPM ⩾150 (Figure 4) and PS ⩾2.5 were only made for (NS and S) animals outside the shaded area, not for S animals under shade at the moment of RR and PS determination. In addition, at Tbg ⩾30°C, shade use significantly increased the prevalence of normal RR (<90 BPM) and PS (<1), so that both remained >50% for both cattle types (Figure 4). Use of shade reduced the prevalence of very high PS and RR (⩾120BPM) for beef cows as well as dairy cows, and for beef cows shade use also reduced the prevalence of high PS and RR (⩾90BPM) (Figure 4).
Prevalence (in %) of normal, elevated, and strongly elevated and very strongly elevated PS and BPM among cows outside shade and under shade, at Tbg >30°C. ***P<0.001, **P<0.01, *P<0.05, ~ P<0.01, NS=P>0.01 for the comparison of the prevalence under and outside of shade. PS=panting scores; RR=respiration rate; BPM=breaths per minute; Tbg=black globe temperatures.

Discussion
Effect of hot summer conditions on behavioural indicators of thermal discomfort
Cows increased their use of shade when the degree of heat increased. For both cow types, HLI predicted shade use best. This is in line with expectations because shade protects against heat stress mainly by reducing solar radiation and the HLI is greatly determined by the intensity of solar radiation. The traditional THI (Thom, Reference Thom1959), which is not (directly) affected by the solar radiation intensity, was not a good predictor of shade use. To our knowledge, no studies have yet related shade use probability to HLI, based on 15 min data. Therefore, our HLI threshold values for shade use can only be compared to HLI threshold values based on heat stress signs other than shade use, for example, to the threshold values in Table 1, based on PS and body temperatures of unshaded Angus steers. In 2011, the shade use probability reached ⩾10% at HLI values beyond the threshold of 77, which Gaughan et al. (Reference Gaughan, Mader, Holt and Lisle2008) used to define moderate heat stress conditions. In 2013, the shade use probability already reached ⩾10% during mild heat stress conditions according to Gaughan et al. (Reference Gaughan, Mader, Holt and Lisle2008). This apparently high threshold for use of shade in 2011 could be due to several factors. In 2011, no drinking trough was provided inside the shade area, whereas in 2013 there was. Second, in 2011 the cows were less habituated to the shaded area; the trees had been on their pastures for 2 years, but the shade cloth was hung only 1 month before the start of the study.
Furthermore, individuals using shade were physically separated from individuals that did not use shade (by an electric fence with a relatively narrow (3 to 5 m) opening as entrance and exit). The motivation for shade use might thus be opposed to the cattle’s strong gregarious tendency, which has already been shown to influence shade-seeking behaviour (Langbein and Nichelmann, Reference Langbein and Nichelmann1993). In the present study, we did observe that individual cows quickly followed each other into and out of the shade, presumably to maintain group cohesion. In practice, a non-fenced shade area that allows easy access to all individuals at the same time would be better and likely encourage cattle to seek shade more than was observed in our study in 2011. On the other hand, the experimental setup strengthens our hypothesis that the cows that did seek shade, probably did so primarily to seek shelter from the heat load imposed by intense solar radiation. In addition, thermal discomfort in unshaded cows was also evident from the increasing RR and PS.
Effect of shade on RR and PS
The increase in RR with increasing degree of heat was not as pronounced when dairy cows were in the shade. No such effect was found, however, for beef cows. Neither did shade use buffer the increase of PS with increasing degree of heat. Yet, when all data (2011, 2012 and 2013, NS and S treatments) were pooled, for both cow types, >50% of the cows under shade retained normal PS and RR, whereas normal RR and PS were significantly less prevalent for cows outside shade. In addition, for both cow types, the use of shade generally reduced the prevalence of elevated and strongly elevated RR and PS. Thus, we illustrated at least a modestly beneficial effect of shade use on behavioural indicators of thermal discomfort in both cow types under study, even during the temperate Belgian summers. This is in line with findings from New Zealand during summer (Schütz et al., Reference Schütz, Rogers, Poulouin, Cox and Tucker2010 and Reference Schütz, Cox and Tucker2014).
RR and PS as indicators of thermal discomfort
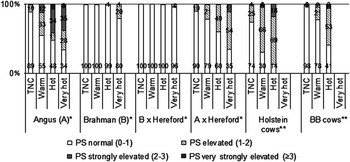
The PS is a proven convenient and suitable method to assess thermal discomfort in feedlot cattle (e.g. Brown-Brandl et al., Reference Brown-Brandl, Eigenberg and Nienaber2006; Gaughan et al., Reference Gaughan, Bonner, Loxton, Mader, Lisle and Lawrence2010a and Reference Gaughan, Mader, Holt, Sullivan and Hahn2010b). However, to our knowledge, it has not been used for this purpose in Belgian Blue cattle, and it has been used in only one other study on Holstein dairy cattle (Schütz et al., Reference Schütz, Cox and Tucker2014). RR is more commonly used as a measure of thermal discomfort in cattle, especially dairy cattle (e.g. Schütz et al., Reference Schütz, Rogers, Poulouin, Cox and Tucker2010). Classification of RRs into classes in accordance to PS classes suggested by Meat and Livestock Australia, were based on research on feedlot steers, mainly of the Angus breed (Gaughan et al. Reference Gaughan, Mader, Holt and Lisle2008 and Reference Gaughan, Bonner, Loxton, Mader, Lisle and Lawrence2010a). As pointed out in the introduction, however, the cows in our study may have had a different heat stress susceptibility, due to their different genetics and their different degree of adaptation. In order to assess if this was indeed the case, Figure 5 compares the prevalence of various PS categories in thermoneutral, warm, hot and very hot conditions for the unshaded Belgian Blue beef cows and the Holstein cows in our study with those of Angus steers and steers of other B. taurus breeds as reported by Gaughan et al. (Reference Gaughan, Mader, Holt, Sullivan and Hahn2010b) (Figure 5). It shows that the Belgian Blue beef cows’ and Holstein cows’ PS increased more strongly in hot conditions than those of the Angus×Charolais crossbreds or Hereford×Shorthorn crossbreds of Gaughan et al. (Reference Gaughan, Mader, Holt, Sullivan and Hahn2010b) (Figure 5). The heat-associated changes in PS of the Belgian Blue and the Holstein cattle were most comparable with that of the Hereford cattle and less marked than in the Angus cattle. Although the reduced pulmonary and cardiac function (Gustin et al., Reference Gustin, Bakima, Art, Lekeux, Lomba and van de Woestijne1988; Amory et al., Reference Amory, Rollin, Desmecht, Linden and Lekeux1992) might increase the heat stress susceptibility of the Belgian Blue breed, this breed does have a predominantly white- or light-coloured coat in comparison with the black-coated Angus. Gaughan et al. (Reference Gaughan, Mader, Holt and Lisle2008) determined that a white coat colour increases the heat stress threshold in terms of the HLI by three units, in comparison with the black-coated Angus reference. A red coat colour increases the heat stress threshold by one unit. Given that Hereford cattle have a mixed red and white coat, it is logical that the predominantly white Belgian Blue cattle as well as the mixed black and white Holstein cattle in our study and a similar heat stress tolerance as the Hereford cattle.
Percentage of unshaded animals of different cattle breeds exhibiting normal (0 to 1), elevated (1 to 2), strongly elevated (2 to 3) and very strongly elevated (⩾3) PS under TNC, warm, hot and very hot climatic conditions. PS=panting scores; TNC=thermoneutral; BB=Belgian Blue; Tbg=black globe temperature. *Data were derived from a study by Gaughan et al. (Reference Gaughan, Mader, Holt, Sullivan and Hahn2010b). In this study, heat load index thresholds of 70, 77, 86 and 96 were used to define warm, hot, very hot and extreme conditions, respectively. **Data from own research, Tbg thresholds of 25°C, 30°C, 40°C were used to define warm, hot and very hot conditions, respectively. However, very hot conditions and extreme conditions did not occur in this study.

Conclusion
This study suggests that Holstein dairy cows and Belgian Blue beef cows on pasture during Belgian (temperate) summers had to overcome a relatively high threshold before they started to use shade. However, once the threshold was overcome, the probability of shade use increased with increasing degree of heat, to reach an average of ±30% to 40% at the highest observed heat levels. In addition, thermal discomfort in unshaded cattle was evident from the increasing RR and PS with increasing degree of heat. We observed at least a modest beneficial effect of shade use on the RR and PS in both cow types. The increase in RR of Holstein dairy cows with increasing degree of heat was less pronounced when the cows were in the shade. In addition, under hot conditions, shade use led to normal RR and PS for the majority (>50%) of the cows, whereas the proportion of normal RR and PS was significantly lower for cows outside shade. Thus, shade as provided in the present study appears to alleviate thermal discomfort of Holstein dairy cows and Belgian Blue beef cows kept on pasture during temperate summers.
Acknowledgements
The authors thank the many people who helped to accomplish this study, including the animal caretakers and technicians (especially Seppe Holemans, Sara Van Lembergen, Piet Van Laere and Thijs Decroos) from ILVO Animal Sciences Unit and master students Evelien Van de Keere and Mathias Roegiers. This study was funded by the Federal Public Service of Health, Food Chain Safety and Environment (contract RT 10/13 Pastress). The experiment was approved by ILVO’s Ethical Committee (EC 2011/151 and EC 2011/151bis).
Supplementary material
To view supplementary material for this article, please visit http://dx.doi.org/10.1017/S1751731115000804