Serum concentrations of fructosamine (Fser), a stable glycated protein formed by the non-enzymic irreversible reaction between glucose and serum proteins, reflect the mean glucose concentration to which plasma proteins are exposed (reviewed by Armbruster, Reference Armbruster1987). Since the synthesis of Fser requires at least 20 d (Voziyan et al. Reference Voziyan, Khalifa, Thibaudeau, Yildiz, Jacob, Serianni and Hudson2003) its predictive capacity is retrospective and does not refer to the actual glucose concentration (Armbruster, Reference Armbruster1987). For the same reason, the Fser concentration is not affected by acute oscillations in plasma glucose and it displays no significant diurnal variations (Jensen et al. Reference Jensen, Petersen and Houe1993 in cows; Marca et al. Reference Marca, Loste and Ramos2000 in dogs). Owing to the average half-life of albumin in different species, the actual values of Fser reflect those of plasma glucose over the previous 1–3 weeks (Willms & Lehmann, Reference Willms and Lehmann1990; Kawamoto et al. Reference Kawamoto, Kaneko, Heusner, Feldman and Koizumi1992). In man, Fser has been widely used to monitor plasma glucose concentration in diabetic patients. In dogs and cats, many authors used the Fser test for the diagnosis and monitoring of diabetes mellitus (reviewed by Reusch et al. Reference Reusch, Liehs, Hoyer and Vochezer1993; Jensen, Reference Jensen1995).
The onset of lactation in high-yielding dairy cows is a period of a strong energy demand that can result in serious metabolic diseases such as ketosis. A persistent decrease in blood glucose during this period is an index of high risk of metabolic disorder consecutive to excessive energy requirements (reviewed by Chilliard, Reference Chilliard1987 and Jorritsma et al. Reference Jorritsma, Wensing, Kruip, Vos and Noordhuizen2003). Therefore, it should be useful to have a test for its early detection. The Fser test in cattle has been less reported and the results are less convincing. A positive significant correlation between glucose and Fser was found in growing calves (Coppo, Reference Coppo2001) and Jensen et al. (Reference Jensen, Petersen and Houe1993) reported the usefulness of Fser for the early diagnosis of bovine subclinical ketosis. Nevertheless, Ropstad (Reference Ropstad1991) found a positive but not significant correlation between Fser and blood glucose, and called for further studies to validate the clinical usefulness of this test as an indicator of metabolic status in transition dairy cows. Moreover, Ceballos et al. (Reference Ceballos, Gómez, Vélez, Villa and López2002a, Reference Ceballos, Villa, Andaur, Gómez, Vélez, Escobar, Osorio, Loaiza and Wittwer2002b) in transition dairy cattle and Jordán et al. (Reference Jordán, Villa, Gutiérrez, Gallego, Ochoa and Ceballos2006) in fighting cattle, did not find any correlation between blood glucose and Fser in the same week.
To our knowledge, a retrospective significant correlation between these two variables has not been reported. Moreover, except for the work of Ropstad (Reference Ropstad1987) in dairy cows at the 4th and the 8th week of lactation, the predictive value of Fser over blood glucose of previous weeks has not been studied. Thus, the aim of the present work was to evaluate the capacity of Fser to retrospectively monitor the evolution of blood glucose in dairy cows during the transition period.
Materials and Methods
Animals and their feeding
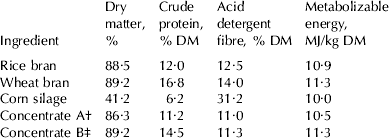
The work was carried out in a Uruguayan dairy farm, with a pasture-based milk production system, during mild winter. Seventeen high-yielding [25·8–30·9 kg energy corrected milk (ECM)/d at the peak of lactation] clinically healthy Holstein cows (500–600 kg before parturition) in their last month of gestation were selected. Average body-condition score pre-partum was 3·6±0·3 (scale 1–5) and they had 4·0±0·7 lactations. All calvings were normal. Cows were grass-fed (natural field improved with lotus, clover, long-spiked wild barley and oats). Twenty days before calving they additionally received daily, individually at 17·30, 6 kg of corn silage and 3 kg of wheat bran until the calving day. After calving, they received individually during each milking (6·00 and 18·00), 1·5 kg of concentrate A and 1 kg of rice bran, and after the evening milking, 4 kg of concentrate B and 2 kg of corn silage. The composition and chemical analysis of the feedstuffs are showed on Table 1.
Composition and chemical analysis of feedstuffs
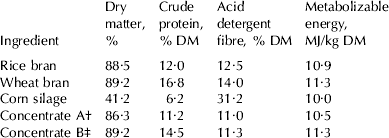
† Composition: corn grain 87·5%, NaCl 1·7%, dicalcium phosphate and trace mineralized salts (Sales Minerales Urusal, Antil S.A., Uruguay) 0·7%, vitamins A, D3, E (Sarbov M10 Plus, Grappiolo S.A., Uruguay) 0·1%
‡ Composition: dry malt bagasse 50%, corn grain 33%, corn germ 17%
Sample collection
Blood was collected from the coccygeal vein into vacuum tubes (Na fluoride for glucose and without anticoagulant for Fser, β-hydroxybutyrate (βOHB) and total proteins) at fixed weekly intervals, from 3 weeks pre-partum (dry period) to 5 weeks post partum (experimental weeks −3 to +5). Sampling was carried out during the morning milking (after milk extraction) and approximately at the same hour for each cow, as the milking routine was not modified to avoid stressing the animals. Blood was immediately cooled on ice, transported to the laboratory and centrifuged (1200 g for 10 min) and plasma and serum frozen and stored in Eppendorf tubes at −20°C until analysed. The time lag between sampling and freezing did not exceed 2 h. Samples were collected just after the distribution of the morning supplement, in order to avoid eventual oscillations of blood glucose associated with the digestive absorption of propionate or glucose itself. Therefore, the glucose values observed corresponded to basal conditions determined only by pasture feeding. Milk yield was individually recorded in both milkings, the same day of blood sampling.
Analytical procedures
Glucose was analysed by enzymic oxidation in the presence of glucose oxidase (GOD-PAP method) (Glucose liquicolor®, Human Gesellschaft für Biochemica und Diagnostica mbH, Wiesbaden, Germany), read at 500 nm in a digital colorimeter (Humalyser Junior, Human Gesellschaft für Biochemica und Diagnostica mbH, Wiesbaden, Germany). Fser was measured by the nitrotetrazolium blue reduction test (Fructosamina AA®, Wiener Lab., Rosario, Argentina) and read at 530 nm. β-OHB was quantified by its enzymic oxidation to acetoacetate (Ranbut®, Randox Lab., Crumlin, UK,) and read at 340 nm, and total proteins by the Biuret reaction (Protein (Total) Biuret®, Bio Systems, Barcelona, Spain) and read at 545 nm.
Statistics and correlation studies
The existence of a retrospective association between plasma glucose and Fser was investigated by regression analysis (Excel Microsoft®) with the glucose values as independent variable. Owing to the 15–17-d half-life of bovine albumin (Cornelius et al. Reference Cornelius, Baker, Kaneko and Douglas1962) the interval of retrospection to be investigated was fixed between 1 and 3 weeks preceding the measurement of Fser. Thus, the linear regressions were established between the plasma glucose concentration of each week and the Fser concentration of the one (G+1), two (G+2) and three (G+3) following weeks (a) for the ensemble of cows regardless of the specific experimental week (−3 to +5), (b) for each cow individually regardless of the specific experimental week and (c) for the weekly grouped data of weeks −3 to +3. The correlation between both variables in the same week was also studied for the ensemble of cows regardless of the specific experimental week. Pearson's correlation coefficient (r) was determined and its significance evaluated by Student's t test, assuming a normal distribution of blood values. The correlations between (a) plasma glucose and milk yield, (b) serum βOHB and plasma glucose and milk yield and (c) serum proteins and Fser, were also investigated by regression analysis. The significance of the weekly differences in plasma glucose, Fser and serum proteins concentrations, and between milk yield in weeks +1 and +5, were evaluated by Student's t test. Data are reported as means±sd. The minimal statistical significance was judged at P<0·05 and a tendency was noted between 0·05 and 0·1.
Results and Discussion
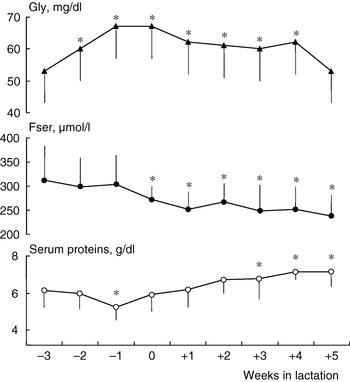
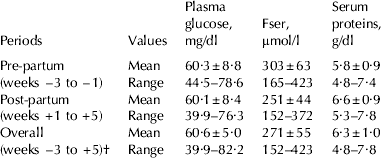
Plasma glucose, Fser and serum proteins concentrations during the experimental protocol are shown in Table 2 and Fig. 1. Considering the variation of Fser concentrations in cows reported in the literature, the present data were within the range of reported values. The mean overall values of Fser were barely greater than the upper limit of the 213–265 μmol/l reference interval proposed by Jensen et al. (Reference Jensen, Petersen and Houe1993) for dairy cows of different age and conditions. They were within the range of the mean values indicated by Coppo (Reference Coppo2001) for growing calves aged between 2 (297±35) and 4 months (226±33 μmol/l). However, the values observed by Ropstad (Reference Ropstad1987) for Norwegian Red Cattle dairy cows in early lactation are considerably smaller (141±20 μmol/l). At the same time, the present Fser values for pre-partum and post partum were less than those reported by Ceballos et al. (Reference Ceballos, Gómez, Vélez, Villa and López2002a) (346±220 and 428±239 μmol/l respectively). Ropstad (Reference Ropstad1987) finds that Fser values increase from 2 to 8 weeks after calving. However, the present results showed a progressive and significant decrease of Fser after parturition related to pre-partum values. This decrease cannot be attributed to reductions in serum proteins, as the latter increased after calving, or to the actual plasma glucose concentrations (in spite of their similar post-partum evolution) since no significant correlations were found between both variables in the same week.
Evolution of plasma glucose (Gly, mg/dl), serum fructosamine (Fser, μmol/l, and serum proteins, g/dl) concentrations from week 3 pre-partum to week 5 post partum (−3 to +5). Values are weekly means±sd, n=17, *P<0·01 related to week –3.

Mean±sd values and ranges of plasma glucose (mg/dl), serum fructosamine (Fser, μmol/l) and serum proteins (g/dl) concentrations for pre-partum (3 weeks), post-partum (5 weeks) and overall (9 weeks) experimental periods
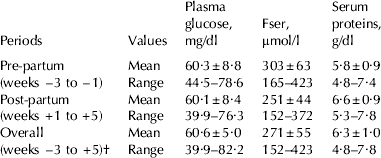
† Including the week of calving (week 0)
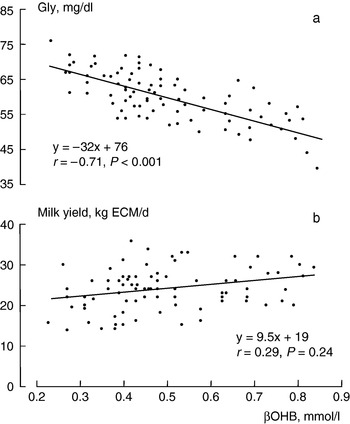
Plasma glucose values in pre- and post-calving periods were within the range reported in the literature. Its increase before calving could be attributed to the energy-rich supplement given to cows during the 20 d preceding partum, and the post-calving decline could be determined by the increasing milk production (from 20·9±5·7 in week +1 to 27·1±4·4 kg ECM/d in week +5; P<0·01). The latter possibility seemed confirmed by the inverse relationship found in early lactation between plasma glucose and milk yield (r=−0·47, P=0·03, data not shown) and serum βOHB concentrations (P<0·001, Fig. 2a), although the direct correlation observed between milk yield and βOHB was not statistically significant (Fig. 2b). βOHB is a reliable indicator of energy balance (Harrison et al. Reference Harrison, Ford, Young, Conley and Freeman1990) and consequently reflects the degree of lipomobilization when the availability of glucose declines during the transition period. Ceballos et al. (Reference Ceballos, Gómez, Vélez, Villa and López2002a) and Đoković et al. (Reference Đoković, Šamanc and Bošković-Bogosavljević2003) reported similar changes in pre- and post-calving plasma glucose.
Linear regression analysis between serum βOHB (mmol/l) and (a) plasma glucose (mg/dl); and (b) milk yield (kg of energy corrected milk (ECM)/d) in the post-partum period (weeks +1 to +5) (n=17 cows×5 weeks).

No significant correlation was found between plasma glucose and Fser values of the same week, neither for the overall (9 weeks, r=0·01) nor for the pre-partum (weeks −3 to −1, r=0·04) or the post-partum periods (weeks +1 to +5, r=0·11). The lack of correlation between these variables in the same week for overall, pre-partum and post-partum data, has also been reported by Ceballos et al. (Reference Ceballos, Gómez, Vélez, Villa and López2002a) in Colombian dairy cows, and Ceballos et al. (Reference Ceballos, Villa, Andaur, Gómez, Vélez, Escobar, Osorio, Loaiza and Wittwer2002b) in Holstein and Brahman dairy cows. Jordán et al. (Reference Jordán, Villa, Gutiérrez, Gallego, Ochoa and Ceballos2006), in grazing bullfighting cattle, did not report a correlation between both variables in the same sampling during the transition period (weeks –4 to +10 related to calving). Moreover Ropstad (Reference Ropstad1987) reports a rather low Spearman correlation coefficient (r s=0·29, P<0·1) between these variables in early lactating dairy cows. On the contrary Coppo (Reference Coppo2001), working with 120 half-bred Zebu young calves, finds significant correlations between glucose and Fser in groups with and without early weaning (r=0·74 and 0·72, respectively). Therefore, there seems to exist a direct relationship between the actual blood concentrations of glucose and fructosamine during the growing period but not in the transition dairy cow.
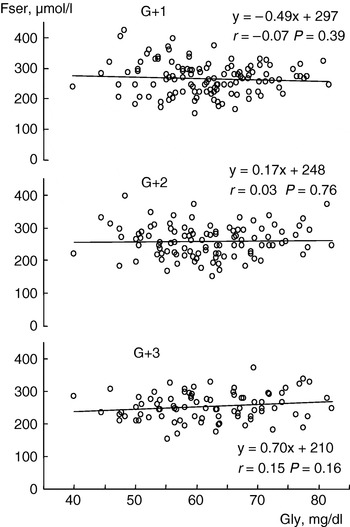
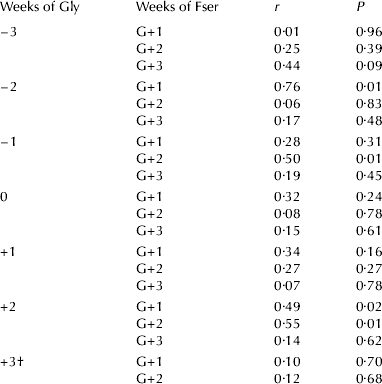
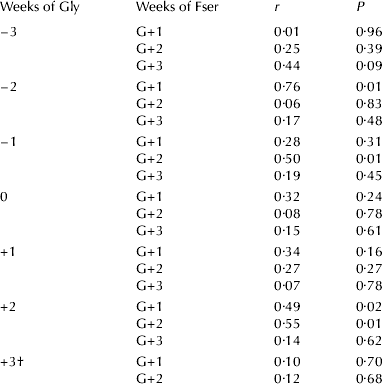
In the retrospective tests, the linear regression analysis between plasma glucose and Fser G+1, Fser G+2 and Fser G+3, for the ensemble of cows, did not disclose significant correlations (Fig. 3). Considering each cow individually, the same study indicated that only 7 of the 51 linear regressions (17 cows×3 retrospection periods) were statistically significant, but not coincident in the week of retrospection. In the regression analysis between the weekly (−3 to +3) values (17 cows) of the plasma glucose and the Fser for the three retrospective periods (Table 3) only 4 of the 20 regressions were statistically significant, but not for the same week or the same retrospective period. These results did not support the validation of the Fser test for the retrospective monitoring of plasma glucose concentration. This is also suggested by the work of Ropstad (Reference Ropstad1987) in dairy cows with two levels of protein and energy supply, where no significant correlations are reported between the Fser of the 4th and the 8th week of lactation and the preceding 2 weeks-mean and 3 weeks-mean plasma glucose concentration.
Linear regression analysis between the weekly individual values of plasma glucose concentration (Gly, mg/dl) and those of serum fructosamine (Fser, μmol/l) shifted 1 (G+1), 2 (G+2) and 3 (G+3) weeks, for the ensemble of cows (n=17) and regardless of the specific experimental week.

Coefficient of correlation (r) and statistic significance (P) for the linear regressions between the weekly grouped data (n=17 cows) of the plasma glucose (Gly) and those of the serum fructosamine (Fser) shifted one (G+1), two (G+2) and three (G+3) weeks, expressed from week 3 pre-partum to week 3 post partum (−3 to +3)
† There was no G+3 for this week
Considering the biochemical pathway leading from glucose to Fser (Armbruster, Reference Armbruster1987) it is difficult to propose a reasonable explanation to justify the lack of correlation between the studied variables. In the present study, the regularity of sampling (same hour for each cow), the lack of influence of the morning supplementation (closely prior to sampling) and the by itself naturally scarce and reduced daily fluctuations of blood glucose in ruminants (de Boer et al. Reference de Boer, Trenkle and Young1985; Ndibualonji et al. Reference Ndibualonji, Dehareng and Godeau1995) seem adequate arguments to consider the glucose values as independent of eventual daily oscillations interfering with the establishment of a positive correlation. It should be noted that the normal and subnormal glucose plasma concentrations, as was the case in the present study, are smaller in ruminants than in normal or diabetic human subjects and domestic carnivores, in which significant correlations between glucose and Fser are found. This difference could be decisive if it is assumed that this relationship manifests only beyond a plasma glucose threshold, reached in monogastric species, mainly with diabetic hyperglycaemia. Ropstad (Reference Ropstad1987) also evokes this argument to explain the lack of significant correlations between these variables in dairy cows.
On the other hand, it is known that Fser concentrations could be affected by the protein concentration in blood (reviewed by Jensen, Reference Jensen1993). In fact, in normoglycaemic dogs with chronic hypoproteinaemia, Coppo & Mussart de Coppo (Reference Coppo and Mussart de Coppo1997) find the concentrations of Fser below the reference interval for normoproteinaemic dogs. Nevertheless, Jensen (Reference Jensen1993) in dogs states that chronic hyper- or hypoproteinaemia should be very marked to significantly modify Fser values. In the present work, the lack of significant correlations cannot be attributed to a hypoproteinaemia, since (a) no correlation was found between serum proteins and Fser for the whole experimental period (r=−0·28, P=0·26) and (b) the majority of weekly means were within the 6·0–8 g/dl range established for cows in the Merck Veterinary Manual (Reference Aiello1998). Although the means for weeks −2 to 0 were slightly below this range, the data did not correspond to a chronic hypoproteinaemia. This decrease in blood proteins is described in the bovine during the last month of pregnancy by Larson & Kendall (Reference Larson and Kendall1957) and is attributed to the passage of immunoglobulins into the colostrum (Brandon et al. Reference Brandon, Watson and Lascelles1971).
In conclusion, the results failed to demonstrate the existence of a reliable and systematizing correlation, actual or retrospective, between plasma glucose and Fser. Therefore, in the present experimental conditions, the usefulness of the Fser for the monitoring of the hypoglycaemic risk in early lactation could not be proved. More studies are necessary to disclose the reasons for this lack of correlation between both blood variables.
The authors gratefully acknowledge Mr Pablo Leborgne, owner of the dairy farm, who made possible this research. The study was supported by Grant I+D 600/6009 from the Comisión Sectorial de Investigación Científica de la Universidad de la República, Uruguay.