Implications
The results of this study encourage accurate prediction of dry matter intake (DMI) in individual cows, based on a model that includes eating behavior parameters, together with measurement of energy-corrected milk (ECM) production. This can be further used to identify high efficient (HE) cows in commercial herd, a step necessary for potential genetic selection program aimed to improve herd efficiency. Identification of the low efficient (LE) cows in the herd can be used for their removal out of the herd or for their allocation into a different feeding group fed restricted diet that might reduce their voluntary intake and increase their efficiency with limited effect on milk production.
Introduction
During the recent decades, the dairy cow industry has improved in milk production due to genetic selection for higher milk yield, enriched milk components and improved feeding and milking management. In Israel, average annual milk production is 11,970 kg/cow (Israeli Dairy Board Association, 2017) but cows vastly divert in their efficiency. Feed efficiency, commonly measured as residual feed intake (RFI), showed heritability ranges from 0.20 to 0.36 (Connor et al., Reference Connor, Hutchison, Norman, Olson, Van Tassell, Leith and Baldwin2013; Manafiazar et al., Reference Manafiazar, Goonewardene, Miglior, Crews, Basarab, Okine and Wang2016). Breeding programs can be further developed by selecting for HE cows (Connor et al., Reference Connor, Hutchison, Norman, Olson, Van Tassell, Leith and Baldwin2013; Hayes et al., Reference Hayes, Lewin and Goddard2013). The main limit for developing such a breeding program is the lack of data about individual DMI. In modern, commercial dairy herds, milk production and milk composition are measured automatically and accurately for each individual cow (Weller and Ezra., Reference Weller and Ezra2016), but the individual measurement of DMI is still an obstacle, due to cost associated with individual DMI records. Recently, it was suggested that eating behavior characteristics, such as daily eating time and rate of eating, are related to DMI and feed efficiency (Connor et al., Reference Connor, Hutchison, Norman, Olson, Van Tassell, Leith and Baldwin2013; Halachmi et al., Reference Halachmi, Ben Meir, Miron and Maltz2016; Xi et al., Reference Xi, Wu, Zhao, Yang, Li, Han and Wang2016). However, in these studies, it was unclear whether daily eating time is longer in LE cows than in HE cows (Xi et al., Reference Xi, Wu, Zhao, Yang, Li, Han and Wang2016) or similar in both groups (Connor et al., Reference Connor, Hutchison, Norman, Olson, Van Tassell, Leith and Baldwin2013).
Successive selection in a commercial herd of HE or LE cows based on a short period (4 weeks) of DMI and efficiency measurements, at any time along the lactation period, is dependent on the repeatability of efficiency and eating behavior traits along lactation trimesters (Asher et al., Reference Asher, Shabtay, Haim, Aharoni, Miron, Adin, Tamir, Arieli, Halachmi, Moallem, Orlov and Brosh2014). Few studies have demonstrated changes in efficiency during the lactation period but found high repeatability of RFI along the entire lactation of multiparous (Asher et al., Reference Asher, Shabtay, Haim, Aharoni, Miron, Adin, Tamir, Arieli, Halachmi, Moallem, Orlov and Brosh2014; Lu et al., Reference Lu, Vandehaar, Spurlock, Weigel, Armentano, Staples, Connor, Wang, Coffey, Veerkamp, de Haas and Tempelman2017) and primiparous (Li et al., Reference Li, Berglund, Fikse, Lassen, Lidauer, Mäntysaari and Løvendahl2017) cows. However, there is absence of studies that compare the effects of lactation trimesters and parities on eating behavior, BW, DMI and yield of milk and ECM, and examine their effects on efficiency measured as RFI or ECM/DMI.
Therefore, the aims of this study were as follows:
1. To characterize and compare traits of the HE, LE and mid-efficient (ME) cows identified at each trimester of the lactation. Traits examined in each cow included: DMI, eating behavior, lying time, BW changes, milk and ECM production, milk composition, energy balance, RFI and ECM/DMI.
2. To measure the correlation and coefficient of repeatability (CR) between trimesters of: eating behavior, milk production, BW, and efficiency traits, using subgroup of 52 multiparous cows examined during their 1st and 2nd trimesters of lactation and additional subgroup of 42 multiparous cows examined during their 2nd and 3rd trimesters of lactation.
3. To measure the correlation and CR between parities of: eating behavior, milk production, BW, RFI and ECM/DMI traits in a subgroup of 26 cows measured during their 1st and 2nd parities.
Material and methods
Animals, feeding regime and experimental design
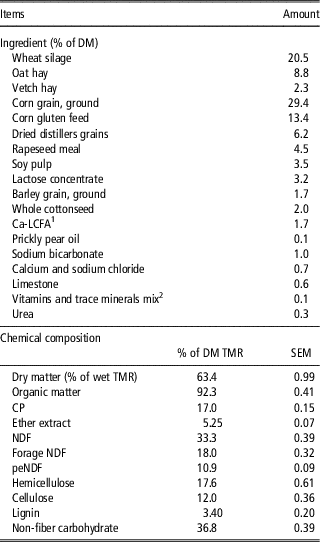
A total of 340 multiparous and 26 primiparous Israeli-Holstein dairy cows, including 95 multiparous cows at 1st trimester (30 to 90 days in milking (DIM)), 155 multiparous and 26 primiparous cows at 2nd trimester (90 to 180 DIM) and 90 multiparous cows at 3rd trimester (180 to 270 DIM) are presented in this study. Comparison between 1st and 2nd trimesters of lactation was examined in a subgroup of 52 multiparous cows. Comparison between 2nd and 3rd trimesters of lactation was examined in another subgroup of 42 multiparous cows. For comparison between parities, a subgroup of 26 primiparous cows was examined at their 1st and 2nd parities in their 2nd trimester of lactation. All cows were healthy, high yielding (>35 kg milk/day) and fed a low roughage total mixed ration (TMR, with 31.8% forage) that was preserved along the entire experimental period (nine cycles of 6 weeks each). Ingredients, chemical and structural composition of the TMR are in Table 1.
Ingredients and chemical composition of the total mixed ration (TMR) fed to lactating cows

1 Ca-LCFA=calcium salts of long-chain fatty acids; peNDF=physically effective NDF remaining above the 8 mm sieve.
2 Containing (g/kg of mix dry matter (DM)): Zn, 24; Fe, 24; Cu, 12.8; Mn, 24; I, 1.44; Co, 0.32; Se, 0.32; 16 M IU of vitamin A; 3.2 M IU of vitamin D3; and 48 K IU of vitamin E.
The feeding system includes 42 feeders, with an antenna at each feeder that recognize a sensor tied to each cow’s front leg. Thus, when a cow approaches its specific feeder, the system opens the feeder gate for that specific animal. Each individual feeder is located on top of weighing balances. This barn described in more details by Halachmi et al. (Reference Halachmi, Edan, Maltz, Peiper, Moallem and Brukental1998), records enter and exit time of each cow to feeder, while computerized monitoring on-line of feed weight consumed. In this system, where each cow had its individual feeder, hierarchy interruptions among cows were minimized, and the system enables detection of each valid visit (that includes eating) in the feeder. Data collected includes: visit and meal frequency, each visit and meal size and duration, distribution of diurnal eating over day and night, daily eating time and daily feed intake. A valid visit was defined in this study as staying in feeder for at least 5 min while eating at least 200 g DM. When the interval between the end of one visit and the beginning of the proceeding one was shorter than 29.5 min, these close visits were considered as part of a single meal (Supplementary Material S1 and Figure S1). This critical interval time is calculated based on the methods and equations described previously (Tolkamp et al., Reference Tolkamp, Allcroft, Austin, Nielsen and Kyriazakis1998; DeVries et al., Reference DeVries, von Keyserlingk, Weary and Beauchemin2003).
DMI was recorded manually every day by weighing feed delivery minus orts used as gold standard for DMI measurement based on summarizing of daily visit’s size monitored by the computer. This double check ensured appropriate daily measurement of DMI which is the key factor in the determination of efficiency. All cows were held in a common shaded well-aerated corral as a single group and had free access to water and individual feeder. Each cow was individually fed daily between 0900 to 1000 h the same TMR (Table 1) for 6 weeks. At evening or morning milkings additional quota of 10% TMR was added to empty feeders to ensure ad libitum intake (5% orts). Total mixed ration samples were taken daily from the individual feeders immediately after feeding and orts were collected from each feeder before next morning feeding. The daily TMR and orts samples were combined into a weekly pool per cow during 4 weeks of the experiment to determine DM content and TMR’s structural and chemical composition.
The experiment included nine cycles of 6 weeks each, 42 cows in each cycle. Each cycle consisted of: 2 weeks adaptation to the barn and feeding regime; additional 4 weeks dedicated to daily monitoring of: milk production and composition, DMI, free eating behavior (without tying or sampling the cows in the feeder), lying time, steps/day, and efficiency measured as RFI and ECM/DMI. This regime was based on a previous study (Asher et al., Reference Asher, Shabtay, Haim, Aharoni, Miron, Adin, Tamir, Arieli, Halachmi, Moallem, Orlov and Brosh2014) which demonstrated that the adequate time needed to determine reliable feed efficiency data is 4 weeks. In this study, RFI of each cow was measure as: RFI=measured DMI−predicted DMI (according to NRC (2001) equation). Predicted DMI=[(0.372×FCM)+ (0.0968×BW0.75)]×(1−e−0.192×(DIM/7+3.67)). fat-corrected milk (FCM 4%, kg)=0.4×milk yield (kg/day)+15×fat yield (kg/day).
At the end of the entire experiment, the 20% lowest RFI cows in each trimester of lactation were designated as HE, the 20% highest RFI cows were designated as LE and the rest 60% of cows were designated as ME group. The decision to select the upper and lower 20% as HE or LE cows was based on previous studies (Ben Shabat et al., Reference Ben Shabat, Sasson, Doron-Faigenboim, Durman, Jacoby, Miller, White, Shterzer and Mizrahi2016; Xi et al., Reference Xi, Wu, Zhao, Yang, Li, Han and Wang2016; Ben-Meir et al., Reference Ben Meir, Nikbachat, Fortnik, Jacoby, Levit, Adin, Cohen Zinder, Shabtay, Gershon, Zachut, Mabjeesh, Halachmi and Miron2018).
Milk performance, BW and lying time measurements
Cows were milked three times per day at 0500, 1300 and 2100 h. Milk yield (kg) and content of milk fat, protein and lactose were recorded daily for each cow, during 4 weeks of each cycle, by an automatic meter equipped with online near-IR spectroscopy measurement (Afilab; Afimilk Ltd, Kibbutz Afikim, Israel) as described and validated by Weller and Ezra (Reference Weller and Ezra2016). Yield of ECM, metabolic energy intake (MEI), energy used for maintenance (NEM), energy retained in BW gain (NEG) and energy retained in milk (NEL) were calculated according to NRC (2001) equations as described in our previous paper (Ben-Meir et al., Reference Ben Meir, Nikbachat, Fortnik, Jacoby, Levit, Adin, Cohen Zinder, Shabtay, Gershon, Zachut, Mabjeesh, Halachmi and Miron2018) and shown in details in the Supplementary Material S2. Heat production (HP) and energy loss in urine, breathing and sweating were measured as HP+E loss=MEI−NET. Daily BW was recorded by an automatic walk-over scale (Afimilk Ltd), three times per day, while cows were exiting the milking parlor. Changes in BW of each cow were calculated as the gap between average BW at week 2 to the average BW at week 6 of each experimental period. Outliers data (±3 SD) were deleted from the daily and weekly average calculation (Shaani et al., Reference Shaani, Eliyahu, Mizrahi, Yosef, Ben-Meir, Nikbachat, Solomon, Mabjeesh and Miron2016). Daily lying time of each cow, suggested by Drissler et al. (Reference Drissler, Gaworski, Tucker and Weary2005) as an indicator of animal welfare, was recorded daily by an automatic meter located within each cow’s pedometer tag (Afimilk LAS Ltd). This lying tag was validated by Swartz et al. (Reference Swartz, McGilliard and Petersson-Wolfe2016).
Chemical and structural analyses of diet
Dry matter content of TMR, and orts samples, were determined by drying in an air-forced oven for 48 h at 60°C. Chemical composition of TMR and orts was analyzed in dry and ground samples (ground through 1-mm sieve). Neutral-detergent fiber was analyzed with heat-stable amylase and without Na-sulfite. Neutral-detergent fiber, ADF and ADL were analyzed according to the sequential method of Van Soest et al. (Reference Van Soest, Robertson and Lewis1991) by ANKOM fiber analyzer (ANKOM220 Technology, Macedon, NY, USA). Cellulose was calculated as ADF−ADL, and hemicellulose was calculated as NDF−ADF. Crude protein was determined according to the Kjeldahl method (procedure 14 068 in Association of Official Analytical Chemists (AOAC), 1990). Ether extract (EE) was determined according to AOAC (1990) procedure 14·131. Organic matter (OM) content in TMR was determined after burning dry samples at 550oC for 5 h. Non-fiber carbohydrate (NFC) was determined as: NFC=OM−NDF−CP−EE.
Statistical analyses
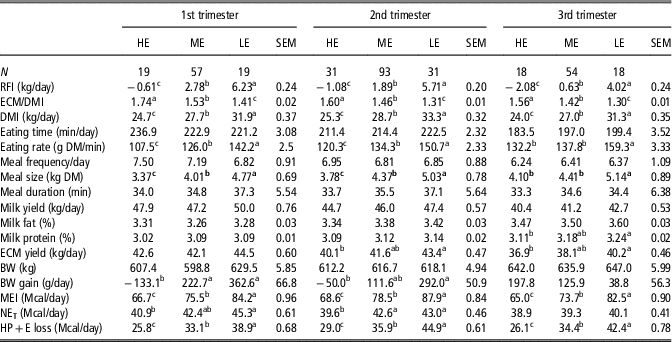
Within each trimester of lactation, comparison among the three efficiency groups (HE, LE and ME cows), with respect to the parameters: DIM, RFI, ECM/DMI, DMI, daily eating time, eating rate, meal frequency, meal length and size, daily lying time, milk yield, ECM yield, milk composition, were summarized by day for each cow. Data were analyzed using a LSM F-test in JMPpro-13.0 software (SAS Institute Inc., 2016), with day included as repeated measures, and cow as random effects. Energy balance data were summarized and analyzed by week. Tukey’s honestly significance difference tests were used for comparisons of means among efficiency groups, and between trimesters of lactation (Table 2).
Means and SEM for eating behavior, production and efficiency parameters, and energy balance among high efficient (HE), low efficient (LE) and mid-efficient (ME) multiparous cows within each trimester of lactation

DMI=dry matter intake; ECM=energy-corrected milk; RFI=residual feed intake; NET=sum of energy used for maintenance and retained in BW gain and milk; MEI=metabolic energy intake (Ben-Meir et al., 2018 and Supplementary Material Table S1); HP +E loss=heat production and energy loss in urine, breathing and sweating calculated as MEI-NET.
abc Within rows and trimester means marked by different superscripts differ at P<0.05.
Pearson’s correlation (r) and probability of correlation (P-values) between trimesters or parities (Tables 3 and 4) were estimated by bivariate regression (SAS Institute Inc., 2016) of the average of 4 weeks for each cow paired with the same cow in different trimester or parity. Coefficient of repeatability was calculated to be 2 SD of the gap between trimesters or parities for each cow (Bland and Altman., Reference Bland and Altman1986). Multivariate Pearson’s correlation of: DIM, DMI, ECM, RFI, ECM/DMI, eating time, eating rate, meal size and meal length was estimated by using pairwise multivariate in JMPpro-13.0 software (SAS Institute Inc., 2009). Traits without significant correlation to RFI and ECM/DMI (e.g. lying time and pedometer activity) were excluded from the model.
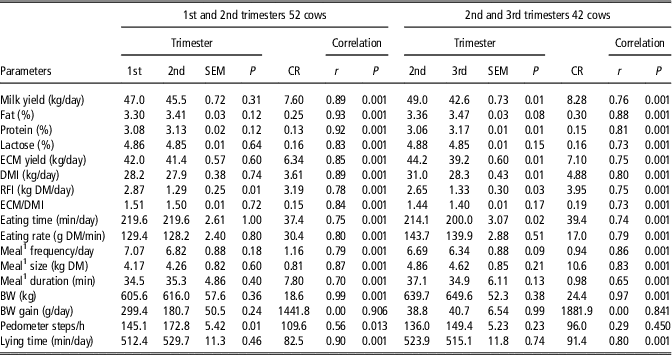
Means and SEM for production and behavior traits of the same cows within each trimester, and Pearson correlation and correlation repeatability for each traits between trimesters

CR=coefficient of repeatability; DMI=dry matter intake; ECM=energy-corrected milk; RFI=residual feed intake; r=Pearson’s correlation coefficient.
1 Meal defined as the sum of close visits initiated in less than 29.54-min interval after the end of previous visit (Supplementary Material Figure S1). Meal duration calculated as sum of visits+intervals between visits within average meal.
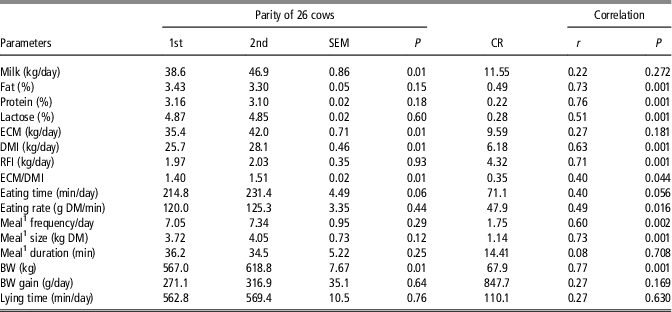
Means and SEM for production and behavior traits within each parity of the same cows, and Pearson correlation and correlation repeatability for each traits between parities

CR=coefficient of repeatability; DMI=dry matter intake; ECM=energy-corrected milk; RFI=residual feed intake; r=Pearson’s correlation coefficient.
1 Meal defined as the sum of close visits initiated in less than 29.54-min interval after the end of previous visit (Supplementary Material Figure S1). Meal duration calculated as sum of visits+intervals between visits within average meal.
Results
Differences in traits among efficiency groups within each trimester
Individual characteristics differing between HE, LE and ME cows, were measured during each of the lactation trimesters and data is shown in Table 2. Average DIM and parity of the three efficiency groups of multiparous cows, were similar within each trimester, therefore, not shown in Table 2. Main differences among the three efficiency groups within each lactation trimester, were exhibited in daily DMI, eating rate and meal size that were the highest in LE cows, moderate in ME cows and lowest in the HE cows. However, daily eating time, meal frequency and average meal duration were similar in the three efficiency groups within each trimester (Table 2). Within each trimester, the HE, LE and ME cows produced similar milk yield and milk fat content, and had similar BW. In the 2nd and in the 3rd trimesters, LE cows produced higher yield of ECM and higher BW gain than HE cows. Calculation of energy balance show higher NET (sum of NEM+NEG+NEL) in LE cows compared to HE cows in 1st and 2nd trimester. Details of energy balance are shown in Supplementary Material Table S1. Due to the differences in DMI, the MEI was highest in the LE cows moderate in the ME cows and lowest in HE cows within each of the three trimesters. The lower efficiency of the LE cows in each trimester was attribute to their larger HP and energy losses.
Correlation and repeatability of traits between trimesters and parities
Comparison among trimesters of milk and ECM production, DMI, eating behavior and efficiency traits, was measured in a group of 52 cows examined during their 1st and 2nd trimesters and in another group of 42 cows examined during their 2nd and 3rd trimesters, and the results are shown in Table 3. In the 52 cows measured during their 1st and 2nd trimesters, milk and ECM production, milk components, DMI, ECM/DMI and eating behavior traits were similar (P>0.05), and highly correlated between the two trimesters (r=0.84 to 0.89). Average RFI was significantly reduced between 1st to 2nd trimesters, however, its correlation coefficient between trimesters was high (r=0.78). Pedometer activity was higher in the 2nd trimester compared to the 1st one, due to increase in cow’s heating events. Lying time, indicating well-being of cows was high and similar along trimesters. In the 42 cows examined during their 2nd and 3rd trimesters, milk and ECM yield, DMI and eating time reduced in the 3rd trimester compared to the 2nd trimester. However, eating rate, meal frequency, meal size and ECM/DMI were slightly reduced but not significantly, in both trimesters. Pearson’s correlation between trimesters of all milk production, DMI and eating behavior traits were high (r=0.74 to 0.88). Efficiency in terms of RFI reduced (improved) between 2nd and 3rd trimesters although RFI between trimesters was highly correlated (r=0.75). Coefficients of repeatability that show the maximal gap of each parameter between the pair of trimesters (2 SD of gaps) are also given in Table 3.
The effect of parity (1st v. 2nd lactation) on milk production, DMI, eating behavior, and efficiency traits was examined in 26 cows, and data shown in Table 4. In the 2nd parity cows produced higher milk and ECM yield than in their 1st lactation, while consuming more DMI and increasing their BW and ECM/DMI traits. Eating behavior traits and RFI slightly differ but not significantly between parities. The changes in milk and ECM production and ECM/DMI were demonstrated in low Pearson’s correlation of these traits between parities (r=0.27 to 0.40), whereas the DMI and RFI parameters showed higher Pearson’s correlation between parities (r=0.71 and 0.63, respectively).
Multivariate correlation between parameters
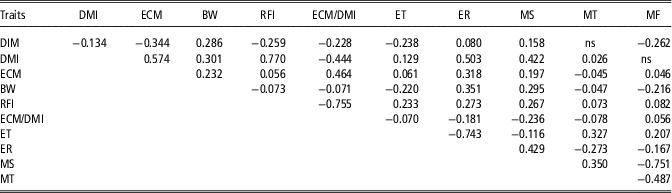
Multivariate Pearson’s correlation of the traits: DIM, DMI, ECM, RFI, ECM/DMI, eating time, eating rate, meal size and meal length, are shown in Table 5. Trimester effect, measured as DIM, had a significant negative low correlation coefficient (r<−0.34) with ECM, DMI, eating time, meal frequency RFI and ECM/DMI. However, DIM effect on BW and meal size had positive although low correlation coefficient. Residual feed intake was highly correlated to DMI (r=0.77), moderately correlated to eating time, eating rate and meal size (r=0.23 to 0.27) but had low correlation coefficient (r<0.1) to ECM, BW, meal time and meal frequency. Energy-corrected milk (ECM)/DMI parameter had high negative correlation with RFI (r=−0.76), moderate positive correlation with ECM (r=0.46) and moderate negative correlation with DMI, eating rate and meal size (r=−0.44 to −0.18). The eating behavior traits that were moderately correlated with DMI were: eating rate, meal size and eating time (r=0.50, 0.42 and 0.13, respectively). Energy-corrected milk and BW were also moderately correlated with DMI (r=0.57 and 0.30, respectively).
Multivariate Pearson’s correlations (r values) among the parameters: days in milking (DIM), dry matter intake (DMI), energy-corrected milk (ECM), BW, residual feed intake (RFI), ECM/DMI, eating time (ET), eating rate (ER), meal size (MS), meal time (MT) and meal frequency (MF) measured in lactating cows

ns=non significance, P>0.05.
All correlations in this table are significant at P<0.05. Correlation based on total of 12 883 days of lactation in 340 multiparous and 26 primiparous cows.
Discussion
Effect of eating behavior on dry matter intake and efficiency
The higher DMI (by 29%, 31.6% and 30.4% in 1st, 2nd and 3rd trimesters, respectively) of the LE compared with HE cows (Table 2) is in accordance with our previous studies (Asher et al., Reference Asher, Shabtay, Haim, Aharoni, Miron, Adin, Tamir, Arieli, Halachmi, Moallem, Orlov and Brosh2014; Halachmi et al., Reference Halachmi, Ben Meir, Miron and Maltz2016; Ben-Meir et al., Reference Ben Meir, Nikbachat, Fortnik, Jacoby, Levit, Adin, Cohen Zinder, Shabtay, Gershon, Zachut, Mabjeesh, Halachmi and Miron2018). Connor et al. (Reference Connor, Hutchison, Norman, Olson, Van Tassell, Leith and Baldwin2013) also found that LE cows consume 25% more DMI than HE cows without significant difference in milk yield and BW. Potts et al. (Reference Potts, Boerman, Lock, Allen and VandeHaar2015) compared HE to LE lactating cows and found that DMI was correlated with RFI (Pearson’s r=0.56), while correlations of RFI with milk yield remained non-significant. The high correlation coefficient between DMI and RFI (r=0.77, Table 5) is in accord with these findings and the previous studies. In each trimester, the higher DMI of the LE cows was associated with higher eating rate and larger meal size (Table 2) and this is supported by the Pearson’s correlation between these parameters and DMI (r=0.42 to 0.50). However, meal frequency and duration, and daily eating time were similar in the three efficiency groups within each trimester (Table 2) in accord with the low correlation of these parameters with respect to DMI (Table 5).
In the present study within each trimester, each cow chose to eat voluntarily during 6.2 to 7.5 meals/day (Table 2). These meals were motivated by external events including feeding or returning from each milking (Supplementary material Figure S2). Average cow meal lasted between 33 and 37 min. Similar average number of 5.8 to 6.7 meals/day was reported in the study of Tolkamp et al. (Reference Tolkamp, Schweitzer and Kyriazakis2000), who demonstrated that for variety of diets, each of the meals is composed of several visits with short intervals between them. It is suggested that in this study LE cows that ate faster than HE cows can consume within a meal of constant length (33 to 37 min) 25% to 42% more low-roughage TMR. The termination of each meal after 33 to 37 min. is associated with the physiological response to absorbed fuels (mainly propionate concentration in the liver vein) that activate the hepatic nerve to send satiety feeling to the brain which react by sending a termination signal of the meal, as described by Allen and Bradford (Reference Allen and Bradford2006) and Kokkinos et al. (Reference Kokkinos, le Roux, Alexiadou, Tentolouris, Vincent, Kyriaki, Perrea, Ghatei, Bloom and Katsilambros2010). Therefore, the higher eating rate of the LE cows in each trimester is probably a main reason to their larger meal size and accumulated larger daily DMI compared to the HE cows. Support to this assumption is given from previous studies in human and rats that demonstrated differences in daily food intake and body fat content between fast eaters to slow eaters (Kokkinos et al, Reference Kokkinos, le Roux, Alexiadou, Tentolouris, Vincent, Kyriaki, Perrea, Ghatei, Bloom and Katsilambros2010; Ohkuma et al, Reference Ohkuma, Hirakawa, Nakamura, Kiyohara, Kitazono and Ninomiya2015).
Effect of lactation trimester on eating behavior, production and efficiency
Comparison of efficiency traits among the three trimesters (Table 2) show the highest RFI and ECM/DMI values of all cows at 1st trimester, the lowest at 3rd trimester while cows of the 2nd trimester were intermediate. This trend is supported by the significant negative Pearson’s correlation between DIM and the efficiency shown as RFI or ECM/DMI (r=−0.26 and −0.23, respectively, Table 5).
Comparison between the 1st and 2nd trimesters in the same 52 cows show (Table 3) that milk and ECM production, ECM/DMI, DMI, RFI and eating behavior traits had high Pearson’s correlation (r=0.78 to 0.89) between trimesters. Similar trend was found in the comparison of another 42 cows during their 2nd and 3rd trimesters that show high Pearson’s correlation (r=0.73 to 0.76) between trimesters for milk and ECM production, DMI, eating behavior traits, RFI and ECM/DMI. These findings are in accord with previous studies with lactating cows that showed high Pearson’s correlation (r=0.75 to 0.78) of RFI along the entire lactation period (Azizi et al., Reference Azizi, Kaufmann and Hasselmann2009; Asher et al., Reference Asher, Shabtay, Haim, Aharoni, Miron, Adin, Tamir, Arieli, Halachmi, Moallem, Orlov and Brosh2014).
Utilization of the excess energy ingested by low efficient cows
Slight differences between LE and HE cows were shown in total retained energy (NET), but the main differences among efficiency groups were demonstrated in MEI and daily HP+energy loss that were highest in the LE cows, moderate in the ME cows and lowest in the HE cows (Table 2). Thus, the higher efficiency of the HE cows attribute mostly to their lower MEI as well as lower excess HP and energy loss. This suggest that HE cows are characterized by unique mode of energy utilization mechanism, resulting in more efficient ECM production, less energy loss as excess HP and better control on the consumption of MEI via their slower eating rate and sensitive appetite receptors.
Effect of parity on eating behavior, production and efficiency
Data in Table 4 show that transition of 26 cows from 1st to 2nd lactations, increased DMI, BW, milk and ECM yield as well as ECM/DMI, slightly affected eating behavior traits, and had little effect on RFI that was preserved at high correlation coefficient (r=0.71). These findings are in accordance with previous studies (Azizi et al., Reference Azizi, Kaufmann and Hasselmann2009; Connor et al., Reference Connor, Hutchison, Norman, Olson, Van Tassell, Leith and Baldwin2013) that showed a similar trend. It is therefore suggested that examination of RFI in primiparous cows might enable prediction at high probability of their future efficiency in the following lactations.
The positive Pearson’s correlation of DMI with the parameters ECM, BW, eating rate, meal size and eating time (Table 5) suggest that these traits can be included in a multivariable model that can be used for better prediction of DMI compared to the prediction model of NRC (2001). Such a model was recently demonstrated in our previous study (Halachmi et al., Reference Halachmi, Ben Meir, Miron and Maltz2016).
Conclusions
Within each trimester, efficiency measured as RFI or ECM/DMI of cows fed a single TMR is dependent on individual eating behavior traits especially eating rate and meal size that together with eating time determine DMI. The differences in levels of ECM production and BW changes between 2nd and 3rd trimesters of lactation are significant, and therefore DIM should be also considered in any prediction model of DMI and efficiency. Eating rate, meal size, DMI, and RFI traits are highly correlated along the lactation trimesters of high producing dairy cows, and RFI is highly correlated between 1st and 2nd parities.
These findings encourage accurate prediction of DMI based on a model that includes eating behavior parameters, together with direct individual measurement of ECM production. This can be further used to identify HE cows in commercial herd, a step necessary for potential genetic selection program aimed to improve herd efficiency. Identification of LE cows in the herd can be used for their removal out of the herd. In addition, the LE cows can be allocated to a different feeding group fed restricted TMR that might reduce their voluntary DMI and MEI with limited effect on ECM production.
Acknowledgements
The authors express their appreciation to Yavne Feeding Center, Israel, for the TMR production, and to the team of ARO research dairy farm for their great efforts. This study was supported by grants of the Israeli Dairy Board Foundation, project 362-0442 and the Israeli Chief Scientist of Agriculture, projects 362-0469, 459-4514 and 459-4490.
Declaration of interest
Authors and co-authors of this study declare that they have not any conflicts of interest in the publication of this study.
Ethics statement
The experiment was approved by the institutional ethical committee, according to regulations regarding protection of animal used for scientific purposes. Directive 2010/63/EU and the Israeli law.
Software and data repository resources
None of the data were deposited in an official repository.
Supplementary material
To view supplementary material for this article, please visit https://doi.org/10.1017/S1751731118003452