


Introduction
Variation in distribution and abundance is a central theme of ecology and basic to both descriptive and experimental approaches to environmental science. The deep sea supports a highly diverse benthic invertebrate fauna (e.g. Rex et al. Reference Rex, Stuart and Coyne2000), with high spatial and temporal variability. Patterns of distribution of organisms, i.e. meiofauna and macrofauna, and assemblages structure vary at scales from centimetres to kilometres, respectively (e.g. Etter & Grassle Reference Etter and Grassle1992, Rex et al. Reference Rex, Stuart and Coyne2000, Ellingsen & Gray Reference Ellingsen and Gray2002). Numerous intrinsic ecological issues require a detailed quantitative understanding of the scales at which there are predictable patterns in the abundance of organisms and the natural scales of variability in these patterns (Underwood et al. Reference Underwood, Chapman and Connell2000). Understanding the processes that regulate structure and dynamics of interactions between species requires recognition of the scales at which they operate and, therefore, quantitative description of spatial and/or temporal variation in abundances and diversity (Underwood et al. Reference Underwood, Chapman and Connell2000).
Most marine studies of species richness and diversity have been done at small scales, that of alpha diversity. Studies at different spatial scales are, however, needed because there are strong relationships between sampling scale and the processes that influence diversity (Huston Reference Huston1994). Ecological processes operate at a small scale, i.e. within habitat, whereas evolutionary forces are presumed to operate at larger scales, i.e. regional scale (Gray Reference Gray1997). Whittaker (Reference Whittaker1960) suggested that there was a range in scales of species richness and diversity and he partitioned species diversity into alpha (or within habitat), beta (or between habitat) and gamma (larger scale) diversity. Compared with the knowledge of alpha diversity, beta and gamma diversity have been far less studied in marine systems (Ellingsen & Gray Reference Ellingsen and Gray2002). In the deep sea a shift in the emphasis in biodiversity research to studies at both local and larger scales has become important in order to understand patterns of biodiversity at larger scales (Stuart et al. Reference Stuart, Rex and Etter2003, Gage Reference Gage2004, Ellingsen et al. Reference Ellingsen, Brandt, Ebbe and Linse2007).
Although the traditional measure of biodiversity in ecology and conservation has been the number of species, the biodiversity of an area is much more than the ‘species richness’ and some of the various species present in a community are abundant and others are very rare (Harper & Hawksworth Reference Harper and Hawksworth1994). Rare species can be regarded as those having low abundance or small range size (Brown Reference Brown1984). In most ecological datasets, many deep-sea species seem to be rare (e.g. Grassle & Maciolek Reference Grassle and Maciolek1992). Quantification of rare species is important for communities, macroecology and conservation (e.g. Colwell & Coddington Reference Colwell and Coddington1994). In marine systems it has been used as an important approach in assemblages and spatial patterns (e.g. Ellingsen Reference Ellingsen2001, Shin & Ellingsen Reference Shin and Ellingsen2004). However, the proportion of rare species in a given area may vary as a function of sampling intensity, using of differential sampling techniques, spatial scale and geographical location (see Shin & Ellingsen Reference Shin and Ellingsen2004).
One of the major challenges for diversity studies in Antarctica is the assessment of possible geographic variation, i.e. latitudinal and longitudinal, and depth-related gradients of biodiversity such as those known to occur in the Northern Hemisphere (e.g. Rex et al. Reference Rex, Etter and Stuart1997, Stuart et al. Reference Stuart, Rex and Etter2003). Although several works have shown no relationship between geographic variation and/or depth and diversity in the Southern Ocean (Brandt & Hilbig Reference Brandt and Hilbig2004, Linse Reference Linse2004, Brandt et al. Reference Brandt, Ellingsen, Brix, Brökeland and Malyutina2005, Clarke et al. Reference Clarke, Griffiths, Linse, Barnes and Crame2007, Ellingsen et al. Reference Ellingsen, Brandt, Ebbe and Linse2007), this relationship has not been reported for the western Antarctica (but see Clarke et al. Reference Clarke, Griffiths, Linse, Barnes and Crame2007). This is a not easy task for several reasons. Firstly, there are major gaps in sampling coverage of inaccessible areas, which are more or less permanently covered by ice. Secondly, assemblages are very patchy, varying at different spatial scales (Gutt & Piepenburg Reference Gutt and Piepenburg2003).
The aim of this paper was to analyse patterns of alpha, beta and gamma diversity in benthic molluscs, i.e. gastropods and bivalves, from West Antarctica. In addition, we wanted to determine if variation of beta diversity, i.e. diversity between habitats, was correlated more with depth differences than with horizontal distance.
Materials and methods
Study area and sampling
The study area covers an extensive region c. 2200 km long and 500 km wide from the South Shetland Islands to the Bellingshausen Sea and Eights Coast on the border of Amundsen Sea (Fig. 1). The South Shetland Islands are located on the continental shelf at the northern limit of the Antarctic Peninsula and are separated from the Peninsula by the Bransfield Strait. The Bransfield Strait extends from near Clarence Island toward the south-west for c. 460 km to Low Island. The Strait is occupied by the Bransfield Trough, whose axial depth varies between 1100 m at the south-west margin and 2800 m just south of Elephant Island (Gordon & Nowlin Reference Gordon and Nowlin1978). The Bellingshausen Sea covers an extensive area of the continental slope and the deep sea plain along the west side of the Antarctic Peninsula between Alexander Island and Thurston Island. From a biogeographic point of view, the study area includes the sub-provinces of western Antarctic Peninsula and Eights Coast (Clarke et al. Reference Clarke, Griffiths, Linse, Barnes and Crame2007), but the former has been previously divided into finer-scale areas of the South Shetland Islands, the main western Antarctic Peninsula, the Bellingshausen Sea and Peter I Island (Linse et al. Reference Linse, Griffiths, Barnes and Clarke2006).
Geographic position of the 54 sampling sites in the five large areas of West Antarctica from the South Shetland Islands to the Bellingshausen Sea and Eights Coast.

Samples were collected at 54 sites at depths ranging from 45 to 3304 m during the BENTART 95, 03 and 06 cruises aboard RV Hespérides (Fig. 1, Table I). During the BENTART 95 cruise, from 16 January–4 February 1995, comprehensive sampling was carried out, extending the search and analysis of benthic assemblages to the South Shetland Islands/Bransfield Strait area. During the BENTART 03 (24 January–March 2003) and BENTART 06 (2 January–16 February 2006) cruises, intensive sampling was conducted from the western Antarctic Peninsula to the Bellingshausen Sea. A complete list with information of sampling sites can be found in Arnaud et al. (Reference Arnaud, Troncoso and Ramos2001) and Troncoso & Aldea (Reference Troncoso and Aldea2008). Samples were collected using different sampling gears (i.e. box-corer, Agassiz trawl, epibenthic sledge, rock dredge and Nassa trap) at each site (see Aldea et al. Reference Aldea, Olabarria and Troncoso2008). Samples were sorted on deck, fixed in borax-buffered 4% formaldehyde in seawater and after one day transferred and preserved in 70% alcohol. Most specimens of gastropods and bivalves were identified to species level and only a few specimens were identified to genus or family level.
Location and main characteristics of the areas along the study area from the South Shetland Islands to the Bellingshausen Sea and Thurston Island on the border of Amundsen Sea. Samples taken in the depth ranges 0–1000 m (shelf), 1000–3000 m (slope) and >3000 m (deep sea) are indicated. Areas: 1 = South Shetland Islands, 2 = western Antarctic Peninsula, 3 = Bellingshausen Sea, 4 = Peter I Island, and 5 = Eights Coast.

Data analyses
We prepared a complete matrix of species number and specimens per site. Alpha diversity was measured as sample species richness (SRS) (Gray Reference Gray2000), taxonomic diversity, taxonomic distinctness (Warwick & Clarke Reference Warwick and Clarke1995) and the number of genera and families. We defined species restricted to a single site as ‘uniques’; species occurring at only two sites as ‘duplicates’; species represented by a single individual as ‘singletons’; and species represented by only two individuals as ‘doubletons’ (see Colwell & Coddington Reference Colwell and Coddington1994). The Sobs, representing the number of species observed in all pooled samples, the non-parametric Chao2, Jacknife1 and Jacknife2 methods (Colwell & Coddington Reference Colwell and Coddington1994) were used to estimate the theoretical number of expected species within each area, using the EstimateS software (Colwell Reference Colwell1997). The ‘range size’ was calculated and expressed as the number of sites at which a species occurred within the study area.
Beta diversity was calculated following Whittaker (Reference Whittaker1960) as the proportion by which a given area is richer in species than the average richness of samples within it,  , where γ is the total number of species recorded for the area or gamma diversity and
 is the average number of species per individual site or the average alpha diversity in the given area. The Bray-Curtis similarity coefficient (Clarke & Warwick Reference Clarke and Warwick1994) was applied to the square root transformed data and to the presence/absence data to obtain similarity matrices using the PRIMER package (Clarke & Gorley Reference Clarke and Gorley2005). The similarity between all pairwise permutations of sites was also used as measure of beta diversity (see Ellingsen & Gray Reference Ellingsen and Gray2002).
Gamma diversity was measured as species richness in five large areas (SRL) previously defined statistically by Linse et al. (Reference Linse, Griffiths, Barnes and Clarke2006) and Clarke et al. (Reference Clarke, Griffiths, Linse, Barnes and Crame2007). These five areas together constituted the largest scale studied (SRT). To investigate the problem of variability in sampling effort in more detail, gamma diversity for each area was plotted as a function of the number of samples following Clarke & Lidgard (Reference Clarke and Lidgard2000).
The Kruskal-Wallis test was used to determine whether there were significant differences of alpha diversity measures among the five large zones in the study area.
Geographic distance (km) and depth distance (m) were computed between all pairwise combinations of sites. A Partial Mantel test (Anderson & Legendre Reference Anderson and Legendre1999) was used to test the hypothesis that diversity clines correlate more with depth differences than with horizontal separation. The Partial Mantel test is a test for three matrices which estimate the correlation between matrices A (Bray-Curtis similarity matrix) and B (depth distance), while controlling the effect of a third matrix C (geographic distance) in order to remove spurious correlations (Anderson & Legendre Reference Anderson and Legendre1999). The significance of the partial correlation coefficient was tested by permutations of the residuals (10 000 randomizations) of a null model, in which the independent variable of interest (i.e. depth differences or horizontal distance) was held constant. The statistical software package Zt, developed by Bonnet & Van de Peer (Reference Bonnet and Van de Peer2002) was used for the analysis. In addition, the relationships between faunal patterns, using the Bray-Curtis similarity matrix, and latitude, longitude and depth (matrices computed using normalized Euclidean distance), were examined using the BIO-ENV procedure (Clarke & Ainsworth Reference Clarke and Ainsworth1993).
Results
Diversity
Alpha diversity (sample species richness, SRS) at 54 sites was highly variable, ranging from 0–23 mollusc species (Fig. 2). Mean alpha diversity  over the five large areas studied was the highest at Peter I Island, where the range was 6–23 species per site (Table II), followed by the western Antarctic Peninsula, whereas the lowest value was found at the Eights Coast (Fig. 2). There was no clear evidence of a relationship between
 and latitude (Table II). The western Antarctic Peninsula accounted for the highest values of taxonomic diversity (Δ) and taxonomic distinctness (Δ*) (Table II), whereas the lowest values of taxonomic diversity and taxonomic distinctness were found in the Bellingshausen Sea. Whittaker’s beta diversity (βW) varied between 1.4 at Peter I Island, and 7.2 in the Bellingshausen Sea (Table II). The mean value of Bray-Curtis similarity was 9.34, with the highest values ranging from 70% to 63% only between sites of the South Shetland Islands. The lowest values of similarity (4%) were between sites at Peter I Island, and one site located at Peter I Island and another one in the Bellingshausen Sea.
Sample species richness (SRS, alpha diversity). Samples were ordered from north (62°S) to south (71°S). Solid circles = South Shetlands Islands, open circles = western Antarctic Peninsula, solid squares = Bellingshausen Sea, open squares = Peter I Island, solid triangles = Eights Coast.

Diversity measured as SRL, species richness in large areas (gamma diversity), SRT = gamma diversity in total area, SRS = sample species richness (alpha diversity),  = mean alpha diversity,
 = mean number of families,
 = mean number of genera, Δ* = mean taxonomic distinctness, Δ = mean taxonomic diversity, βW = Whittaker’s beta diversity; and the proportion of ‘rare’ species, uniques, duplicates, singletons and doubletons. CI 95% confidence intervals.

The total number of species (gamma diversity) observed in the 54 sites was 134 (SRT, Table II). Gamma diversity in large areas (SRL) was highly variable, ranging from 18 species at the Eights Coast to 56 in the Bellingshausen Sea (Tables II & III).
None of the species richness estimators stabilized towards asymptotic values in any area (Fig. 3). The highest value (mean ± SD) of the Chao2 estimator (84 ± 33) was found in western Antarctic Peninsula (Fig. 3b), whereas the highest values (mean ± SD) of Sobs, Jacknife1 and Jacknife2 estimators were found in the Bellingshausen Sea (37 ± 15, 56 ± 23 and 67 ± 28, respectively; Fig. 3c). The lowest values of all indicators, Sobs, Chao2, Jacknife1 and Jacknife2, were observed at Eights Coast, with values of 11 ± 6, 30 ± 28, 18 ± 11 and 22 ± 15, respectively (Fig. 3e).
Estimator of species richness for a. South Shetlands Islands, b. western Antarctic Peninsula, c. Bellingshausen Sea, d. Peter I Island, and e. Eights Coast. Sobs = solid rhombus, Chao2 = solid triangles, Jacknife1 = solid circles, and Jacknife2 = open circles. SD bars are indicated for Sobs and Chao2.

There was no significant relationship between gamma diversity in large areas (SRL) and mean alpha diversity ( ) (r 2 = 0.073, p = 0.66), although the southernmost area (Eights Coast) showed the lowest values for both diversity indices (Fig. 4a). Similarly, the relationship between gamma diversity and Whittaker’s beta diversity ((SRL/
 )-1) was not significant (r 2 = 0.316, P = 0.32) and the lowest value of gamma diversity did not match the lowest value of beta diversity (Fig. 4b).
Relations between gamma diversity (SRL, species richness at large areas) and a. mean alpha diversity ( ), and b. Whittaker’s beta diversity (βW=(SRL/
 ))-1). Bars indicate ± 95% confidence intervals. Solid circle = South Shetlands Islands, open circle = western Antarctic Peninsula, solid square = Bellingshausen Sea, open square = Peter I Island, solid triangle = Eights Coast.

The scatterplot showing the relationship between number of samples per area and gamma diversity indicated clearly that calculated values of gamma diversity were not primarily a function of sampling intensity (r 2 = 0.613, P = 0.12, Fig. 5a). The residuals of the logarithmic transformation of both variables were negative, except for the western Antarctic Peninsula (Fig. 5b).
a. Gamma diversity pooled by the five studied areas, as a function of the number of samples in each area. b. Residuals around a fitted least squares regression of gamma diversity and sampling effort, both variables logarithmically transformed, plotted as a function of area. Solid circle = South Shetlands Islands, open circle = western Antarctic Peninsula, solid square = Bellingshausen Sea, open square = Peter I Island, solid triangle = Eights Coast.

Distribution and spatial patterns
No species were present at all sampling sites (Fig. 6), although two species, Neobuccinum eatoni and Cuspidaria infelix, occurred in the all five areas, and five species, Chlanidota signeyana, Adacnarca nitens, Thyasira debilis, Cyclocardia astartoides and Cyamiocardium denticulatum, occurred in four areas (Table III). The most widespread species was the tiny bivalve Thyasira debilis (20 sites), followed by the bivalves Thyasira cf. dearborni (18 sites), Yoldia eightsi (15 sites), Nuculana inaequisculpta (14 sites), Cyclocardia astartoides, Cyamiocardium denticulatum (13 sites), and Cuspidaria infelix, and the gastropods Neobuccinum eatoni (12 sites), Chlanidota signeyana and Harpovoluta charcoti (11 sites). The most abundant species were the bivalves Cyamiocardium denticulatum (654 individuals), Adacnarca nitens (446 individuals), Thyasira debilis (380 individuals), Thyasira cf. dearborni (227 individuals), and Yoldia eightsi (200 individuals). Conversely, 61 species, or 45.5% of the total number of species, were restricted to a single site (uniques, e.g. Cuspidaria minima, Cyclochlamys pteriola, Acteon antarcticus, and Solariella antarctica, and 22 species (16.4%) were restricted to only two sites (Fig. 6) (duplicates, e.g. Cyamiomactra laminifera, Limatula simillima, Typhlodaphne innocentia and Marseniopsis mollis). Thirty one per cent (41 species) of the total number of species were represented by a single individual (singletons, e.g. Trophon echinolamellatus, Belaturricula ergata, Hyalopecten pudicus, and Prosipho chordatus), and 10% (14 species) were represented by two individuals (Table II) (doubletons, e.g. Torellia mirabilis, Conorbela antarctica, Tritoniella belli). At the scale of the large areas, the South Shetland Islands was the zone with the smallest percentage of uniques (37%) and the Eights Coast had the greatest (94%), whereas Peter I Island had the smallest percentage of singletons (22%) and Eights Coast the greatest (72%) (Table II).
Distribution of species range sizes. Range size is the number of sites occupied by a species out of a total of 54 sites.

List of species recorded in the area of study. 1 = South Shetland Islands, 2 = western Antarctic Peninsula, 3 = Bellingshausen Sea, 4 = Peter I Island, and 5 = Eights Coast.

There was no significant relationship between sampling intensity, measured as number of sites in large areas, and the relative quantity of ‘rare’ species measured as unique species (r 2 = 0.469, P = 0.20, Fig. 7a) and duplicate species (r 2 = 0.087, P = 0.63, Fig. 7b). The most sampled area (i.e. South Shetland) had the smallest number of uniques and a small number of duplicates, (Fig. 7a & b), and the least sampled area (i.e. Peter I Island) had the largest number of duplicates (Fig. 7b). Similarly, singletons and doubletons were not significantly related to sampling intensity (r 2 = 0.154, P = 0.51, Fig. 8a; r 2 = 0.582, P = 0.13, Fig. 8b), with the smallest number at the most sampled areas (i.e. South Shetland Islands and Bellingshausen Sea) and the largest number at the least sampled areas (i.e. Eights Coast and Peter I Island).
Relations between number of sites and ‘rare’ species in each zone, a. uniques, species restricted to a single site, b. duplicates, species occurring at exactly two sites. Solid circle = South Shetlands Islands, open circle = western Antarctic Peninsula, solid square = Bellingshausen Sea, open square = Peter I Island, solid triangle = Eights Coast.

Relations between number of sites and ‘rare’ species in each zone, a. singletons, species represented by a single individual, b. doubletons, species represented by only two individuals. Solid circle = South Shetlands Islands, open circle = western Antarctic Peninsula, solid square = Bellingshausen Sea, open square = Peter I Island, solid triangle = Eights Coast.

Some measures of alpha diversity varied significantly between areas. In particular, species richness, number of genera and families did show significant variation among areas, whereas taxonomic diversity and taxonomic distinctness did not show any variation (Table IV).
Variation of the different alpha diversity measures among the five large areas. Significant values are in bold.

Similarity between sites (beta diversity) and relationships to horizontal and vertical distance
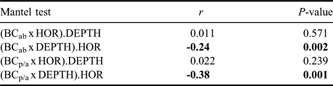
The Partial Mantel test between beta-diversity (measured as Bray-Curtis similarity) and depth differences, while controlling for the effect for horizontal distance, showed a significant negative correlation (Table V). In contrast, the correlation between beta diversity and horizontal separation, when the effect for depth differences was controlled, was not significant. Depth, therefore, had an effect on the beta diversity, although this effect was quite weak. These results were also corroborated by BIO-ENV analysis (Table VI).
Results of partial Mantel test investigating the relationships between Bray-Curtis similarity and horizontal distance (HOR) and depth (DEPTH) in the study area. The Bray-Curtis similarity was applied to abundance data (BCab) and to presence/absence data (BCp/a). Significant values are in bold.
Combination of environmental variables (longitude, latitude and depth), taken K at a time; bold indicates best combination overall.

Discussion
Besides Peracarida, the most speciose macrofaunal taxa in the Southern Ocean are Polychaeta and Mollusca (Brandt et al. Reference Brandt, De Broyer, De Mesel, Ellingsen, Gooday, Hilbig, Linse, Thomson and Tyler2007). There is, however, very little information on the patterns of diversity of these two groups at both small and large scales. Gastropods are the dominant group in terms of species number, followed by bivalves (Linse et al. Reference Linse, Griffiths, Barnes and Clarke2006, Clarke et al. Reference Clarke, Griffiths, Linse, Barnes and Crame2007). Furthermore, molluscs exhibit very different levels of richness between areas within the Southern Ocean (Linse et al. Reference Linse, Griffiths, Barnes and Clarke2006).
In this study, we have to consider two main constraints. First, different gear was used so the datasets include organisms collected from the near-bottom water column, from the sediment and from within the sediment. Second, the spatial scales differed from those used in other studies in the Southern Ocean. Therefore, any comparison of biodiversity patterns with other studies is complicated, but at the same time, necessary due to the general lack of information in this particular geographic area.
Alpha, beta and gamma diversity
Although there were differences in alpha diversity between areas for species richness, number of genera and number of families, these differences were marginally significant, (Table IV). Alpha diversity showed high variability within an area and, therefore, more extensive sampling is necessary to identify regional differences and to evaluate whether alpha diversity may be impacted more by local (e.g. competition and predation) rather than by regional processes.
Values of beta diversity were high and varied among areas. The beta diversity for the whole area was high (15.2) in comparison to that reported by Ellingsen et al. (Reference Ellingsen, Brandt, Ebbe and Linse2007) who examined Whittaker’s beta diversity for bivalves in an extensive Atlantic sector of the deep Southern Ocean. Nevertheless, the mean value of Bray-Curtis similarity (9.34%) for the whole study area could be considered low compared to other studies where smaller areas of study were used (e.g. Cattaneo-Vietti et al. Reference Cattaneo-Vietti, Chiantore, Schiaparelli and Albertelli2000, Arnaud et al. Reference Arnaud, Troncoso and Ramos2001).
Gamma diversity had comparable values to those reported for different molluscs’ taxa in other areas from the Southern Ocean (e.g. Cattaneo-Vietti et al. Reference Cattaneo-Vietti, Chiantore, Schiaparelli and Albertelli2000, Schiaparelli et al. Reference Schiaparelli, Lörz and Cattaneo-Vietti2006, Ellingsen et al. Reference Ellingsen, Brandt, Ebbe and Linse2007; Table VII). Nevertheless, our area of study presented the least number of sampled sites as compared to those areas previously reported. For example, the north Ross Sea had the highest value of gamma diversity (Schiaparelli et al. Reference Schiaparelli, Lörz and Cattaneo-Vietti2006) among all compared studies (Table VII), but that survey used a more intensive sampling effort, i.e. 108 sites in an area of 1° latitude×3° longitude.
Species richness in large areas (diversity measured as SRL, gamma diversity) reported for molluscs in other areas from the Southern Ocean. Cattaneo-Vietti et al. (Reference Cattaneo-Vietti, Chiantore, Schiaparelli and Albertelli2000) for Gastropoda and Bivalvia, Schiaparelli et al. (Reference Schiaparelli, Lörz and Cattaneo-Vietti2006) for Polyplacophora, Gastropoda, Bivalvia and Scaphopoda and Ellingsen et al. (Reference Ellingsen, Brandt, Ebbe and Linse2007) for Bivalvia.

The negative values of the residuals of the fitted least-squares regression for the logarithmic transformed number of samples against gamma diversity in each area, suggested a relatively low regional diversity for that sampling effort (Clarke & Lidgard Reference Clarke and Lidgard2000). However, the western Antarctic Peninsula was the unique area with a positive residual value (see Fig. 5b), suggesting a relatively high regional diversity for that sampling effort. There was not a significant strong relationship between numbers of samples per area and gamma diversity, which varied among areas. For example, Eights Coast, the least sampled area, had the lowest value of gamma diversity, whereas the Bellingshausen Sea, which was also poorly sampled, had the highest value.
These results suggest that variation in gamma diversity could be affected not only by different sampling coverage among areas, but also by other factors acting at large scale. In particular, factors such as speciation, evolutionary adaptation and climate are generally regarded as having primacy at large scales (Clarke & Lidgard Reference Clarke and Lidgard2000).
In general, the values of diversity found in this study agree with recent studies in the Southern Ocean that have found high species richness at both small and large scales (see review in Brandt et al. Reference Brandt, De Broyer, De Mesel, Ellingsen, Gooday, Hilbig, Linse, Thomson and Tyler2007). A large number of molluscs are also typical for other deep sea areas (e.g. Rex et al. Reference Rex, Etter and Stuart1997, Olabarria Reference Olabarria2005). Nevertheless, it is known that processes driving patterns of diversity differ at different scales, and therefore it is difficult to compare data from different areas. Factors such as the age of the environment and the evolutionary time available for species to develop in an area have been invoked as main drivers of the high species richness found in the Southern Ocean compared to the northern polar areas (Webb & Gaston Reference Webb and Gaston2000).
Another striking result in this study was the lack of correlation between alpha and gamma diversity. In this context, the regional enrichment model suggests that local diversity represents a balance between local extinction and colonization from the regional species pool (see Rex et al. Reference Rex, Etter and Stuart1997). Thus, a larger regional pool of colonists would, on average, support higher local diversity. Under an adequate sampling coverage, this lack of relationship in the study area might indicate that local assemblages are not yet saturated. Unfortunately, some areas were under-sampled and, therefore, this fact precludes any meaningful examination of this question for molluscan assemblages.
Spatial patterns
The pattern of distributions of species’ range sizes are typically strongly right-skewed, agreeing with that previously reported in the Antarctic deep sea (Ellingsen et al. Reference Ellingsen, Brandt, Ebbe and Linse2007). The finding that the most species-rich areas did not contain significantly more rare species does not always hold true in marine systems (Ellingsen Reference Ellingsen2001). There was a high percentage of ‘rare’ species measured as uniques, duplicates, singletons and doubletons. In particular, more than 21.6% of the species were represented by single individuals and more than 37% occurred in only one site. The large numbers of rare species resulted in low levels of faunal similarities between sites (i.e. high beta diversity). A great proportion of rare species is quite common in the Southern Ocean (Brandt et al. Reference Brandt, Ellingsen, Brix, Brökeland and Malyutina2005, Ellingsen et al. Reference Ellingsen, Brandt, Ebbe and Linse2007, Clarke et al. Reference Clarke, Griffiths, Linse, Barnes and Crame2007). Acceptance of the lognormal distribution of individuals among species implies that most species are rare, occurring at low abundances per sample unit. One possible explanation is that only very few samples (i.e. low intensity of sampling) of the regional diversity are taken into account. If sampling intensity increases, more ‘rare’ species most likely to be found, and faunal similarity between sites will decrease (Ellingsen et al. Reference Ellingsen, Brandt, Ebbe and Linse2007). In this study, there was no relationship between sampling intensity and the proportion of ‘rare’ species, suggesting that the number of rare species could respond to other factors apart from sampling intensity (e.g. Bellingshausen Sea or Eights Coast were poorly sampled areas). It has been suggested for molluscs that rare species in deep sea samples is the result of source-sink dynamics, in which many abyssal populations are maintained by immigration from the bathyal zone (Rex et al. Reference Rex, McClain, Johnson, Etter, Allen, Bouchet and Warén2005). Isolation and scanty information for some areas (i.e. Eight Coast and Peter I Island) may also account for a great proportions of rare species.
Variation of beta diversity with vertical and horizontal distance
Studies of biodiversity have provided abundant evidence that large-scale processes strongly affect both regional, landscape and local diversity at all small scales (Ricklefs & Schluter Reference Ricklefs and Schluter1993). Furthermore, different taxa are affected by different processes suggesting a causal balance between history and modern ecology.
In our study, the Bray-Curtis similarity between all combinations of sites was only related to depth, although this relationship was quite weak. While this seems to match current paradigms, conflicting patterns of variation in diversity with depth have been observed, depending on whether studies cover temperate and tropical or Antarctic areas. For example, gastropods displayed a parabolic relationship whereby diversity increased with depth until 2000–3000 m then declined at deeper sites (Rex Reference Rex1981). Nematodes from temperate and tropical areas exhibited a non-linear increase in diversity with depth through the bathyal zone, with a decrease at deeper sites (Boucher & Lambshead Reference Boucher and Lambshead1995). Previous studies in the Southern Ocean have reported contrasting results regarding diversity patterns of diverse taxonomic groups (e.g. Brandt et al. Reference Brandt, Ellingsen, Brix, Brökeland and Malyutina2005, Ellingsen et al. Reference Ellingsen, Brandt, Ebbe and Linse2007). For example, isopods displayed higher species richness in the middle depth range and lower in the shallower and deeper parts of the area (Brandt et al. Reference Brandt, Ellingsen, Brix, Brökeland and Malyutina2005). In contrast, the number of polychaete species showed a negative relationship to depth, whereas bivalves showed no clear relationship (Linse Reference Linse2004, Ellingsen et al. Reference Ellingsen, Brandt, Ebbe and Linse2007). None of these studies found a significant relationship between patterns of diversity and horizontal distance (i.e. latitude and/or longitude). In contrast, Linse et al. (Reference Linse, Griffiths, Barnes and Clarke2006) found that molluscs exhibited geographic variation in patterns of diversity in the Southern Ocean with large variation between distinct sub-regions (i.e. 1000 km scale).
One possible explanation for the lack of a horizontal gradient in our study might be that the scale of the study area was too small. Large-scale trends in benthic diversity may only be evident over very large latitudinal spans (Gaston Reference Gaston2000). Alternatively, patterns of molluscs’ diversity in the Southern Ocean might be more affected by processes associated with depth rather than horizontal distance. Depth-related gradients have been attributed to differences in productivity, competition, predation (Rex Reference Rex1981), sediment heterogeneity (Etter & Grassle Reference Etter and Grassle1992), and evolutionary factors (Gage Reference Gage2004). Nevertheless, the highly inadequate sampling away from the continental shelves makes the distinguishing of any depth clines in the Southern Ocean very difficult (see Clarke et al. Reference Clarke, Griffiths, Linse, Barnes and Crame2007). Therefore, any conclusion regarding depth clines should be interpreted with caution since the major bulk of data in this work come from the continental shelf.
Acknowledgements
We would like thank the officers and crews of RV Hespérides, as well as the colleagues who have been supportive in collecting the samples used in this study. The BENTART cruises were carried out under the auspices of the Spanish Government through the Antarctic Programmes REN2001-1074/ANT and GLC2004-01856/ANT of the Ministry of Education and Science (MEC). We also thank Professor Andrew Clarke and one anonymous referee for comments which improved the manuscript.



