Epithermal systems form close to the surface and are often associated with gold, silver and base-metal mineralizations. They are divided into high-sulfidation (HS) and low-sulfidation (LS) systems. The term HS is generally used to describe an initially S-rich hydrothermal system in a relatively oxidized (SO2) state (Hedenquist, Reference Hedenquist and Horn1987). The HS deposits in continental-type, magma-related hydrothermal systems are associated with andesitic volcanoes and having high-temperature fumaroles and acid-sulfate-chloride hot springs, and crater lakes (Arribas, Reference Arribas and Thopmson1995). In contrast, LS deposits occur through the interaction of near-neutral pH and reduced-H2S hydrothermal fluids that interact with wall rocks (White & Hedenquist, Reference White and Hedenquist1995). Both deposit types occur in hydrothermal systems with silica sinter depositing hot springs and steam-heated acid-sulfate alterations (Henley & Ellis, Reference Henley and Ellis1983). General textural aspects of the LS deposits consist of cavity-filling veins with sharp boundaries or stockworks of small veins (White & Hedenquist, Reference White and Hedenquist1995). These deposits show a wide variety of textures determined as banded, crustiform with quartz, chalcedony-lined and druse-lined cavities, and vein breccias (White & Hedenquist, Reference White and Hedenquist1995). Veins may also occur in HS deposits; the majority of veins consist of disseminated ores replacing leached country rock, however. Both LS and HS deposits are typically structurally controlled but they have distinctive gangue mineralogy and alteration zoning (White & Hedenquist, Reference White and Hedenquist1995). Thus, chalcedony, calcite and adularia are observed in LS deposits whereas kaolinite, pyrophyllite-diaspore, alunite and baryte are common in HS systems. The alteration-mineral assemblage and its zonation provide useful information about the palaeo-isotherms and the potential for economic hydrothermal mineralization (Meyer & Hemley, Reference Meyer, Hemley and Barnes1967; Henley & Ellis, Reference Henley and Ellis1983; Reyes, Reference Reyes1990; Izawa et al., Reference Izawa, Urashima, Ibaraki, Suziki, Yokoyama, Kawasaki, Koga and Taguchi1990; White & Hedenquist, Reference White and Hedenquist1995). In the LS systems, smectite is stable at <160°C and transforms to interstratified illite-smectite and finally to illite, which is generally stable at >220°C (Reyes, Reference Reyes1990). The ore zone contains adularia and calcite, which indicate increased pH, associated with CO2 loss from boiling in near-surface conduits. In the HS alteration zones, kaolinite, dickite, pyrophyllite, diaspore and alunite are stable under acidic conditions (Reyes, Reference Reyes1990).
The geological, mineralogical and chemical characteristics, origin and technological properties of the most important Turkish kaolin deposits were summarized by Fuji et al. (Reference Fujii, Kayabalı and Saka1995). Most deposits originated from the hydrothermal alteration of andesitic and dacitic rocks and their associated tuffs, granitic intrusions and less commonly, metamorphic rocks (Seyhan, Reference Seyhan1978; Sayın, Reference Sayın1984, Reference Sayın2007, Reference Sayın2016; Ünal-Ercan et al., Reference Ünal-Ercan, Ece, Schroeder and Karacık2016), but sedimentary kaolins are also present (Gençoğlu and Bayhan, Reference Gencoğlu and Bayhan1989). Okut & Gök (Reference Okut and Gök1975) and Okut et al. (Reference Okut, Köse, Çakar and Elmacı1984) reported the geology and hydrothermal origin of the Düvertepe kaolin deposits in the Balıkesir region which were formed by the fault-controlled hydrothermal alteration of Miocene rhyolites-rhyodacites and contain kaolin-type and alunite-type mineral paragenetic groups (Ece et al., Reference Ece, Ekinci, Schroeder, Crowe and Esenli2013). In this region, along the Simav graben (Düvertepe and Şaphane district), high sulfidation is dominant whereas, in the central part, low-sulfidation manifestations are also present. Alunite and halloysite-rich deposits in the Turplu area are situated to the nortwest of Balıkesir on the Biga peninsula. These deposits were formed by sulfate-rich hydrothermal and meteoric waters on the volcanic rocks along the fault zones (Ece & Schroeder, Reference Ece and Schroeder2007; Ece et al., Reference Ece, Schroeder, Smilley and Wampler2008). In the Bilecik region, Söğüt area, the kaolin occurrences in the Küre kaolin pit, were formed at the expense of a granodiorite which underwent shear fault-controlled extensive hydrothermal alteration. In the same Söğüt area, the refractory clay deposits occur in the Neogene fluvial-lacustrine sediments, in different small basins (Gençoğlu et al., Reference Gencoğlu and Bayhan1989). The Neogene sedimentary kaolin deposits in İnhisar and Yakacık formed from the weathering of granite and gneiss basement rocks (Gençoğlu & Bayhan, Reference Gencoğlu and Bayhan1989; Fuji et al., Reference Fujii, Kayabalı and Saka1995). In the Çanakkale region, the Duman kaolin and the Kırıklar halloysite deposits, the purest of their type in Turkey, were formed by hydrothermal alteration of dacitic tuffs (Sayın, Reference Sayın1984), while the the Sarıbeyli-Sığırlı- and Bodurlar kaolin-alunite deposits were formed from alteration of Late Eocene–Miocene calc-alkaline volcanic rocks by magmatic waters (Ünal-Ercan et al., Reference Ünal-Ercan, Ece, Schroeder and Karacık2016). The mineral paragenesis observed in these deposits reflects both supergene and hypogene processes.
In the Eskişehir region, Mihalıççık district, the Yarıkçı kaolin deposit was derived from the hydrothermal alteration of fine-grained crystal tuff at the southern margin of the ophiolithic complex, which thrusted southward over the Neogene tuffaceous formation (Fuji et al., Reference Fujii, Kayabalı and Saka1995). In the same district, the kaolin deposit near Ahırözü-Üçbaşlı-Hamidiye, Mihalıççık, at the Ayının Tepe pit which is included in the present study area, was one of the most important kaolin resources in Turkey (Seyhan, Reference Seyhan1978, Sincan, Reference Sincan1978). In this area, granite and serpentinite rocks have fault contact and both were affected by hydrothermal alteration. In the Uşak and Kütahya regions, kaolin deposits of economic importance occur within both the volcanic and metamorphic rocks as products of hydrothermal alteration. The Karaçayır kaolinite deposit in the Uşak-Güre basin was formed by the epithermal hydrothermal alteration of both Miocene rhyolite–andesite and Palaeozoic schists (Kadir & Erkoyun, Reference Kadir and Erkoyun2013). The Hisarcık kaolin deposits at the Kızılçukur, Ulaşlar and Kurtdere areas (Emet-Kütahya), formed by hydrothermal alteration of Miocene dacite and dacitic tuffs, are characterized by the association of kaolinite-alunite-natroalunite-hematite in the areas marked by strong kaolinization (Reference Ece and Schroeder2007). Ece & Nakagawa (Reference Ece and Nakagawa2003) studied the alteration of volcanic rocks and the genesis of kaolin deposits. Finally, the sedimentary kaolin deposits in the Şile region, İstanbul, were derived mainly from the initial hydrothermal alteration of feldspars and muscovite in Upper Cretaceous andesitic-rhyolitic calc-alkaline rocks, followed by weathering of the rocks and transportation of the weathering products in lacustrine and coal-forming environments in the Neogene, thus yielding highly plastic, sedimentary ball clays alternating with coal seams.
The major aims of the present study were to investigate the hydrothermal alteration products and to identify the effective hydrothermal system type using mineralogical, textural and geochemical evidence in the vicinity of Ahırözü kaolin deposits, Mihalıççık, Eskişehir-Turkey. In addition to the mineralogical-petrographical studies, fluid-inclusion and trace-element analysis were also performed to reveal the hydrothermal alteration zones, mode of occurrence and tectonic setting of the kaolin deposit. These data may be used as a guide for exploration of other economic kaolin deposits in the region.
STUDY AREA AND GEOLOGICAL SETTING
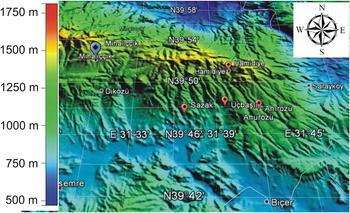
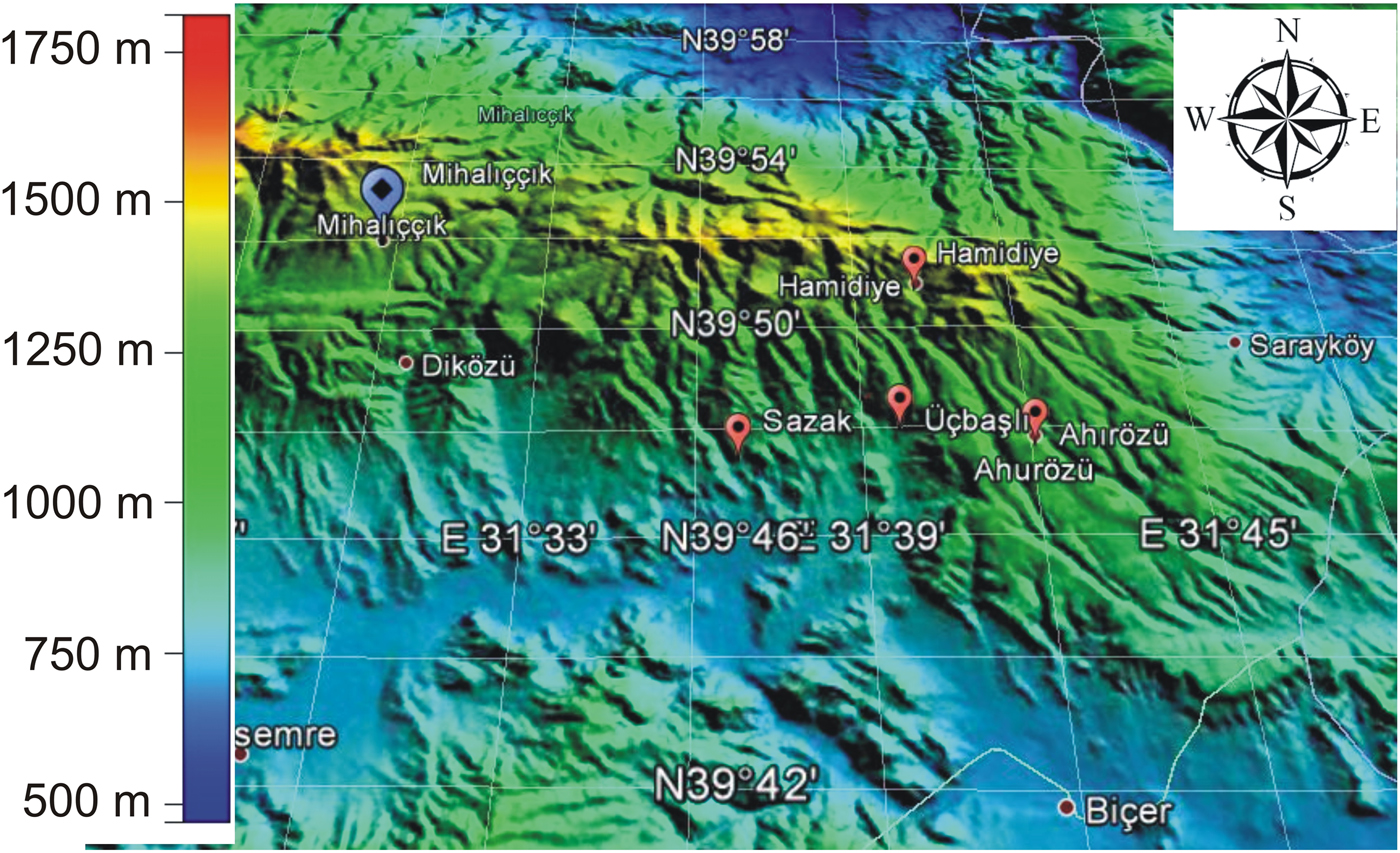
The kaolin deposits distributed around Ahırözü, Hamidiye and Üçbaşlı are located to the southeast of the Eskişehir-Mihalıççık district (Fig. 1). The kaolin deposits are distributed throughout a granitic intrusion which crops out mainly in higher elevations in the region.
Location map of the study area (Global Mapper SRTM data).
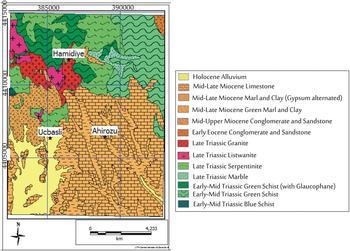
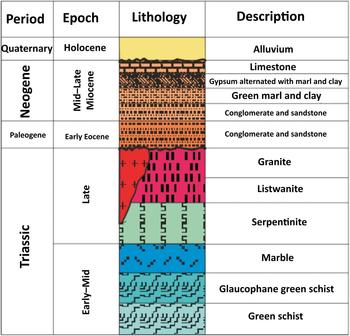
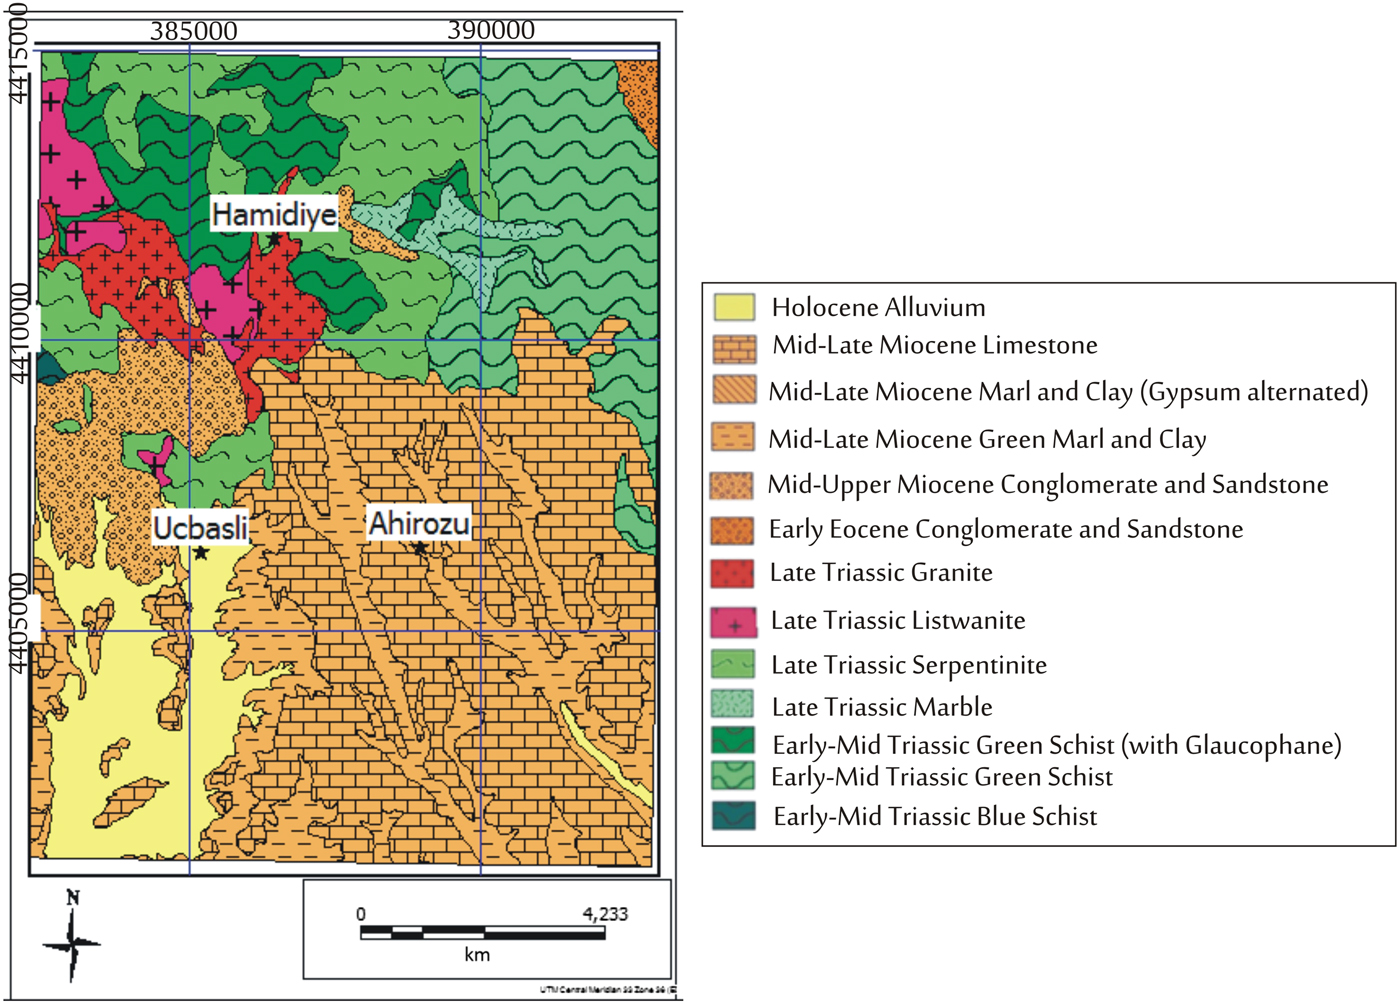
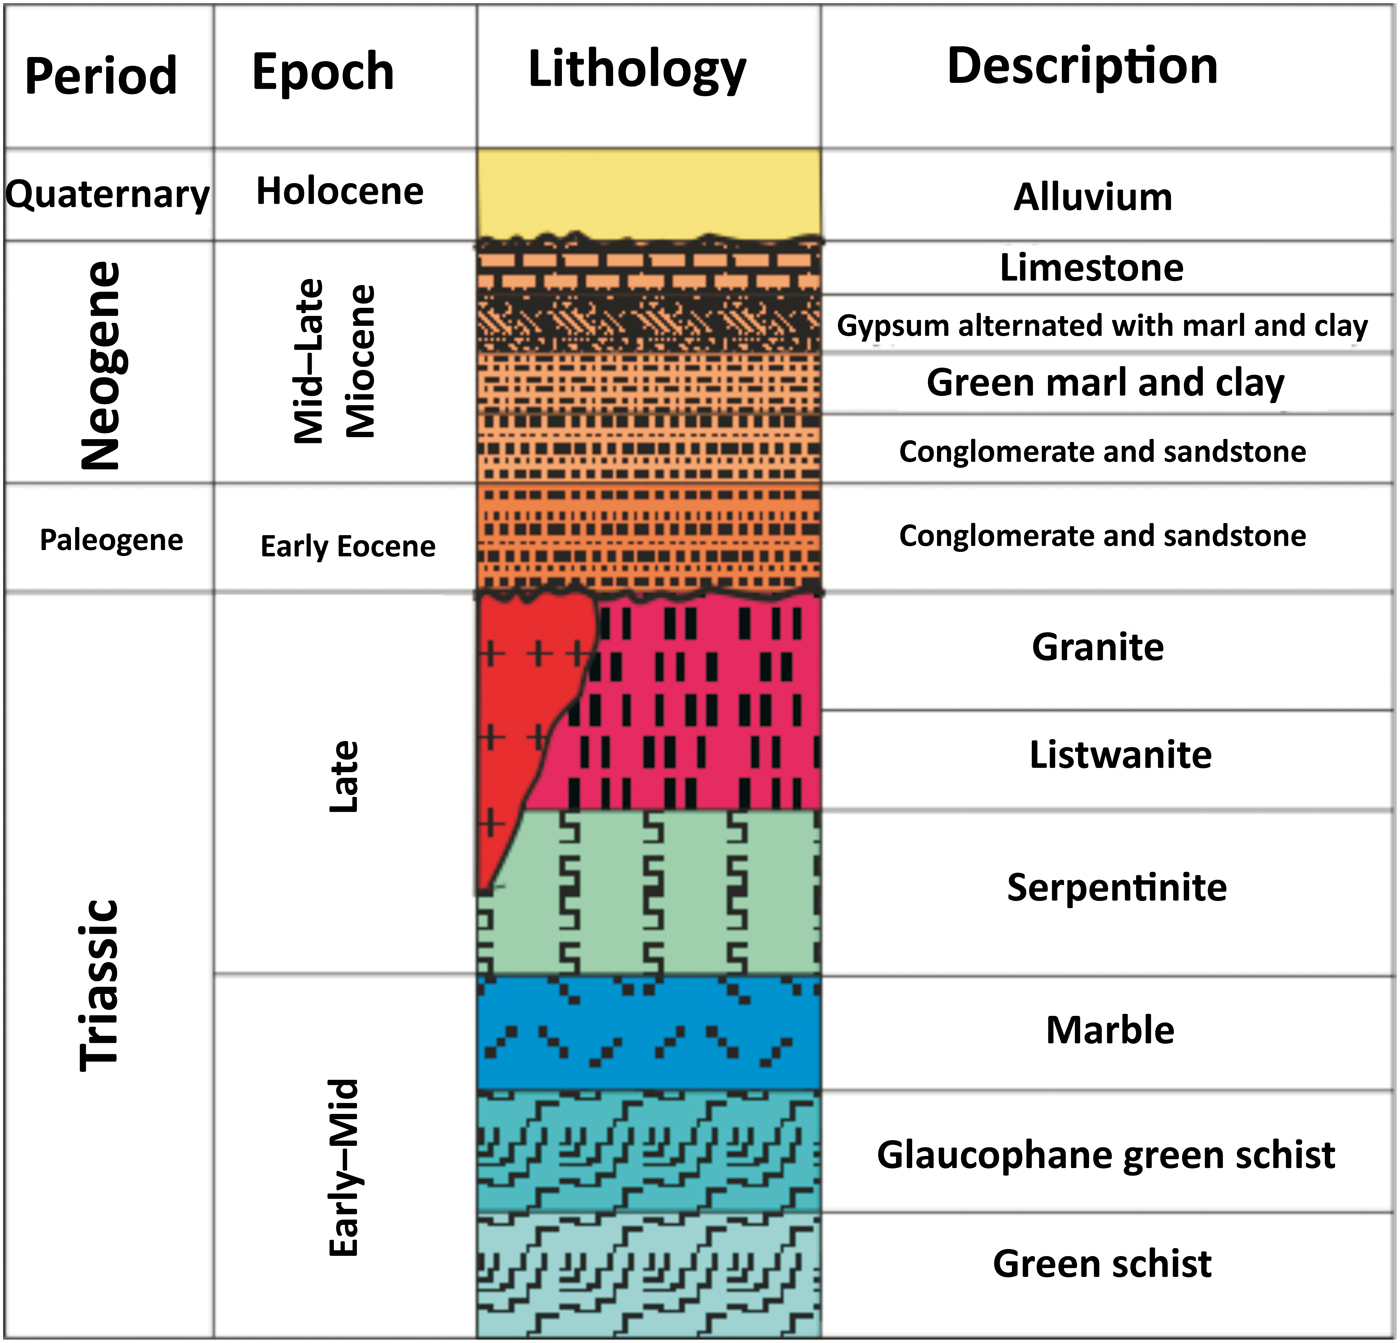
The basement rocks in the region consist of Early to Middle Triassic blue-green schists, gneiss and marbles, and Late-Triassic serpentinite rocks (Gözler, Reference Gözler1987; Karakaş, Reference Karakaş2006). Early-Eocene to Late-Miocene sedimentary units including conglomerate, sandstone, marl, dolomitic claystone and limestone overlie unconformably the basement formations (Gözler, Reference Gözler1987; Karakaş, Reference Karakaş2006). Alluvial deposits overlie unconformably the older units and form the top-most lithology in the generalized stratigraphic section of the region (Figs 2, 3). Granitic units are exposed to the south and blue-green schists and marbles are observed to the north of Hamidiye village (Gözler, Reference Gözler1987; Karakaş, Reference Karakaş2006) (Fig. 2).
Geological map of the study area (after Gözler, Reference Gözler1987).
Generalized stratigraphic section of the study area (after Gözler, Reference Gözler1987).
EXPERIMENTAL
A total of 55 rock samples were collected from the outcrops of granitic, ultramafic (serpentinite) and metamorphic units (Supplementary Table 1). Supplementary data are available from DOI: 10.1180/clm.2018.19). Exposures at fault zones and kaolin quarries were the most suitable sites for sampling because the study area was highly vegetated and bedrocks were covered by thick layers of soil. Road and valley cuts also provided good exposures for sampling at different alteration zones.
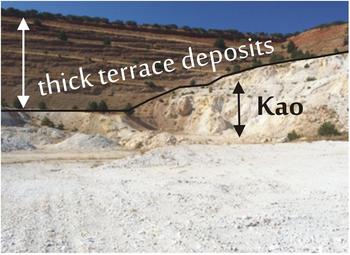
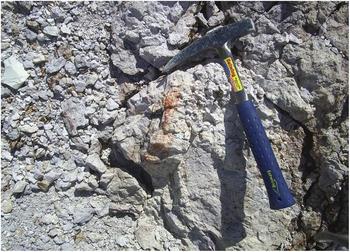
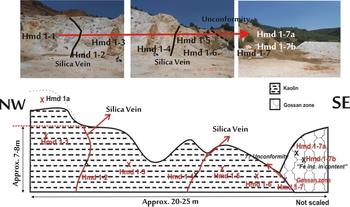
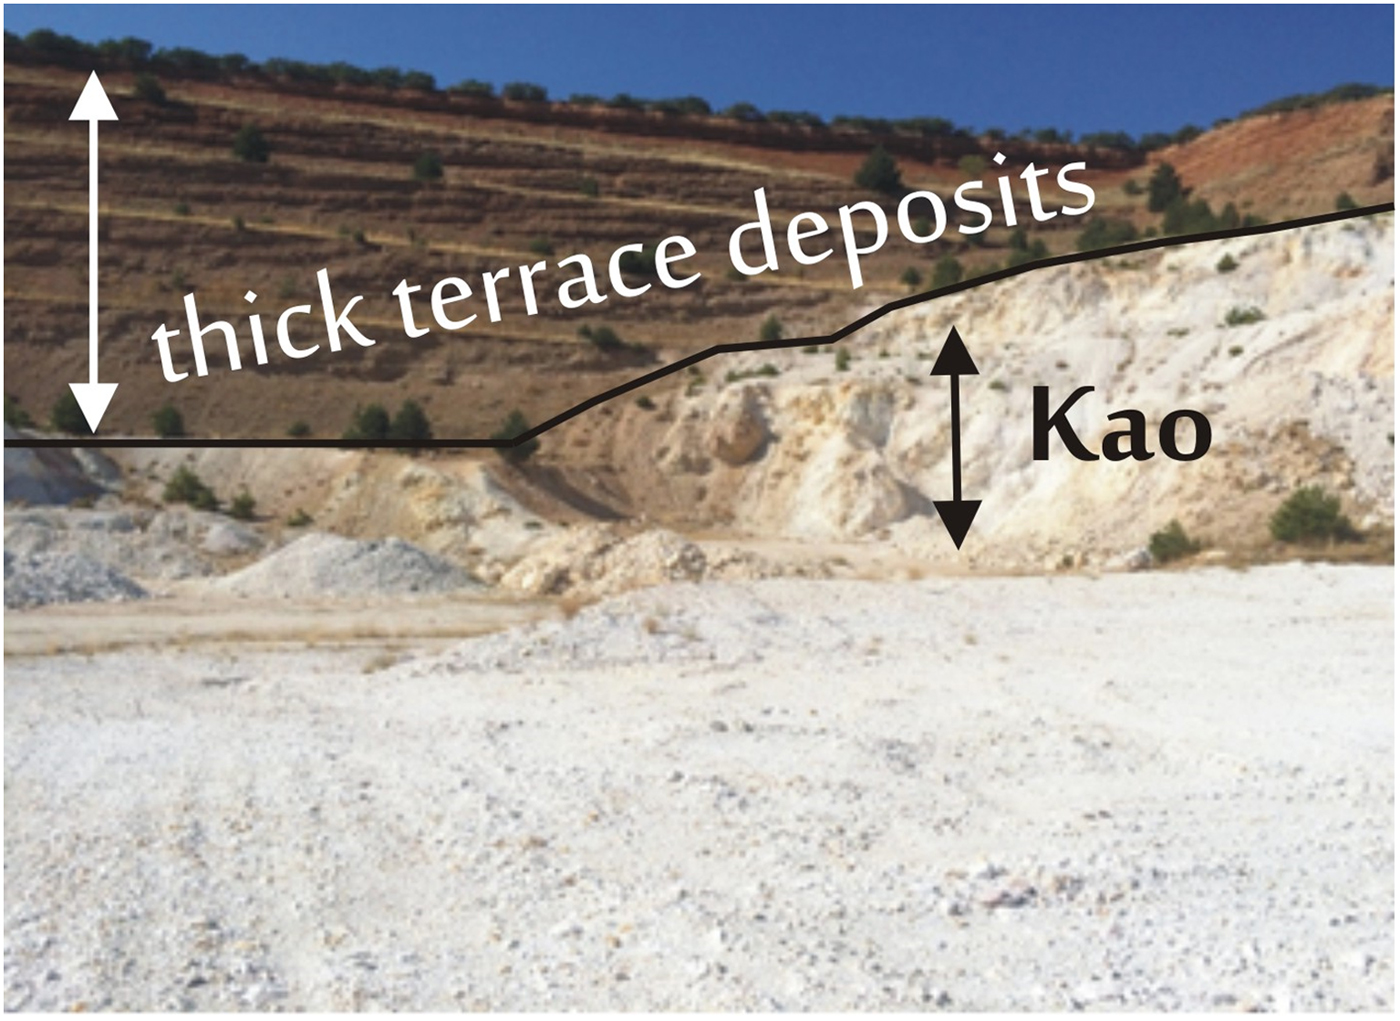
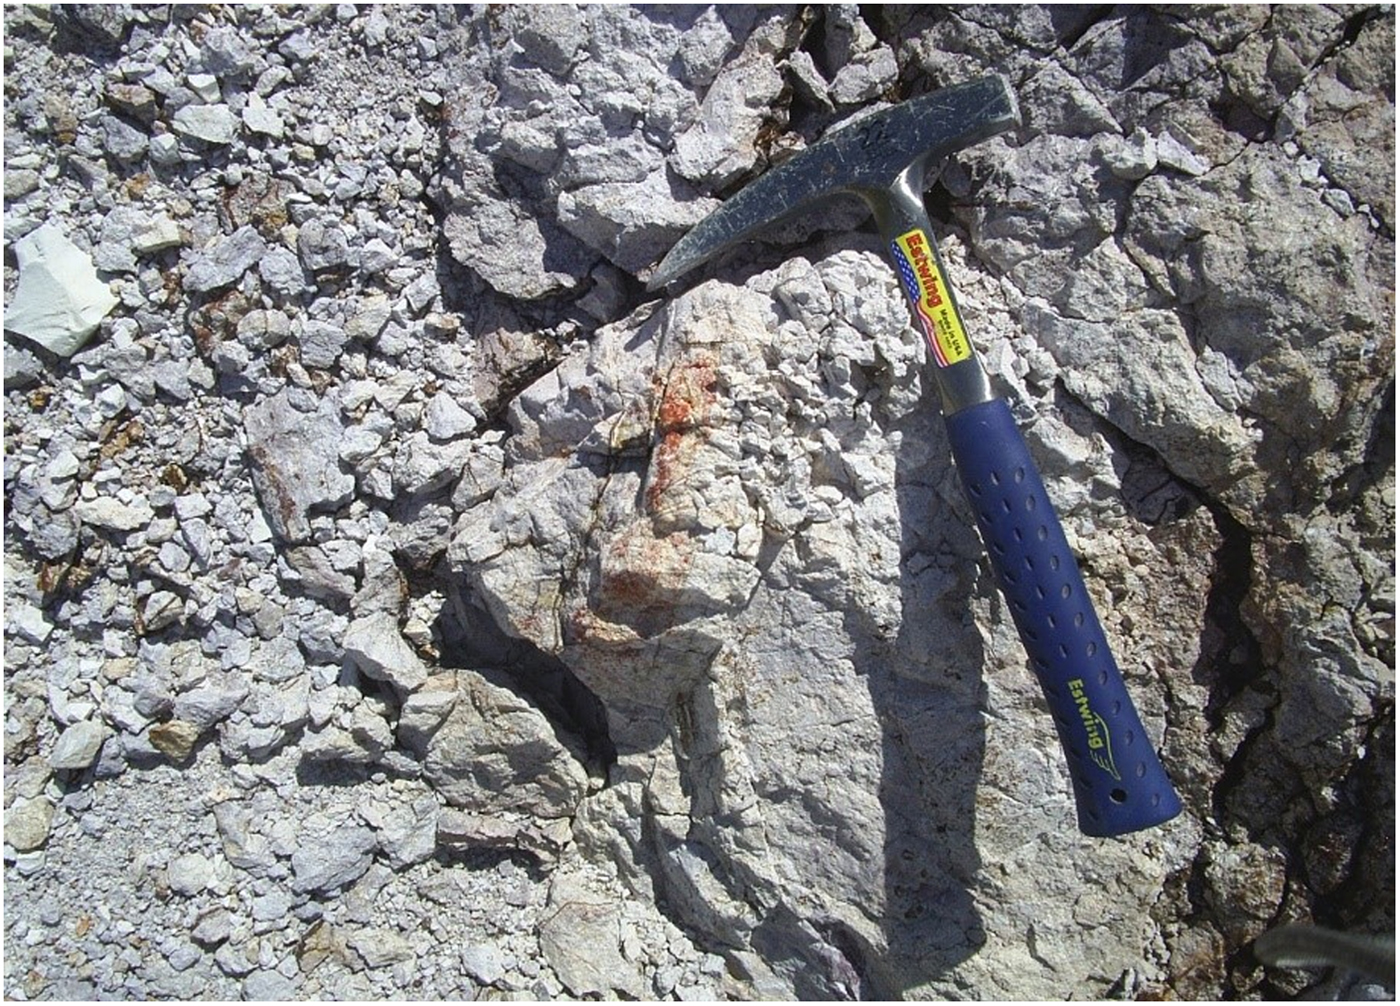
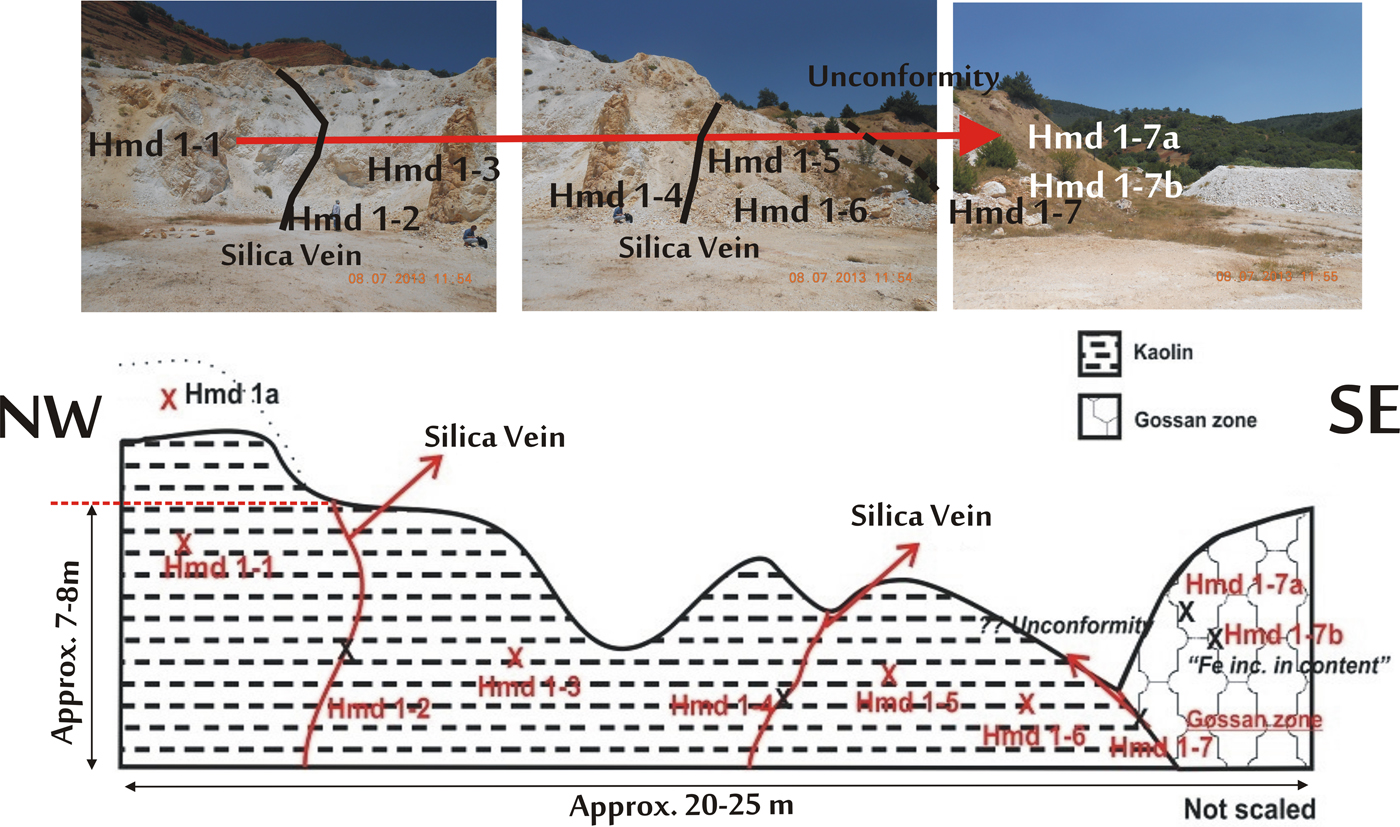
There are two main open-pit kaolin mines covered by detrital sediments in the study area (Fig. 4). Pink natroalunites are also present in the kaolin deposits (Fig. 5). Kaolin deposits, which occur as massive thin layers, contain quartz crystals and exhibit graphic texture indicating the presence of a granitic intrusive protolith. The cross-section (386636E 4409312N (UTM)) presents kaolinized rocks (Fig. 6). The gossan zone was also determined to be trending northwest–southeast in the same cross-section (Fig. 6). The samples obtained from the ‘Gossan zone’ have high Fe contents (samples Hmd 1–7a and Hmd 1–7b) and are characterized by stockwork structures.
General view of Ahırözü kaolin deposits at the Ayının Tepe pit. Kao = kaolinized rocks in the study area (trees in the upper part of the image for scale).
Reddish/brownish overprints in a kaolinized rock containing natroalunite (sample L-6).
Cross-section of Hmd 1 series from northwest to southeast.
The mineralogical properties were studied by polarizing microscopy, scanning electron microscopy (SEM equipped with energy dispersive X-ray spectrometer, SEM-EDX) and X-ray powder diffraction (XRD) in the laboratories of the Department of Geological Engineering and the Central Laboratory of Middle East Technical University, Turkey. Chemical analyses of the samples were conducted by inductively coupled plasma-mass spectrometry (ICP-MS) by ACME Analytical Laboratories Ltd. (Vancouver, Canada).
The whole-rock and clay-fraction mineralogy of the samples were studied by XRD using a Rigaku Miniflex II diffractometer with Ni-filtered Cu-Kα radiation and a graphite monochromator operating at 35 kV and 15 mA with a scanning speed of 2°2θ/min. The <2 µm clay fractions were separated by dispersing the whole-rock sample in distilled water after NaOAc buffer acid treatment to eliminate carbonate cement when necessary (Jackson, Reference Jackson1975). This treatment was followed by sedimentation and centrifugation to collect a clay paste. Oriented mounts were prepared by smearing the clay paste on glass slides. The XRD patterns were obtained for samples which were powdered, air-dried, ethylene glycol-solvated, and heated at 350 and 550°C.
The SEM-EDX studies were performed using a Quanta 400 F Field emission instrument to identify crystal morphologies and textural characteristics. The operating conditions were adjusted to a 32 s counting time and a 20 kV accelerating voltage. In addition, chemical data were obtained by EDX.
Fluid inclusions were studied in transparent gangue-mineral quartz collected from kaolinized samples to characterize the fluid chemistry, fluid evolution and temperature (Bodnar, Reference Bodnar, Samson, Anderson and Marshall2003). Forty eight fluid inclusions were analysed to estimate the homogenization temperatures (T h, °C) and salinity (wt.% NaCl) values. The analyses were performed for four samples using a Leica DM 2500P microscope, LINCAMMDS 600TS 1500. The fluid-inclusion analysis system was available at the General Directorate of Mineral Research and Exploration (MTA) Mineralogy Petrography Laboratories. Two-phase (liquid + gas) primary inclusions for which homogenization temperatures were calculated were filled with nitrogen. Thus, melting temperatures (T m, °C) and salinity (wt.% NaCl) values were found by the following equation (Bodnar, Reference Bodnar1993):
 $${\rm Salinity}\, \left({\rm wt}.\% \,{\rm NaCl} \right) = \left(-1.78\,TM \right) - \left(0.0442\,TM^2 \right) + (0.000557\,\left({TM} \right)^3$$
where TM = melting temperature.
RESULTS AND DISCUSSION
Hydrothermal-alteration mineralogy and alteration zoning
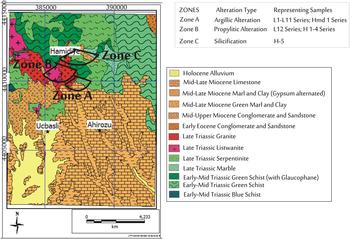
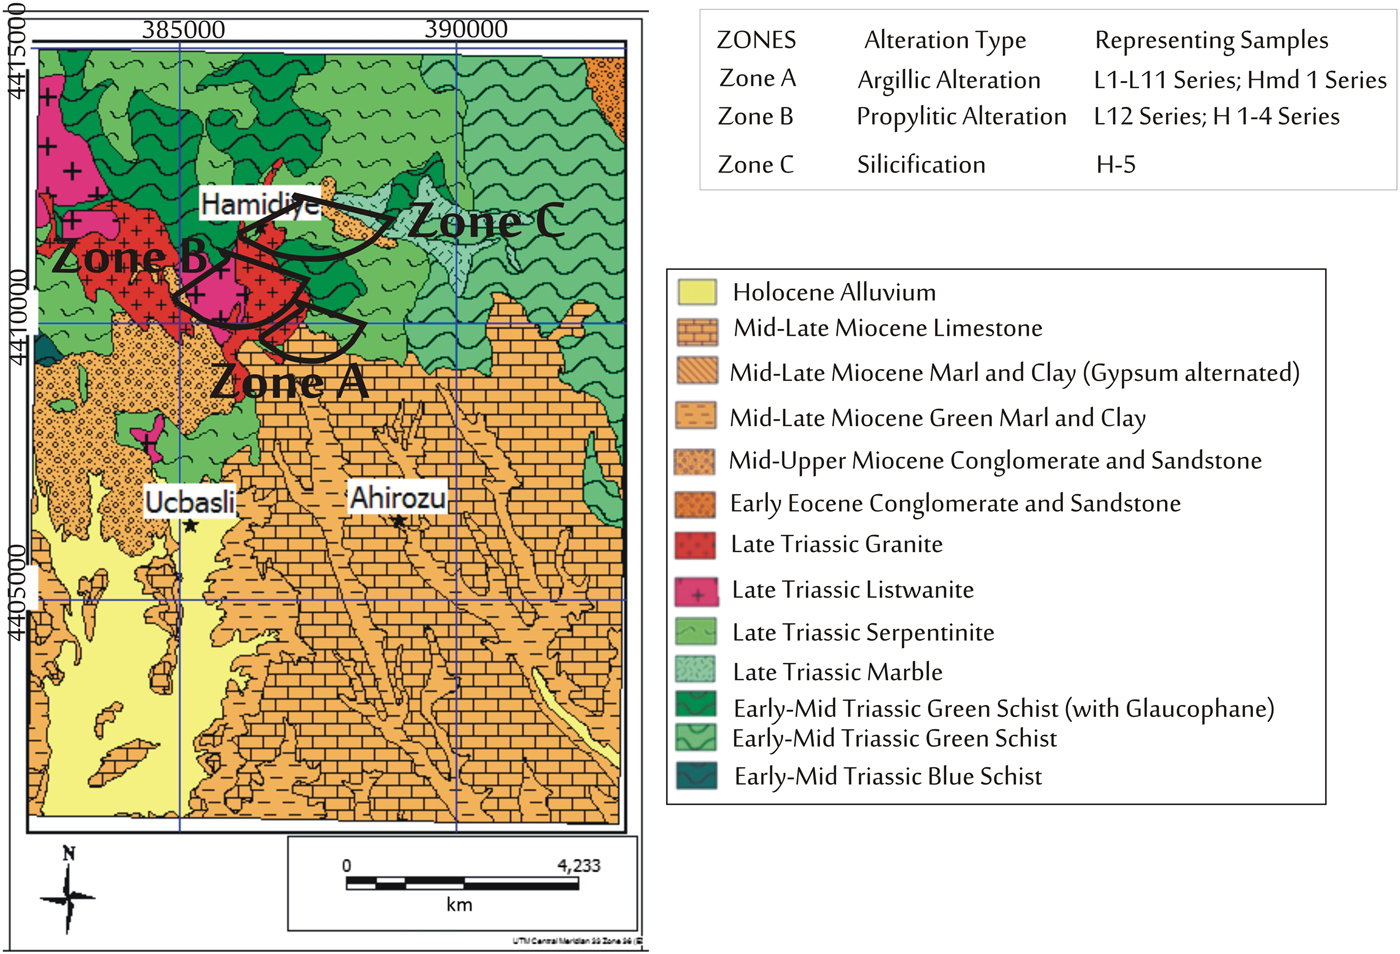
Based on the mineralogical and petrographic characteristics, primary and secondary mineral phases of three lateral alteration zones were identified in the study area, namely Zone A, Zone B and Zone C (Fig. 7).
Zone map of the study area (after Gözler, Reference Gözler1987)
Zone A
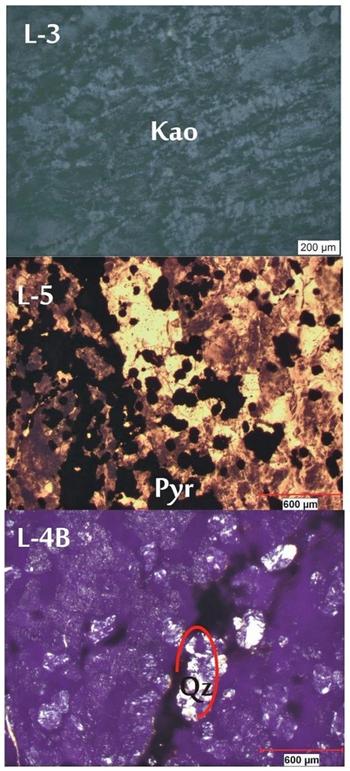
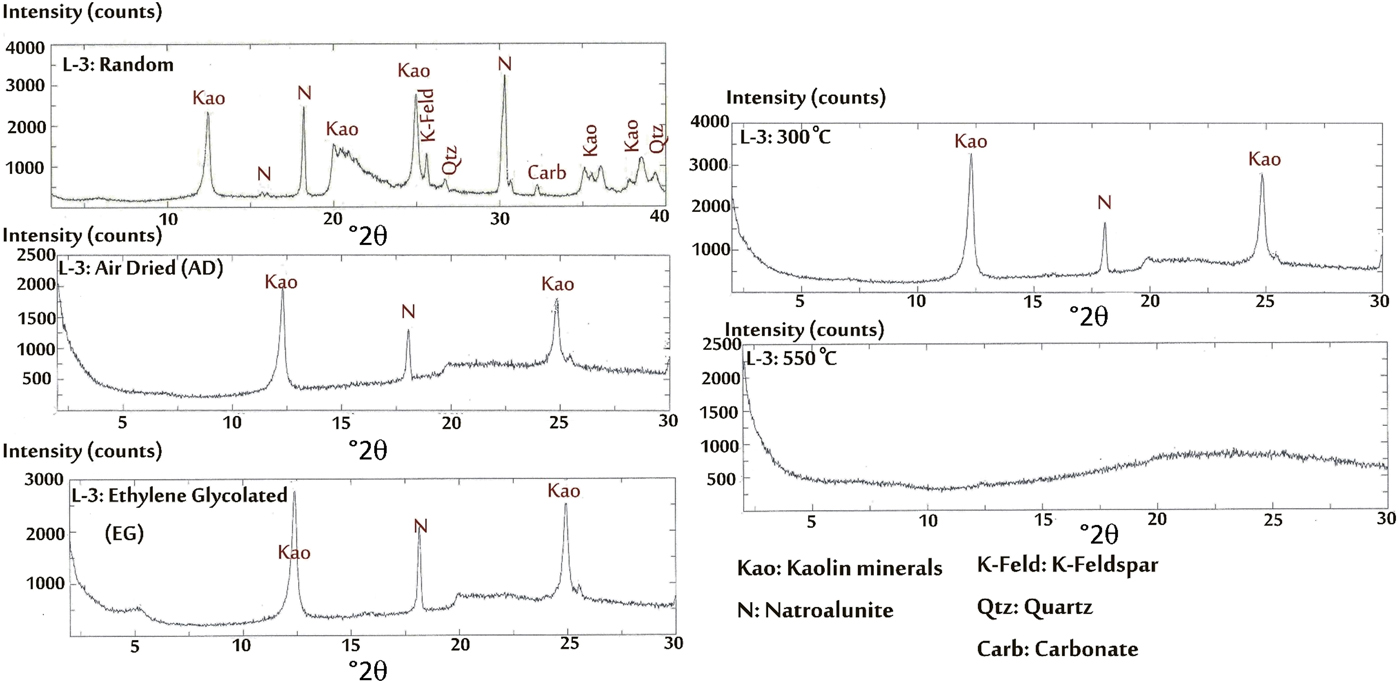
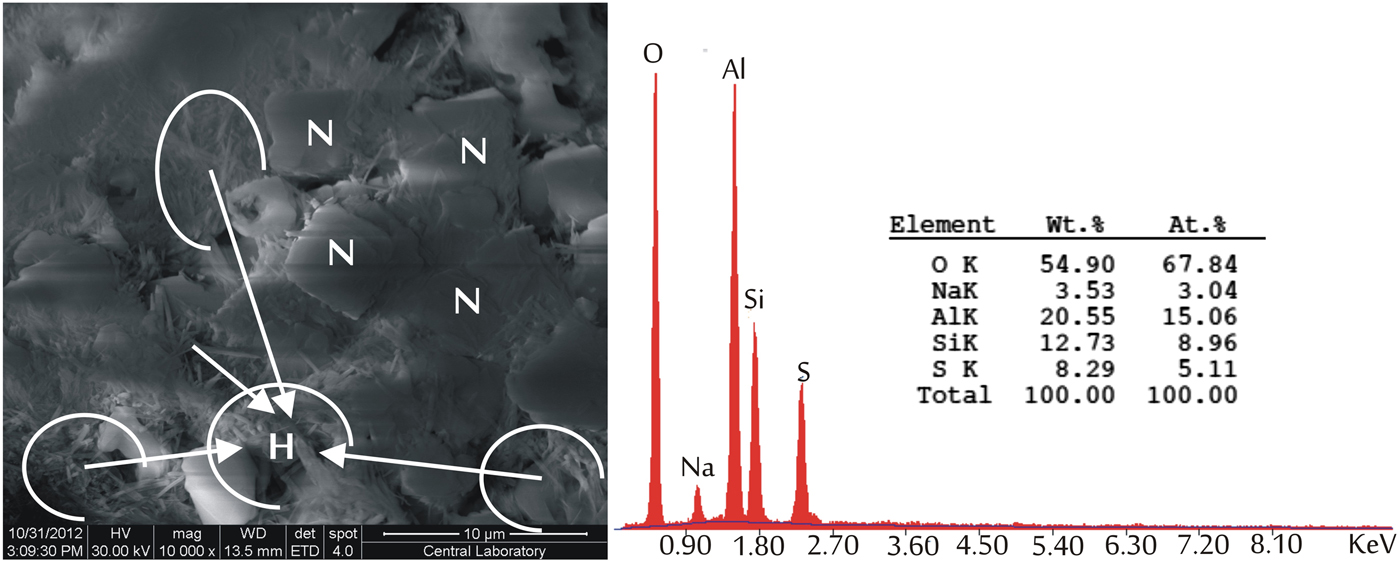
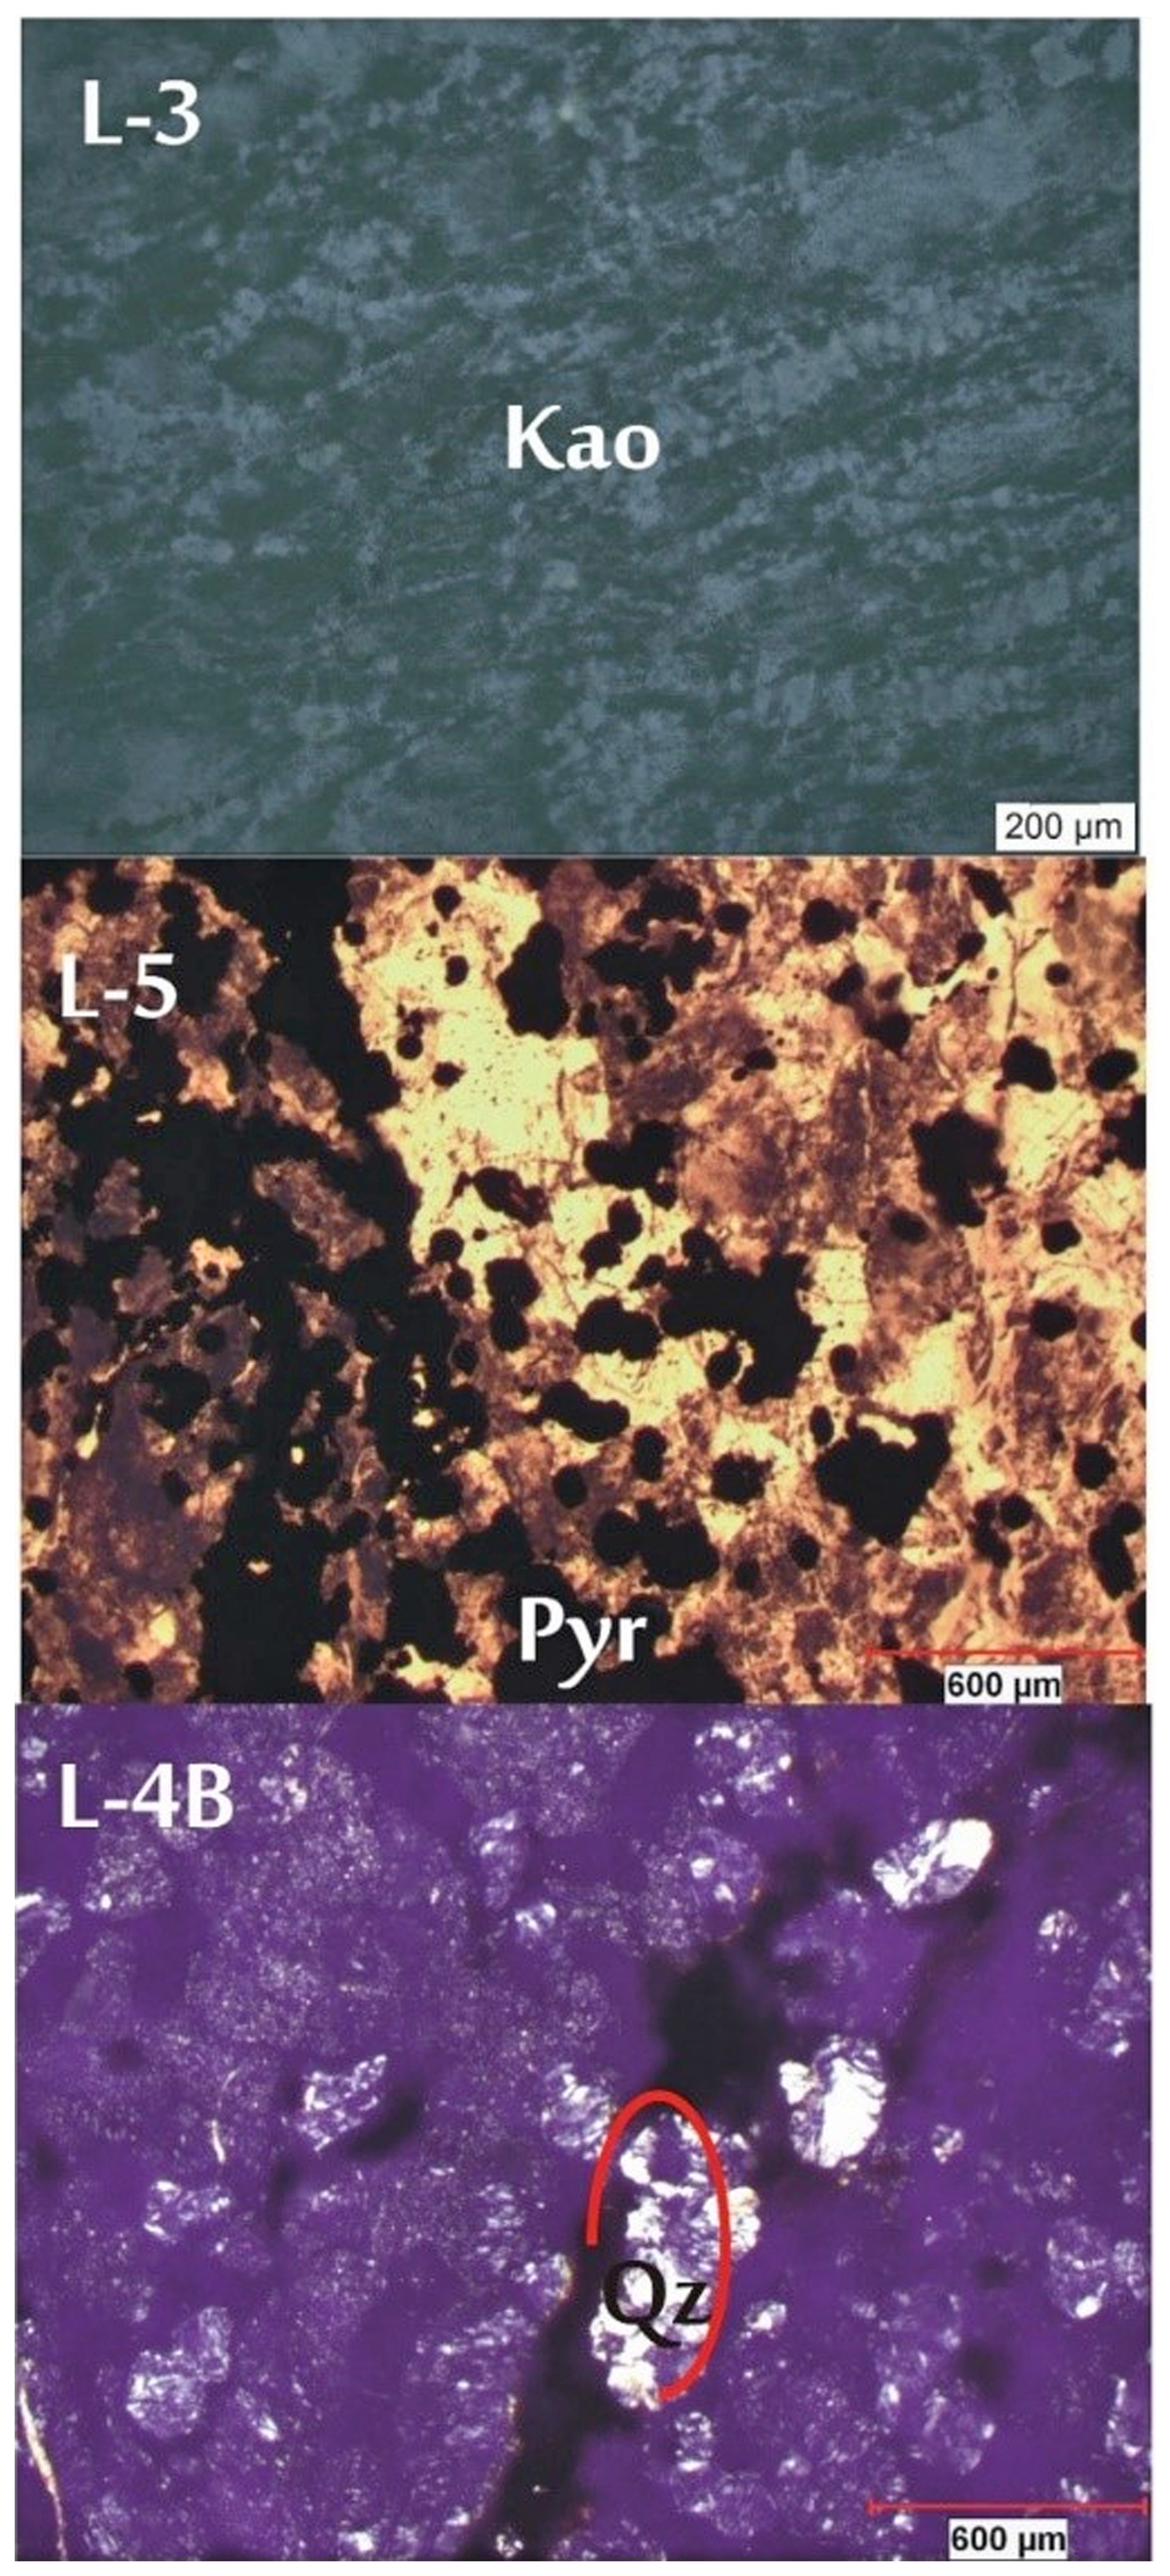
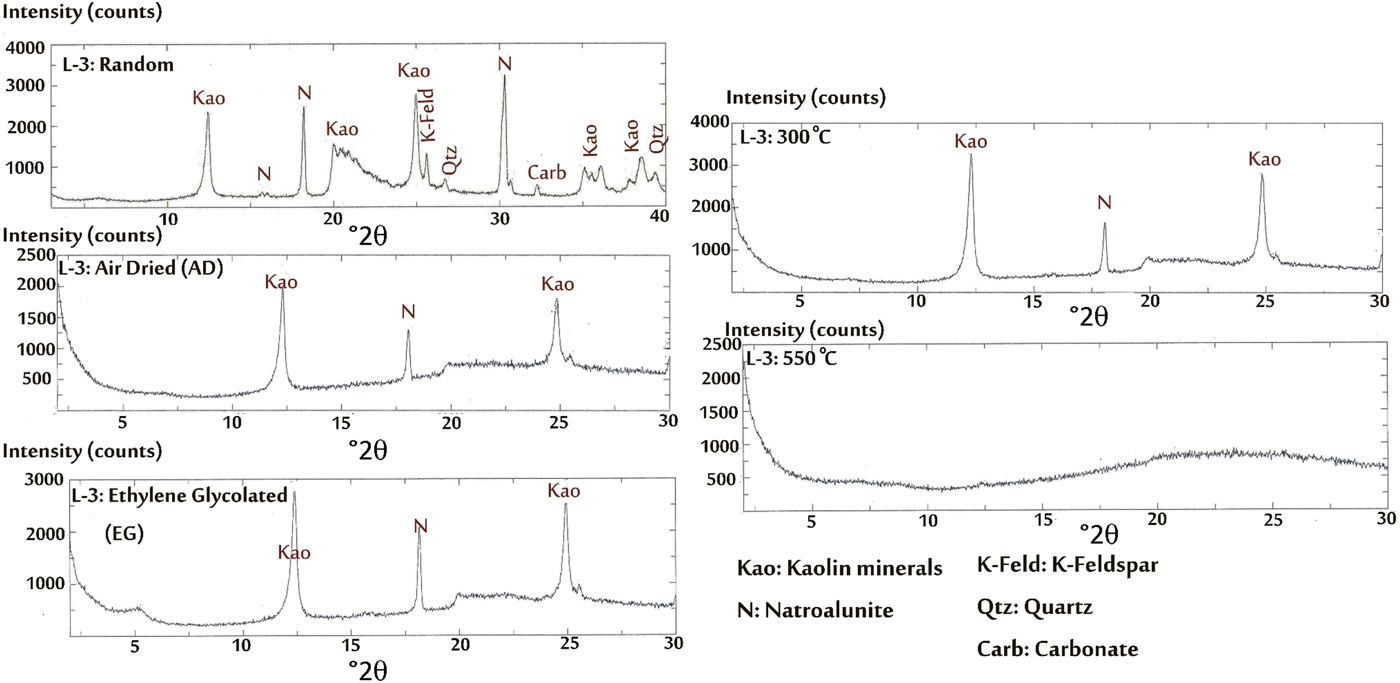
Zone A represents the Ahırözü kaolin deposit and includes clay minerals (mainly kaolinite and minor smectite), pyrite, hematite, goethite, K-feldspar and natroalunite. Kaolin-group minerals, chalcedony and pyrite were detected in thin sections (Fig. 8), and by XRD and SEM-EDX analyses (Figs 9, 10). The K-feldspar and its alteration mineralogy are compatible with the granitic precursor. Natroalunite crystals in sample L-6 displayed rhombohedral morphologies associated with tubular halloysite minerals (Fig. 10).
Thin-section images of samples L-3, L-4B and L-5 representing textural and mineralogical characteristics: kaolinite (Kao), pyrite (Pyr) and chalcedony (Qz) crystals.
XRD patterns of the whole-rock and of the clay fraction of sample L-3. Kao = kaolinite, Qtz = quartz, N = natroalunite, K-feld = K-feldspar, Carb = carbonate.
SEM-EDX analysis of sample L-6 from Zone A showing an association between natroalunite (N) and halloysite (H).

Zone B
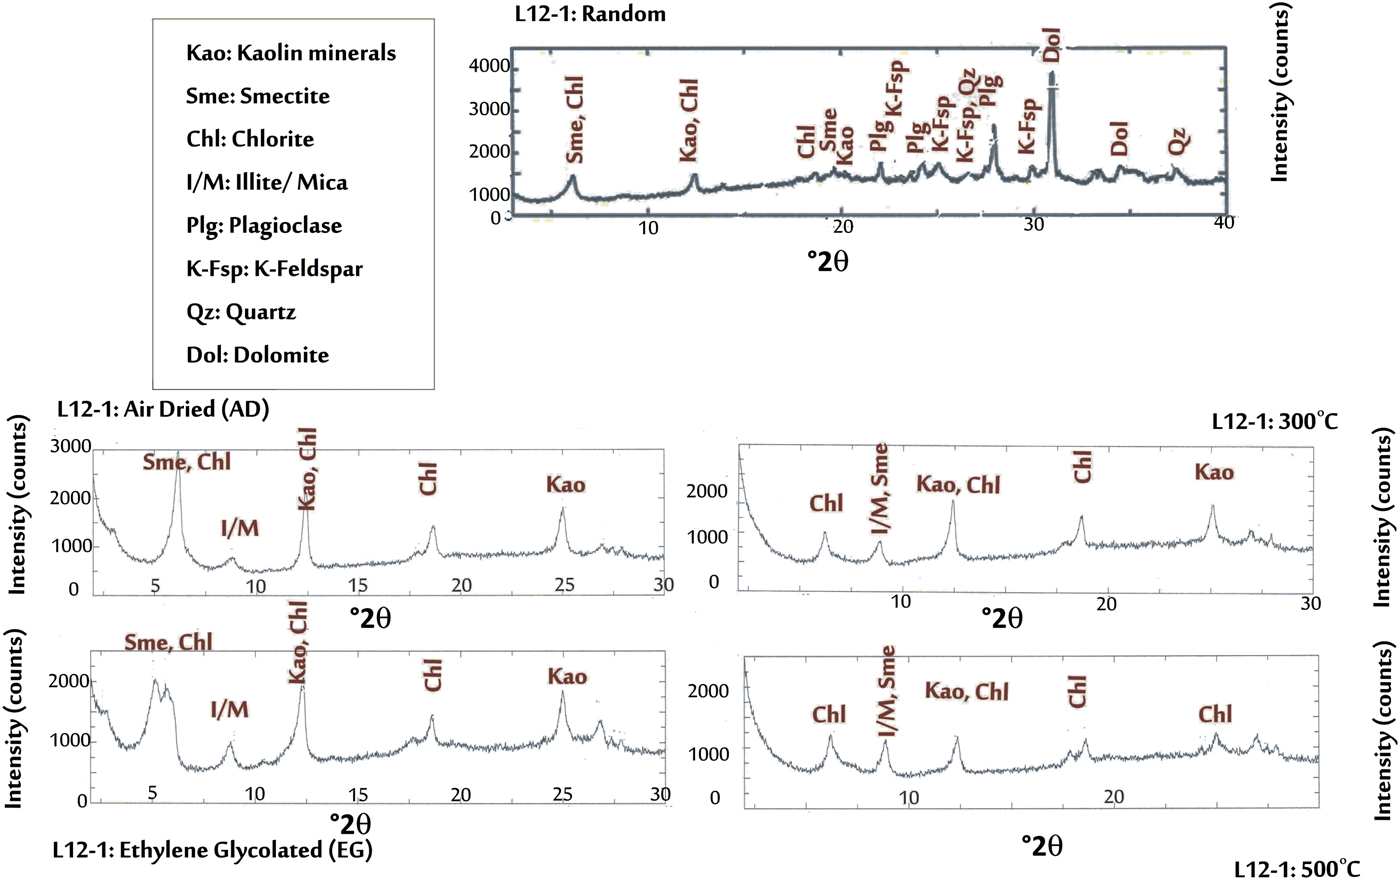
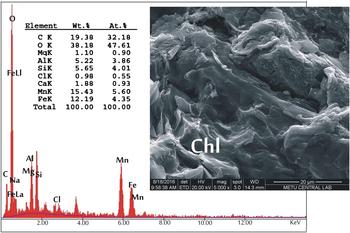
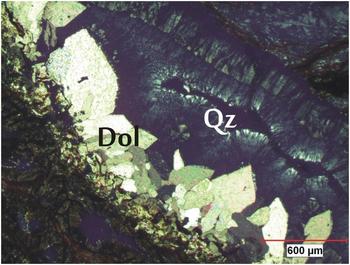
Zone B defines mainly propylitic alteration, which is associated with carbonate minerals. The rocks were mainly altered to chlorite-smectite-illite-epidote mineral assemblages (Figs 11 & 12). Some samples from the serpentinite-granite contact have stockwork structures, which are important for determining the LS epithermal deposits. Crustified quartz and dolomite were also identified as secondary minerals in this zone (Fig. 13). Field observations and petrographic examination showed that Zone B formed from precursor greenschist-facies metamorphic rocks, with relict foliation textures.
Whole-rock XRD traces of sample L12-1 from Zone B containing smectite and chlorite.

SEM images of sample L12-1 showing chlorite morphology and the EDX analysis of chlorite (Chl).

Thin-section photomicrograph showing crustified quartz (Qz) and dolomitization (Dol) in the L12-8 rock sample acquired from Zone B.

Zone C
The rock samples representing Zone C are mainly silicified and represent sinters formed in the area.
Fluid-inclusion analysis
In the present study, 48 fluid inclusions were analysed using quartz crystals from four kaolinized rock samples.
Sample L 12-11
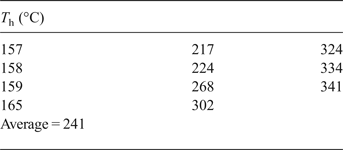
Primary and secondary one-phase fluid inclusions, 2–4 µm in size, with spherical and ellipsoidal shapes were observed in translucent crystals. Two-phase (liquid + gas) primary inclusions were observed as trace amounts varying from 4 to 10 µm in size. The homogenization temperatures (T h, °C) of primary two-phase (liquid + gas) inclusions vary between 157 and 341°C (Supplementary Table 1). The melting temperatures (T m, °C) and wt.% NaCl values of these two-phase primary inclusions were calculated after filling with nitrogen, according to Bodnar (Reference Bodnar1993). The T m varied between –2.4 and –3.8°C, while the % NaCl values varied between 4 and 6.2% (Supplementary Table 2).
Sample L 12-2
The sample consists of dull crystals and rare translucent crystals, with primary, one-phase (gas) inclusions and with trace one-phase (liquid) inclusions. The sizes of these inclusions varied from 2 to 4 µm. Two-phase (liquid + gas) inclusions were noted at trace amounts with sizes of 5–6 µm. Homogenization temperatures acquired from primary, two-phase (liquid + gas) inclusions were 176 and 197°C. The melting temperature (T m, °C) was not calculated as the two-phase (liquid + gas) inclusions were very small.
Sample HMD 1–4
Very rarely, primary and secondary one-phase (liquid) inclusions were observed in translucent crystals of this sample. In addition, two-phase secondary inclusions <2 µm (liquid + gas) in size were found in trace amounts. The homogenization temperature and salinity could not be determined, therefore. In a 3 µm inclusion, an homogenization temperature of 351°C was calculated.
Sample HMD 1–2
This sample consists of dull and transparent crystals. Several one-phase (liquid), very rare two-phase (liquid + gas) and trace amounts of other one-phase (gas) inclusions were detected in transparent crystals. The size of the two-phase inclusions was 4–6 µm whereas that of one-phase (liquid) spherical inclusions was 2–4 µm. In addition, one-phase (gas) inclusions 4 µm in size were also present.
Homogenization temperatures obtained from primary two-phase inclusions varied between 126 and 365°C (Supplementary Table 3). The two-phase primary inclusions from which homogenization temperatures were calculated were mostly filled with nitrogen; melting temperatures and salinity values were determined according to Bodnar (Reference Bodnar1993). The T m (°C) values varied between (–2.3) and (–3.8) and the wt.% NaCl values varied between 3.9 and 6.2% (Supplementary Table 4).
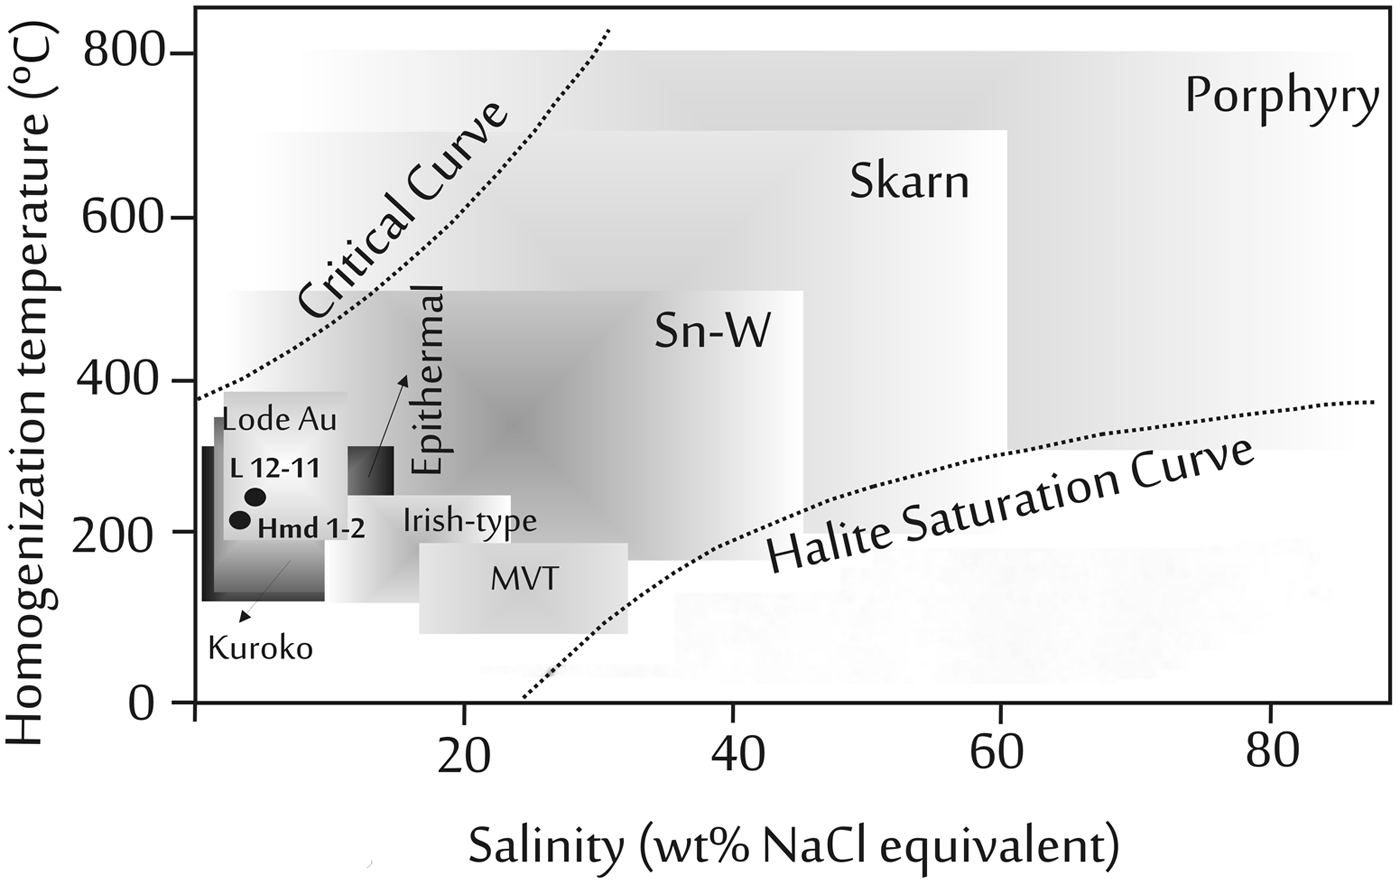
Epithermal deposits were formed primarily from modified, surface-derived, low-salinity fluids with homogenization temperatures ranging from <100 °C to ~300 °C (Wilkinson, Reference Wilkinson2001). The homogenization temperatures identified in the present study were in the range 126–365 °C. The homogenization temperature and salinity values are within the range of epithermal deposits, although only two samples were used for fluid-inclusion studies (Fig. 14).
Homogenization temperature–salinity diagram illustrating typical ranges for inclusions from different deposit types (after Wilkinson, Reference Wilkinson2001, reproduced with the permission of Elsevier). Average T h (°C) and wt.% NaCl values of samples L 12-11 and Hmd 1-2 are plotted on the diagram.

Geochemical imprints
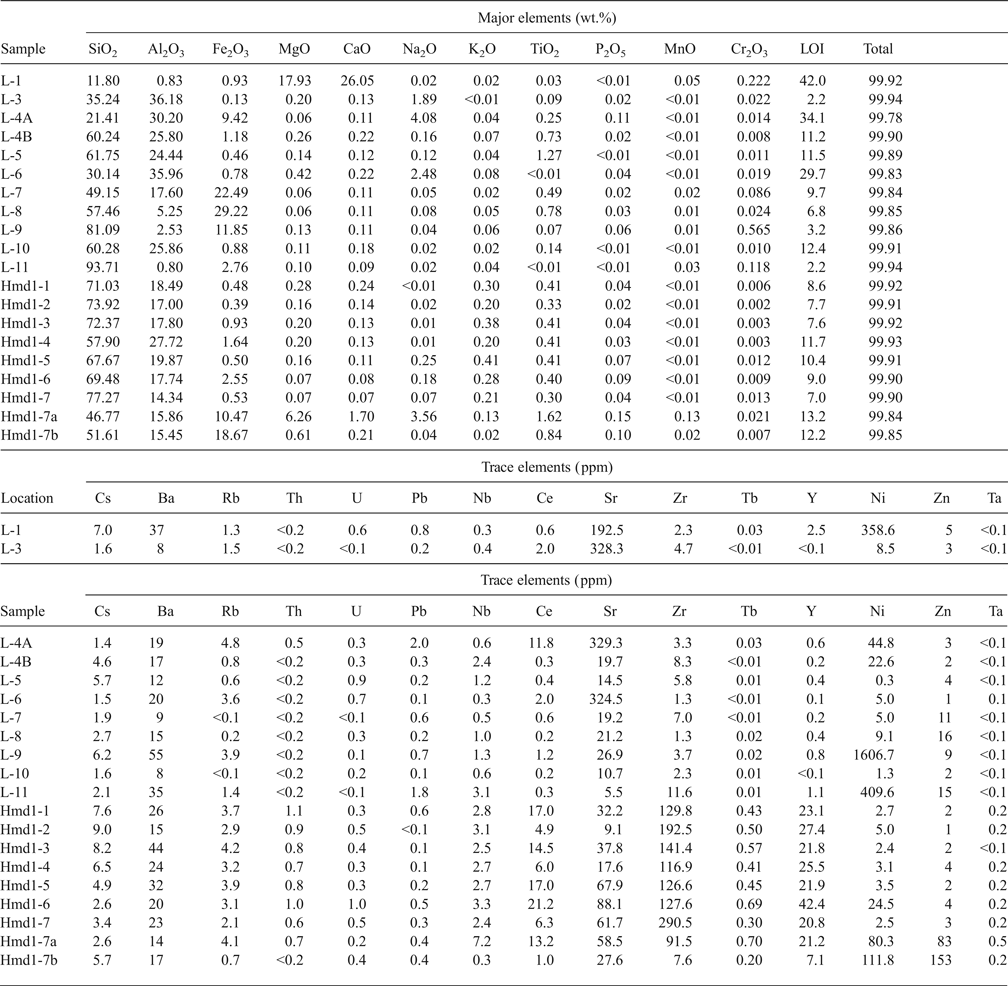
The results of major- and trace-element analyses of representative samples from the Ahırözü kaolin deposit are listed in Table 1. The high Al2O3 contents in samples L-3 and L-4A indicate the presence of kaolinite. However, a small amount of MgO was also attributed to the smectite content as in the sample L-6 (Table 2). The large Fe2O3 contents recorded in samples L-4A, L-7, L-8, L-9 (9.42–29.22 wt.%) are related to the presence of hematite and goethite, while the high CaO and MgO contents in sample L-1 are due to the abundant dolomite. The greater Na2O concentrations of samples L-3 (1.89%), L-4A (4.08%) and L-6 (2.48%) reflect the abundance of natroalunite and lesser amounts of feldspars. Finally, the intense silicification in samples L-9 (81.09%) and L-11 (93.71%) resulted in high values of SiO2 (Table 1). The samples labelled as the Hmd1 series belonging to the kaolinized granitic protolith are more silicified and have lower Al2O3 contents than the L-series samples (Table 1).
Homogenization temperatures T h (°C) for sample L 12–11.

The major and trace element analyses of selected samples from the Ahırözü kaolin deposit.

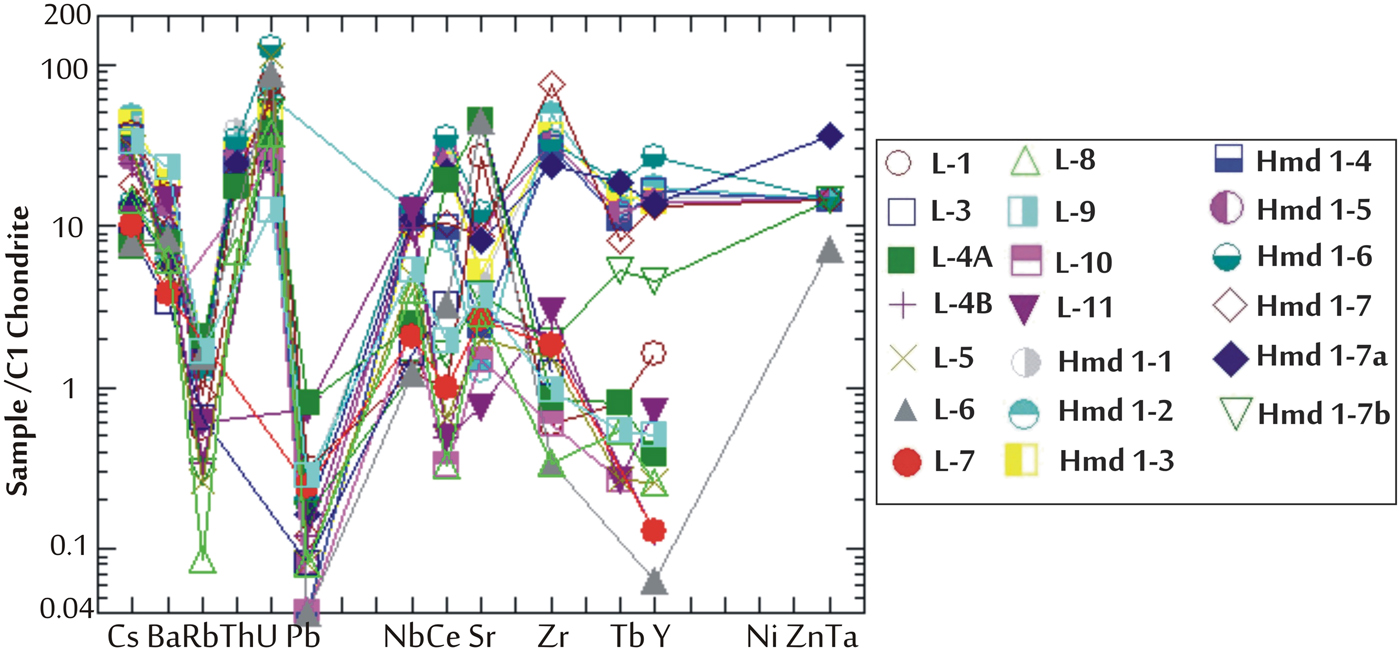
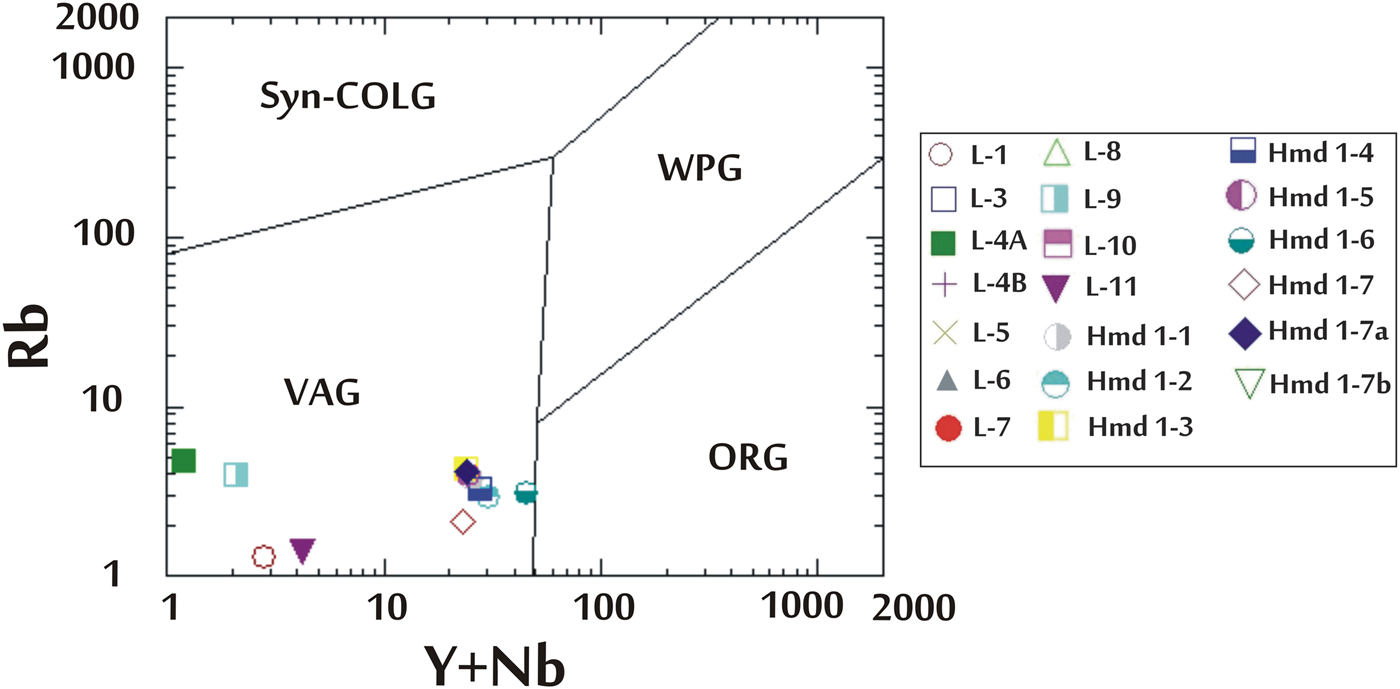
Chondrite-normalized trace-element spider diagrams of the selected kaolinized samples from the Ahırözü kaolin deposit show depletion of Rb, Pb and Y and enrichment of Cs, U and Sr (Fig. 15). These variations may either be inherited from the parent rock or may reflect the behaviour of large ion lithophile (LILE) elements in feldspar and mica during hydrothermal alteration. In contrast, high field strength (HFSE) elements such as Nb, Zr and Y in the accessory minerals are considered immobile during alteration. The geochemical signatures of the kaolin samples may be also useful in estimating the tectonic setting of the protolith igneous body hosting the epithermal deposits in the study area, which might be important in exploration studies. The discrimination diagram based on trace elements Rb, Y and Nb (Pearce et al., Reference Pearce, Harris and Tindle1984) was used to obtain preliminary data on the tectonic setting of the granitic protolith of the kaolin deposits (Fig. 16). The samples were plotted in the volcanic-arc granites field (VAG). Previous work has suggested a correspondence between the various types of epithermal deposits and specific volcano-tectonic settings (Sillitoe, Reference Sillitoe and Porter1998, Reference Sillitoe2002; Berger & Bonham,Reference Berger and Bonham1990).
Trace-element spider diagram of selected samples from the kaolin deposit.

Tectonic setting of granite in the study area (Pearce et al., Reference Pearce, Harris and Tindle1984). Syn-COLG: syn-collision granites, WPG: within-plate granites, VAG: volcanic arc granites, ORG: ocean ridge granites.

SUMMARY AND CONCLUSIONS
The Ahırözü kaolins, in the Mihalıççık-Eskişehir area, Turkey, formed by hydrothermal alteration of Mesozoic granitic intrusions along fault contacts with the tectonically obducted Mesozoic serpentinite-matrix melange. Based on the field observations and mineralogical and petrographic investigations, three lateral alteration zones (Zones A, B and C) were observed in the study area. Zone A is characterized by silicification, argillization (mainly kaolin group minerals, and lesser amounts of smectite), pyrite, hematite and natroalunite. The presence of K-feldspar with graphic texture suggests that the protolith rock has a granitic composition. In the outward direction, Zone B is propylitic, characterized mainly by chloritization associated with carbonatization represented by dolomite. The main alteration products are chlorite, smectite, illite and epidote. Stockwork structures with thin quartz veins are common in this zone which were formed in greenschist units. The rocks in Zone C were mainly silicified and represent sinter formation.
The homogenization temperatures vary between 126 and 365°C according to the fluid-inclusion analyses. Melting temperatures range between –2.3 to –3.8°C and salinity values range over 3.9–6.2%. These results indicate that the Ahırözü kaolin deposits have an epithermal hydrothermal origin based on the homogenization temperature vs. salinity diagram (Wilkinson, Reference Wilkinson2001).
The Ahırözü kaolins are the products of hydrothermal alteration of granitic intrusions emplaced in a volcanic arc-related tectonic setting. The kaolins are depleted in Rb, Pb and Y and enriched in Cs, U and Sr. These variations may either be inherited from the parent rock, or the abundances of the large ion lithophile (LILE) elements in major silicate minerals such as feldspar and mica might be mobile during hydrothermal alteration. The fluid-inclusion data, the intense silicification and sinter formation related to mineralogical zoning and the lack of pyrophyllite (Hedenquist et al., Reference Hedenquist, Arribas and Gonzalez-Urien2000), suggest that low-sulfidation supergene alteration in an epithermal system was active in the study area.
SUPPLEMENTARY MATERIAL
The supplementary material for this article can be found at https://doi.org/10.1180/clm.2018.19.
ACKNOWLEDGEMENTS
This research is supported by METU Scientific Research Funds BAP-07.02.2012.101 and BAP-03-09-2013-001. The authors are grateful to Banu Parlak (MTA) for performing the fluid-inclusion analysis and to the METU Central Laboratory for conducting SEM-EDX analyses. They are also grateful to the anonymous reviewers for their help in improving the manuscript and to W.D. Huff for grammar corrections and suggestions on the manuscript.